. 2017 Jun 5;216(6):1833-1847.
doi: 10.1083/jcb.201611057. Epub 2017 May 2.

Bipotent progenitors as embryonic origin of retinal stem cells

Affiliations

Bipotent progenitors as embryonic origin of retinal stem cells

Xia Tang et al. J Cell Biol. .

Abstract

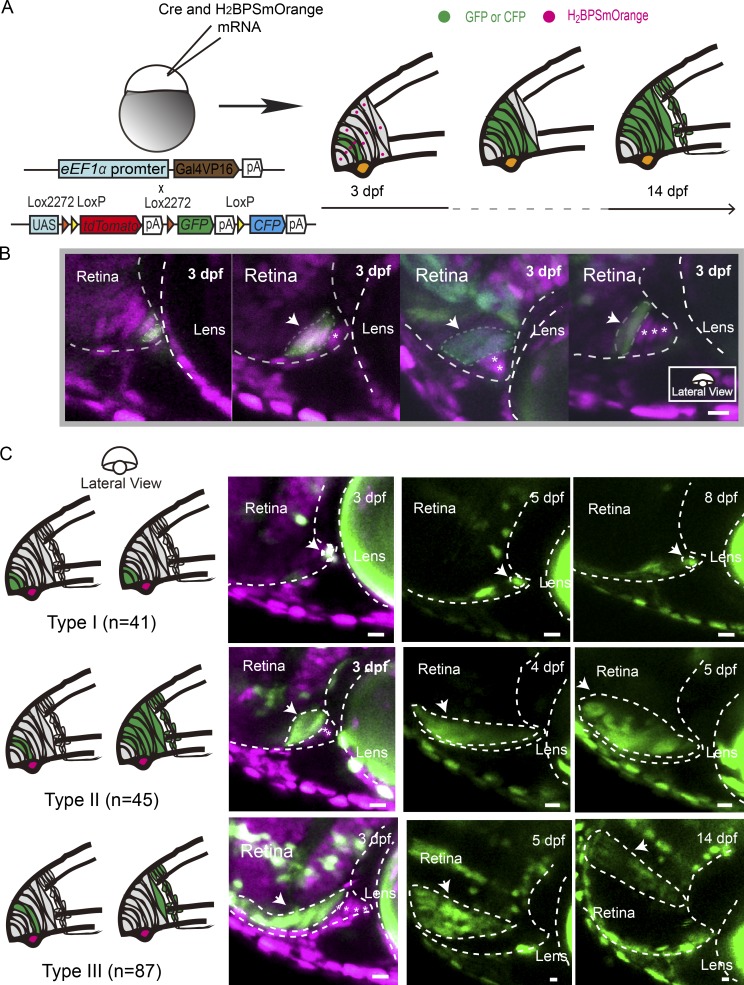
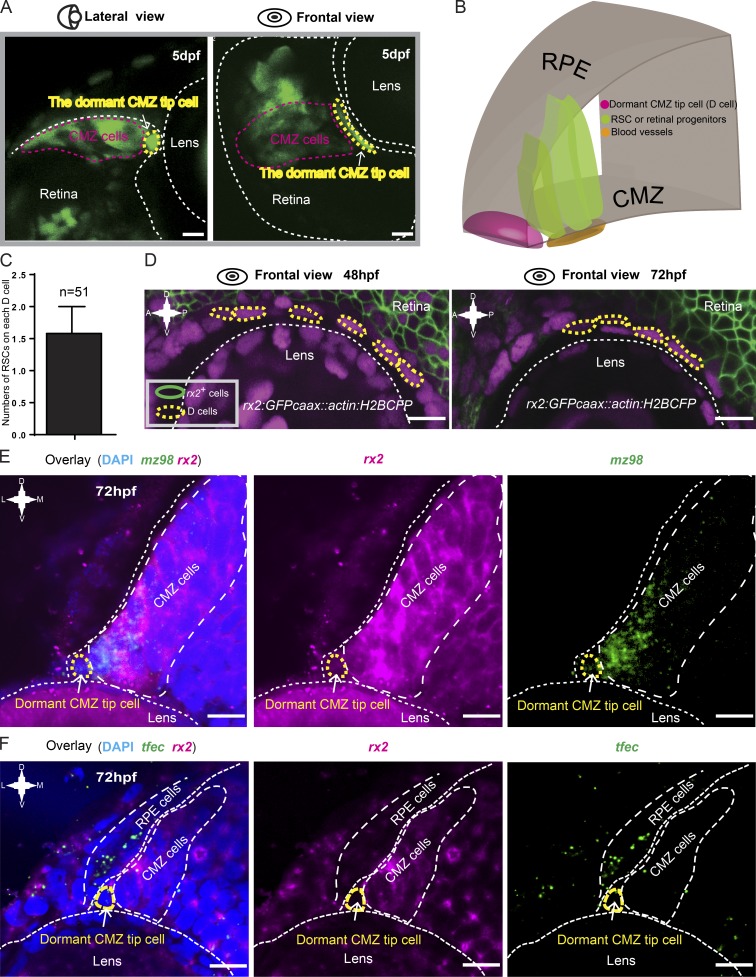
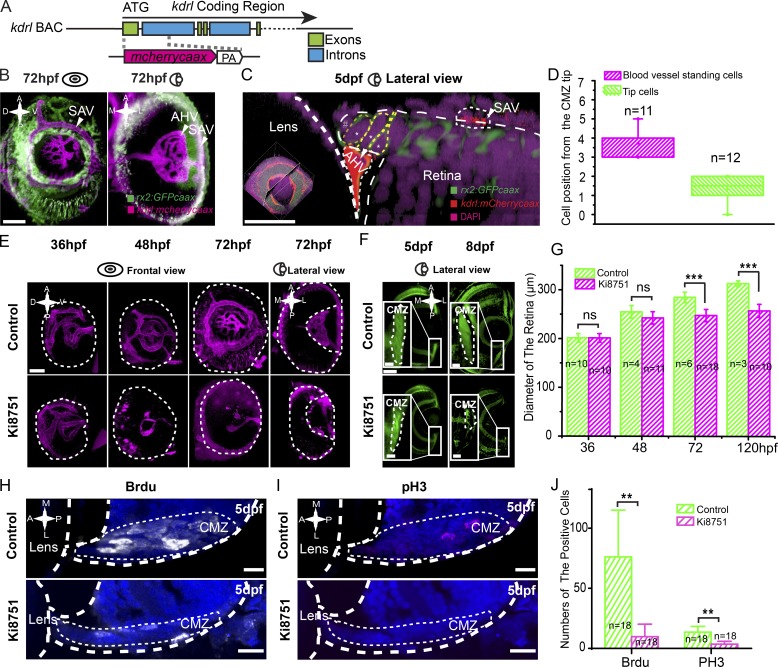
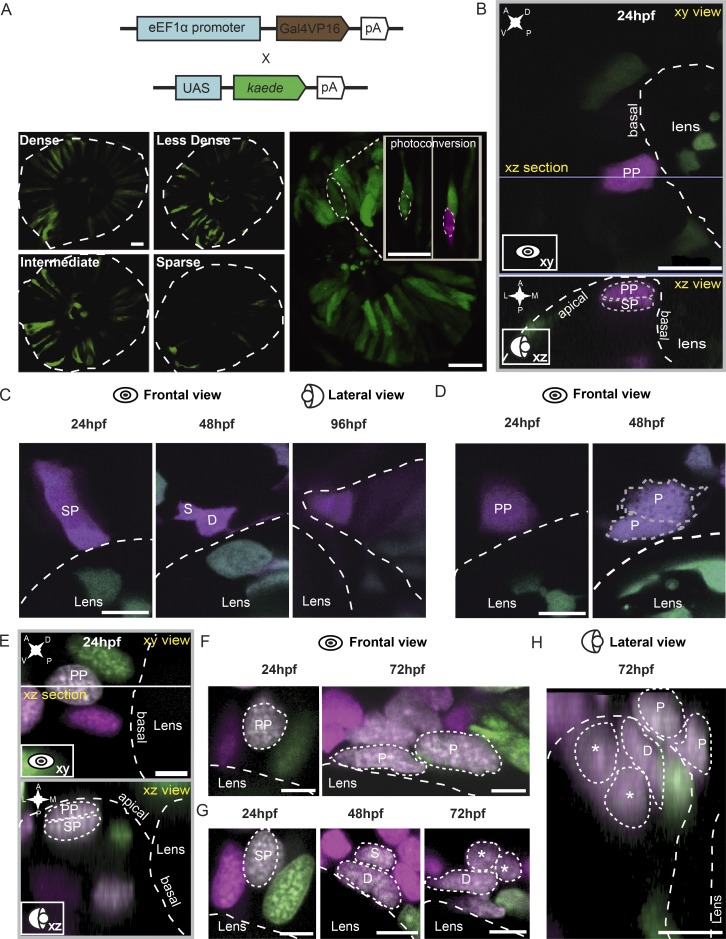
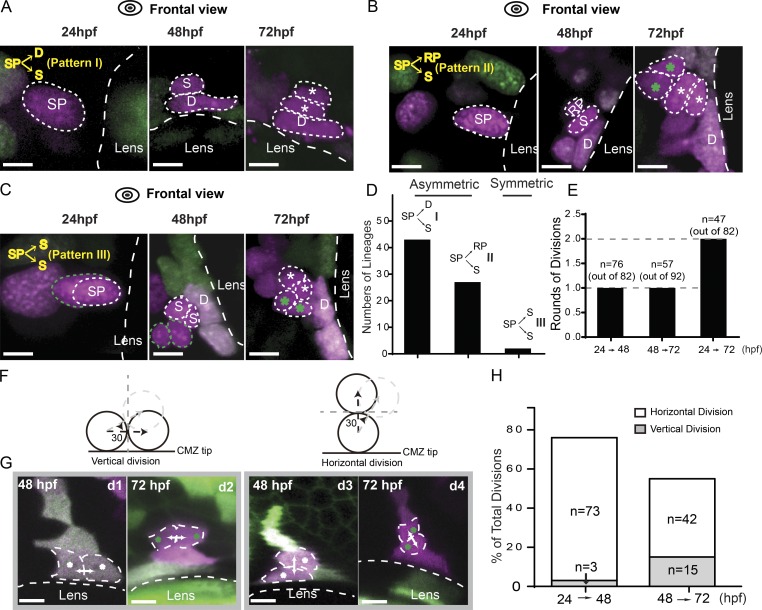
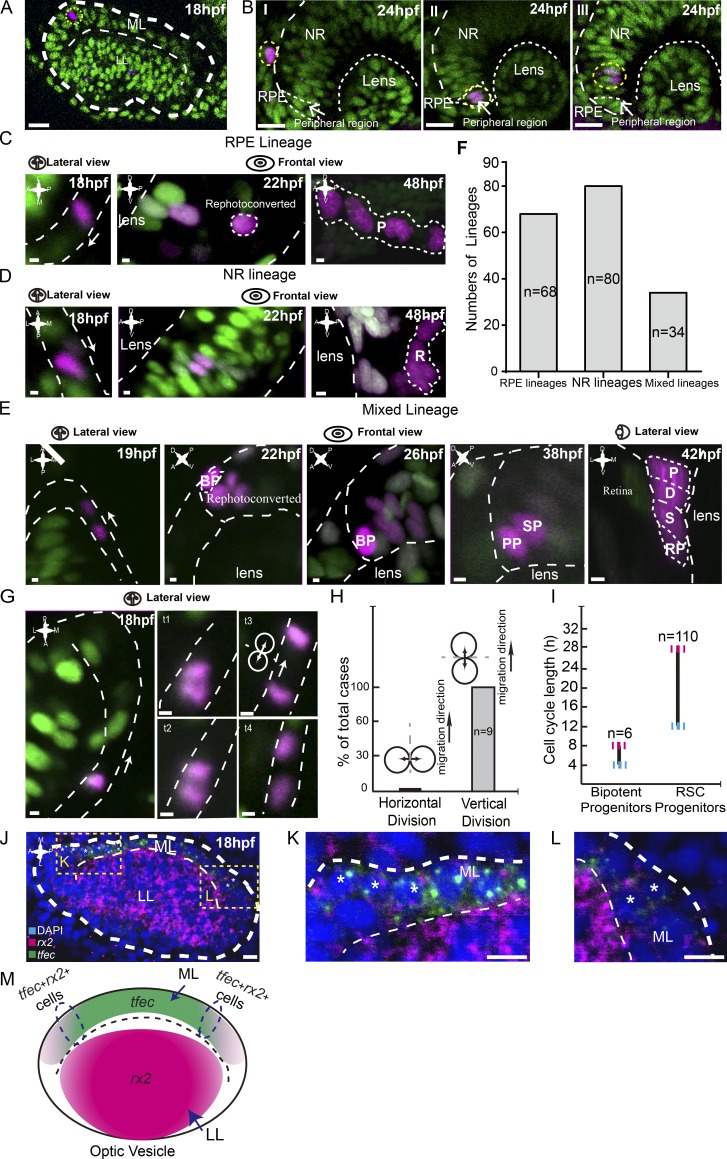
In lower vertebrates, retinal stem cells (RSCs) capable of producing all retinal cell types are a resource for retinal tissue growth throughout life. However, the embryonic origin of RSCs remains largely elusive. Using a Zebrabow-based clonal analysis, we characterized the RSC niche in the ciliary marginal zone of zebrafish retina and illustrate that blood vessels associated with RSCs are required for the maintenance of actively proliferating RSCs. Full lineage analysis of RSC progenitors reveals lineage patterns of RSC production. Moreover, in vivo lineage analysis demonstrates that these RSC progenitors are the direct descendants of a set of bipotent progenitors in the medial epithelial layer of developing optic vesicles, suggesting the involvement of the mixed-lineage states in the RSC lineage specification.


Figures

Figure 1.
Figure 1.
Characterization of CMZ cells at single-cell resolution. (A) Schematic illustrating the clonal analysis of CMZ cells. Cre mRNA and H2BPSmOrange mRNA were coinjected into zebrafish embryos (eEF1α:Gal4VP16::UAS:Zebrabow) at one cell stage. Starting at 72 hpf, sparsely labeled cells originating at different CMZ loci were selected and followed for up to 14 dpf. (B) Micrographs illustrating clones derived from the cells at the different loci of the CMZ tip region at 72 hpf (the cells at positions 1–4 are indicated from the left to the right). Gray dashed lines indicate the time window between 3 dpf and 14 dpf. (C) Type I clones originated from the tip-most first or second cell in the CMZ tip and remained in their original loci without cell proliferation as observed until 14 dpf (n = 41). Tracing of one representative Type I clone is shown until 8 dpf. Type II clones consist of marked cells, which originated from cells that were one or two cells further away from the very CMZ tip. These clones remained attached to their original location while expanding continuously (n = 45). One representative type II clone, traced until 5 dpf, is shown. In contrast, Type III clones that originated from cells that were more than three cells away from the CMZ tip at 72 hpf (Type III; n = 87) detached rapidly from the CMZ tip and formed differentiated clones within 1 or 2 d. An example trace of such Type III clone is shown from 3 until 14 dpf. Arrows indicate traced cells. Asterisks indicate CMZ tip cells labeled by H2BPSmOrange but not GFP, GFP, and tdTomato. White dashed lines outline the boundaries of retinas and lenses. Bars, 10 µm.
Figure 2.
Figure 2.
Characterization of dormant CMZ tip cells. (A) Lateral and frontal views of a representative 72-hpf Type I clone (in green) labeled by the Zebrabow-based strategy showing the characteristic cell morphology of dormant CMZ tip cells. (B) 3D schematic of the CMZ tip region, which is composed of dormant CMZ tip cells (D cells; in magenta), RSCs, and retina progenitors (in dark green). (C) Imaging analysis showing that each dormant CMZ cell directly contacts with ∼1.5 RSCs on average. The error bar shows the mean ± SD. (D) In the retina of the transgenic fish Tg(rx2:GFPcaax::actin:H2BCFP) at 48 and 72 hpf, dormant CMZ tip cells (circled by yellow dashed lines) did not have the GFPcaax signal driven by the rx2 promoter. (E) Double FISH showing the dormant CMZ tip cells express mz98 but not rx2. (F) Double FISH results showing that the tfec gene is either absent or expressed at extremely low levels in dormant CMZ tip cells. A, anterior; D, dorsal; P, posterior; V, ventral. Bars, 10 µm.
Figure 3.
Figure 3.
Blood vessels are required for actively proliferative RSCs. (A) Schematic of the design of BAC transgene kdrl:mCherrycaax. The initiation codon ATG was used. (B) 3D illustration (frontal and lateral views) of blood vessels (in magenta) in the eye of the transgenic fish line Tg(rx2:GFPcaax::kdrl:mCherrycaax). SAVs and AHVs surround the CMZ tip region. (C) A high-resolution image of a four-cell cluster of the CMZ tip region that is associated with the local blood vessels. (D) Quantification, measured by the physical cell positions of the CMZ tip region, showing that the second to fourth cells (n = 11) often directly associated with the local blood vessel (AHV), whereas dormant CMZ tip cells did not (n = 12). (E) 3D representation of the blood vessels in control eyes and eyes treated with 50 nM Ki8751 at 36, 48, and 72 hpf. (F) Representative images of the CMZ labeled in the Tg(rx2:GFPcaax) with the treatment of 50 nM Ki8751 at 5 and 8 dpf showing the reduction of the CMZ. Insets represent the enlarged CMZ. (G) Quantifications of eye diameters in embryos with or without Ki8751 treatment show a significant reduction of the eye size in the treated embryos at 72 hpf onwards. The p-values in groups of 48 hpf, 72 hpf, and 5 dpf were 0.124, 1.42 × 10⁻⁶, and 3.1 × 10⁻⁵, respectively. (H–J) BrdU and pH3 staining of the retina in embryos with or without Ki8751 treatment shows a significant reduction of cell proliferation in the CMZ of the retina in the treated embryos at 5 dpf. The p-values in groups of BrdU and pH3 were 0.002 and 0.001, respectively. Students’ t test: **, P < 0.01; ***, P < 0.001. Error bars indicate means ± SD. A, anterior; D, dorsal; P, posterior; V, ventral. Dashed lines outline the boundaries of retinas, lenses, and CMZs. Bars: (B, E, and F [main images]) 50 µm; (C) 20 µm; (F [insets], H, and I) 10 µm.
Figure 4.
Figure 4.
Identification of SPs. (A) Individual retinal progenitors were mosaically labeled to different levels in the transgenic fish Tg(eEF1α:Gal4VP16::UAS:kaede). At 24 hpf, individual cells were labeled by Kaede photoconversion. (B) Representative images of peripheral cells located in the first and second layers labeled by photoconverted Kaede in the 24 hpf optic cup from the frontal (xy) and lateral view (xz). (C) Representative images of a peripheral cell of the second layer (SP) dividing into one dormant CMZ tip cell (D) and one RSC (S) at 48 hpf and further generating the cell cluster of the CMZ tip at 96 hpf. (D) Representative images of a peripheral cell of the first layer (PP) dividing into two pigmented cells (P) at 48 hpf. (E) Representative images of peripheral cells of the first and second layers labeled by photoconverted Kaede in the 24-hpf optic cup from the frontal (xy) and lateral view (xz). (F) Representative images of a peripheral cell of the first layer (the same cell as in E) producing two pigmented cells at 72 hpf. (G) Representative images of a peripheral cell of the second layer dividing into one dormant CMZ tip cell and an RSC. The dormant cell did not divide further, whereas the RSC divided into two cells (marked by asterisks) at 72 hpf. (H) The dorsal view of the cells in F and G. Asterisks indicate two daughter cells derived from RSCs. White and gray dashed lines outline the boundaries of retinas, lenses, and cells. A, anterior; D, dorsal; L, lateral; M, medial; P, posterior; V, ventral. Bars: (A and B) 20 µm; (C–H) 5 µm.
Figure 5.
Figure 5.
Lineage patterns of RSC generation. (A) Representative images of the lineage pattern I showing one SP dividing into one dormant CMZ tip cell (D) and one RSC (S) between 24 and 48 hpf. From 48 to 72 hpf, the dormant CMZ tip cell did not divide any more, whereas the RSC continued to proliferate into more cells (indicated by asterisks). (B) Representative images of the lineage pattern II showing that one SP divided into one RSC and one retinal progenitor (RP) from 24 to 48 hpf. Between 48 and 72 hpf, the RSC produced two more cells closer to one dormant CMZ tip cell, whereas the retinal progenitor gave rise to two cells (indicated by green asterisks) far away from the dormant cell. (C) One SP cell divided into two RSCs between 24 and 48 hpf, and both of them divided once during 48 to 72 hpf to form the CMZ tip region. (D) Plot for the numbers of different lineage patterns (n = 43, 27, and 2 from I–III). Patterns I and II were asymmetric, whereas Pattern III was symmetric. (E) Plot showing the numbers of cell divisions that SPs completed within various time windows, including 24–48 hpf, 48–72 hpf, and 24–72 hpf. On average, each cell finished one round of cell divisions every 24 h. (F) Schematics of vertical and horizontal divisions. (G) Representative images of vertical (d 1 and d2) and horizontal divisions (d3 and d4) at 48 and 72 hpf. The white arrows represent cell migration directions. (H) Plot showing the frequency of the vertical and horizontal divisions within 24–48 hpf and 48–72 hpf. Dashed lines outline the boundaries of the lens and cells. Bars, 5 µm.
Figure 6.
Figure 6.
Bipotent progenitors as the embryonic origin of SPs. (A) An example of a single photoconverted cell (in magenta) in the ML of the optic vesicle at 18 hpf. Yellow dashed lines indicate traced clones. (B) Representative clones derived from single cells labeled at 18 hpf reached distinct final destinations of the optic cup at 24 hpf, including the RPE, peripheral region, and NR. (C–E) Three types of lineages originated from individual cells in the ML. RPE lineages (in C) contained RPE cells only (n = 68). NR lineages (in D) were composed of NR cells only (n = 80). Mixed lineages (in E) were composed of pigmented cells (P), dormant CMZ tip cells (D), RSCs (S), and retinal progenitors (RPs; n = 34). Mixed lineages were derived from bipotent cells (BPs). To distinguish from neighboring cells, bipotent cells were rephotoconverted in brighter red by exposure to the UV laser once more. (F) Plot of numbers of different lineages derived from individual 18-hpf cells in the ML, including RPE lineages, NR lineages, and mixed lineages. (G) Time lapse of the representative vertical division by the migrating cell in the ML. White arrows represent cell migration direction. (H) Plot showing all migrating cells in the ML divided vertically. (I) Plot showing that the cell cycle length of bipotent progenitors ranges from 4–8 h (n = 6), whereas SPs, the bipotent progenitors’ daughters, had a cell cycle length of between 12 and 28 h (n = 110). (J) Double FISH showing a set of cells in the ML expressing both rx2 and tfec, suggesting the mixed lineage state of RPE and RSCs. Yellow dashed lines indicate zoomed areas. (K and L) Zoomed images of the regions in J marked with yellow dashed squares. Asterisks indicate cells expressing both tfec and rx2 signals. (M) A schematic of the expression patterns of tfec and rx2 in the optic vesicle at 18 hpf. Some cells in the region (circled by dashed lines) express both genes. Green cells, nlsKaede; magenta cells, photoconverted nlsKaede; A, anterior; D, dorsal; L, lateral; M, medial; P, posterior; V, ventral. White dashed lines outline the boundaries of retinas, lenses, LLs, MLs, cells, and clones. The white arrows in C, D, E, and G indicate the migration directions of cells in the ML. Bars: (A and B) 20 µm; (C–E and G) 2.5 µm; (J–L) 10 µm.
Figure 7.
Figure 7.
Working model for RSC lineage specification. Fast-cycling bipotent cells (BPs; in blue) of the ML in developing optic vesicles migrate and proliferate into one PP (in black) and one SP (in red) between 18 and 26 hpf. Subsequently, slow-cycling SPs proliferate and produce three types of lineages, including two asymmetric lineage types and one symmetric lineage type. Two asymmetric lineages were composed of one RSC (S; in red) and one dormant CMZ tip cell (D; in black/red; 60% of total RSC-generating lineages) or one RSC and a retinal progenitor (RP; in red; 38%). One symmetric lineage contained two RSCs (in red; 2%). Meanwhile, PPs proliferated and produced two types of lineages, including the lineages of two pigmented cells (Ps; in black; 64%) and the lineages of one pigmented cell (in black) and one CMZ dormant tip cell (36%). Note that dormant CMZ tip cells are produced by both PPs and SPs.

Similar articles

Cited by

References

    1. Agathocleous M., and Harris W.A.. 2009. From progenitors to differentiated cells in the vertebrate retina. Annu. Rev. Cell Dev. Biol. 25:45–69. 10.1146/annurev.cellbio.042308.113259 - DOI - PubMed
    1. Ahmad I., Tang L., and Pham H.. 2000. Identification of neural progenitors in the adult mammalian eye. Biochem. Biophys. Res. Commun. 270:517–521. 10.1006/bbrc.2000.2473 - DOI - PubMed
    1. Almeida A.D., Boije H., Chow R.W., He J., Tham J., Suzuki S.C., and Harris W.A.. 2014. Spectrum of Fates: a new approach to the study of the developing zebrafish retina. Development. 141:1971–1980. 10.1242/dev.104760 - DOI - PMC - PubMed
    1. Amato M.A., Arnault E., and Perron M.. 2004. Retinal stem cells in vertebrates: parallels and divergences. Int. J. Dev. Biol. 48:993–1001. 10.1387/ijdb.041879ma - DOI - PubMed
    1. Bélanger M.C., Robert B., and Cayouette M.. 2017. Msx1-positive progenitors in the retinal ciliary margin give rise to both neural and non-neural progenies in mammals. Dev. Cell. 40:137–150. 10.1016/j.devcel.2016.11.020 - DOI - PubMed

Publication types

MeSH terms

Substances

LinkOut - more resources