

Programmed mitophagy is essential for the glycolytic switch during cell differentiation
- PMID: 28465321
- PMCID: PMC5470043
- DOI: 10.15252/embj.201695916
Programmed mitophagy is essential for the glycolytic switch during cell differentiation
Abstract
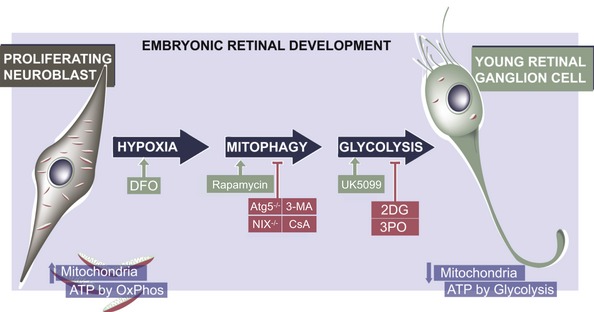
Retinal ganglion cells (RGCs) are the sole projecting neurons of the retina and their axons form the optic nerve. Here, we show that embryogenesis-associated mouse RGC differentiation depends on mitophagy, the programmed autophagic clearance of mitochondria. The elimination of mitochondria during RGC differentiation was coupled to a metabolic shift with increased lactate production and elevated expression of glycolytic enzymes at the mRNA level. Pharmacological and genetic inhibition of either mitophagy or glycolysis consistently inhibited RGC differentiation. Local hypoxia triggered expression of the mitophagy regulator BCL2/adenovirus E1B 19-kDa-interacting protein 3-like (BNIP3L, best known as NIX) at peak RGC differentiation. Retinas from NIX-deficient mice displayed increased mitochondrial mass, reduced expression of glycolytic enzymes and decreased neuronal differentiation. Similarly, we provide evidence that NIX-dependent mitophagy contributes to mitochondrial elimination during macrophage polarization towards the proinflammatory and more glycolytic M1 phenotype, but not to M2 macrophage differentiation, which primarily relies on oxidative phosphorylation. In summary, developmentally controlled mitophagy promotes a metabolic switch towards glycolysis, which in turn contributes to cellular differentiation in several distinct developmental contexts.
Keywords: BNIP3L/NIX; hypoxia; macrophages; metabolic reprogramming; retinal ganglion cells.
© 2017 The Authors.
Figures
- A
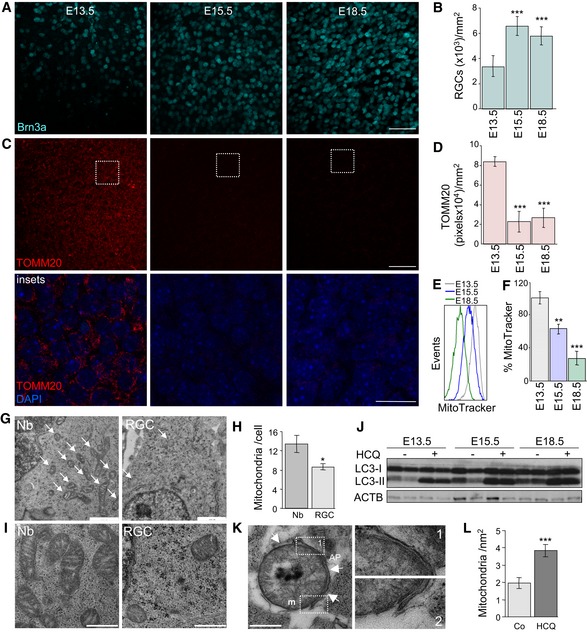
Immunostaining of the retinal ganglion cell (RCG)‐specific transcription factor Brn3a (cyan) in the RGC layer of mouse retinal flatmounts at the indicated embryonic days (E). The maximal projection in the RGC layer is shown. Scale bar, 50 μm.
- B
Quantification of RGC density per mm2 at the indicated embryonic stages in retinas stained as in (A) (n = 6 per group). Data are presented as mean ± SEM. ***P < 0.001 (Mann‐Whitney U‐test).
- C
Immunostaining with the mitochondrial marker TOMM20 (red) in the RGC layer of the same retinas as in (A). Scale bar, 50 μm. Insets show TOMM20 staining (red) and nuclei labelled with DAPI (blue) in a confocal plane in the indicated region. Scale bar, 20 μm.
- D
TOMM20‐positive pixel staining at the indicated embryonic stages labelled as in (C) (n = 6 per group). Data are presented as mean ± SEM. ***P < 0.001 (Mann‐Whitney U‐test).
- E, F
Flow cytometry histograms and percentage mean fluorescence intensity (% MitoTracker) in dissociated retinas, corresponding to different embryonic stages, stained with MitoTracker Deep Red (MTDR) (n = 5–12 retinas per group). Data are presented as mean ± SEM. **P < 0.01, ***P < 0.001 (Mann‐Whitney U‐test).
- G
Ultrastructural analysis of neuroblast (Nb) and RGC from an E15.5 mouse retina. Scale bar, 1 μm. Arrows indicate mitochondria.
- H
Quantification of the number of mitochondria per cell in G (n = 12–14 cells per group). Data are presented as mean ± SEM. *P < 0.05 (Mann‐Whitney U‐test).
- I
Mitochondrial morphology (m) in retinal Nb and RGC at E15.5. Scale bars, 500 nm.
- J
Immunoblot of retinas at different embryonic stages incubated for 3 h in the absence (−) or presence (+) of hydroxychloroquine to block autophagic flux.
- K
Autophagosomal membrane (AP) surrounding a mitochondrion (arrows in left‐hand image) in an E15.5 mouse retina in the presence of HCQ to block lysosomal degradation. Scale bar, 500 nm. Insets of the indicated areas show four adjacent membranes (right).
- L
Increase in the number of mitochondrial per nm2 in RGCs from E15.5 mouse retinas in the presence of HCQ (n = 12 per group). Data are presented as mean ± SEM. ***P < 0.001 (Mann‐Whitney U‐test).
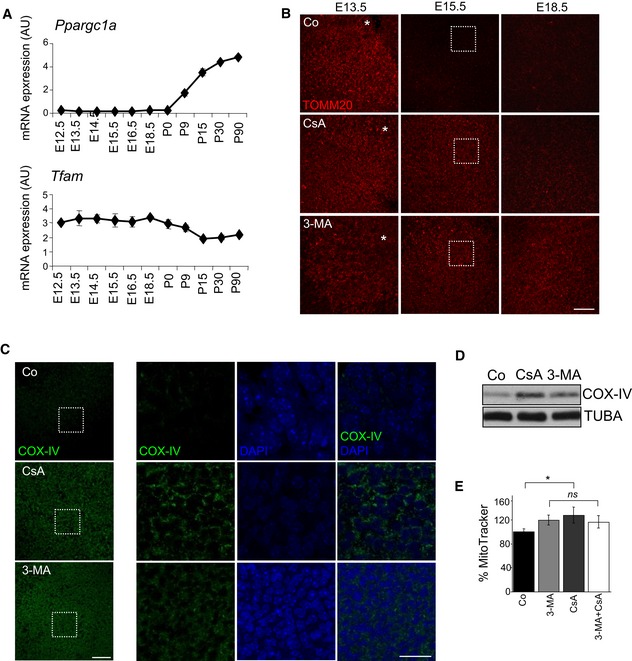
mRNA expression, determined by qRT–PCR, of the mitochondrial biogenesis regulators Ppargc1a and Tfam (n = 2–3 pools of retinas per group). Data are presented as mean ± SEM.
TOMM20 immunostaining at the indicated developmental stages in flat‐mounted retinas incubated for 6 h in the presence of 5 μM CsA or 10 mM 3‐MA. The maximal projection of the z‐stack is shown. Scale bar, 50 μm.
COX‐IV immunostaining in flat‐mounted retinas (E15.5) incubated for 6 h with 3‐MA or CsA. Maximal projections are shown on the left (scale bar, 50 μm) and single confocal planes from the boxed insets are shown on the right. COX‐IV immunostaining is shown in green and DAPI‐stained nuclei in blue. Scale bar in insets, 20 μm.
COX‐IV immunoblotting of E15.5 retinas incubated for 6 h in 3‐MA or CsA. Tubulin was used as a loading control.
Percentage of mean fluorescence intensity (% MitoTracker) in E15.5 retinas incubated with 3‐MA, CsA or a combination of both (n = 6–22 retinas per group). Data are presented as mean ± SEM. *P < 0.05 (Student's t‐test).
- A
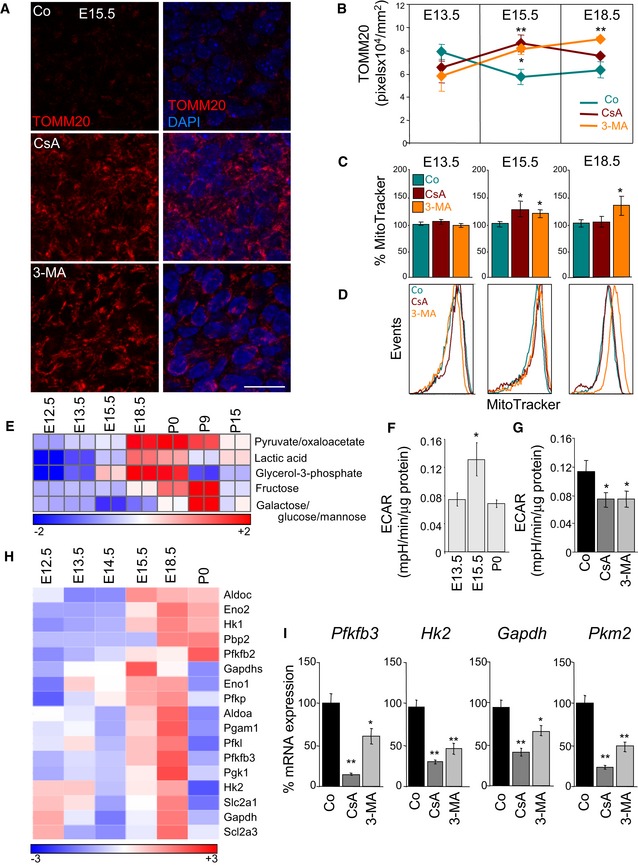
Mitochondrial labelling by TOMM20 immunostaining in flat‐mounted retinas (E15.5) incubated for 6 h in the presence of 5 μM CsA or 10 mM 3‐MA. TOMM20 immunostaining is shown in red and DAPI‐stained nuclei in blue. A single confocal plane is shown and corresponds to the inset from the lower magnification images displayed in Fig EV1B. Scale bar, 20 μm.
- B
Quantification of TOMM20 immunostaining in retinas cultured as in (A) at the indicated embryonic stages (n = 4–16 retinas per group). Data are presented as mean ± SEM. *P < 0.05, **P < 0.01 (Mann‐Whitney U‐test).
- C, D
Quantification of the percentage mean fluorescence intensity (% MitoTracker) and representative flow cytometry histograms at the indicated embryonic stages in retinal explants cultured as in (A) and stained with MTDR (n = 6–57 retinas per group). Data are presented as mean ± SEM. *P < 0.05 (Mann‐Whitney U‐test and Student's t‐test).
- E
Heat map indicating expression of glycolysis‐related metabolites in mouse retinas at different developmental stages. P0, Postnatal day 0.
- F, G
Extracellular acidification rate (ECAR) in embryonic retinas at the indicated developmental stages (F) (n = 19–49 pools of retinas per group) and in E15.5 retinas incubated for 6 h in the presence of 3‐MA or CsA (G) (n = 15–19 pools of two retinas per group). Data are presented as mean ± SEM. *P < 0.05 (Mann‐Whitney U‐test (F) and Student's t‐test (G)).
- H
Heat map showing the relative mRNA expression of glycolysis regulators as determined by transcriptomic analyses in mouse retinas at the indicated developmental stages.
- I
mRNA expression of glycolysis regulators in E15.5 retinas incubated for 6 h with 3‐MA or CsA (n = 3 pools of two retinas per group). Data are presented as mean ± SEM. *P < 0.05, **P < 0.01 (Mann‐Whitney U‐test).
- A
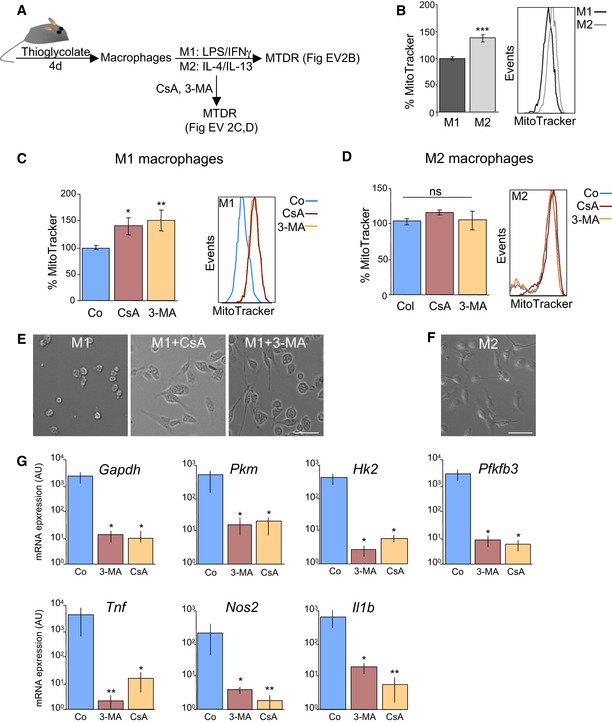
Schematic showing experimental design.
- B
Mouse peritoneal macrophages were isolated from adult mice treated for 4 days with thioglycolate and were then incubated in the presence of LPS and IFN‐γ to induce M1 polarization or with IL‐4/IL‐13 to induce the M2 phenotype. Cells were then stained with MitoTracker and assessed by flow cytometry (n = 12 per group). Data are presented as mean ± SEM. ***P < 0.001 (Mann‐Whitney U‐test).
- C, D
M1 (C) or M2 (D) macrophages were incubated for 6 h with 10 mM 3‐MA or 5 μM CsA, and MitoTracker staining was assessed by flow cytometry (C, n = 6–9 per group; D, n = 6–9 per group). Data are presented as mean ± SEM. *P < 0.05, **P < 0.01 (Mann‐Whitney U‐test).
- E, F
Representative images of M1 macrophages (E) after incubation with 3‐MA or CsA and M2 macrophages (F). Scale bars, 50 μm.
- G
mRNA expression of the indicated genes in M1 macrophages cultured in the presence of 10 mM 3‐MA or 5 μM CsA (n = 6 per group). Data are presented as mean ± SEM. *P < 0.05, **P < 0.01 (ANOVA).
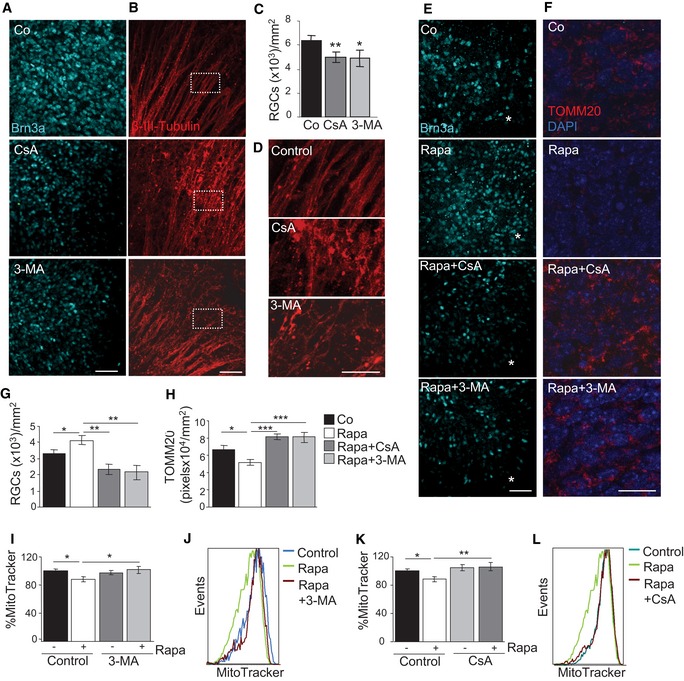
- A–D
(A) Assessment of RGC differentiation by Brn3a immunostaining in E15.5 retinas incubated for 6 h with 10 mM 3‐MA or 5 μM CsA. Maximal projection is displayed. Scale bar, 50 μm. (B) β‐III‐tubulin immunostaining of RGC axons in retinal flatmounts from E15.5 retinas incubated for 6 h with 10 mM 3‐MA or 5 μM CsA. Maximal projection is displayed. Scale bar, 50 μm. Magnified images of boxed regions are shown in (D). (C) Quantification of the number of RGCs in E15.5 retinas incubated as in (A) (n = 8–12 retinas per group). Data are presented as mean ± SEM. *P < 0.05, **P < 0.01 (Mann‐Whitney U‐test).
- E
Assessment of RGC differentiation by Brn3a immunostaining in retinal flatmounts from E13.5 retinas incubated with 200 nM rapamycin in the absence or presence of 3‐MA or CsA. Scale bar, 50 μm. Asterisks indicate the optic nerve.
- F
TOMM20 immunostaining in E13.5 retinas incubated as in (E). Scale bar, 20 μm.
- G
Quantification of the number of RGCs in retinas cultured as in (E) (n = 5–18 retinas per group). Data are presented as mean ± SEM. *P < 0.05, **P < 0.01 (Mann‐Whitney U‐test).
- H
Quantification of TOMM20 immunostaining in E13.5 retinas incubated as in (F) (n = 9–22 per group). Data are presented as mean ± SEM. *P < 0.05, ***P < 0.001 (Mann‐Whitney U‐test).
- I, J
(I) Percentage mean fluorescence intensity (% MitoTracker) in E13.5 retinas incubated for 6 h with rapamycin in the absence or presence of 3‐MA, and a representative flow cytometry histogram (J) (n = 8–23 retinas per group). Data are presented as mean ± SEM. *P < 0.05 (Mann‐Whitney U‐test).
- K, L
(K) Percentage mean fluorescence intensity (% MitoTracker) in E13.5 retinas incubated for 6 h with rapamycin in the absence or presence of CsA, and a representative flow cytometry histogram (L) (n = 8–23 retinas per group). Data are presented as mean ± SEM. *P < 0.05, **P < 0.01 (Mann‐Whitney U‐test).
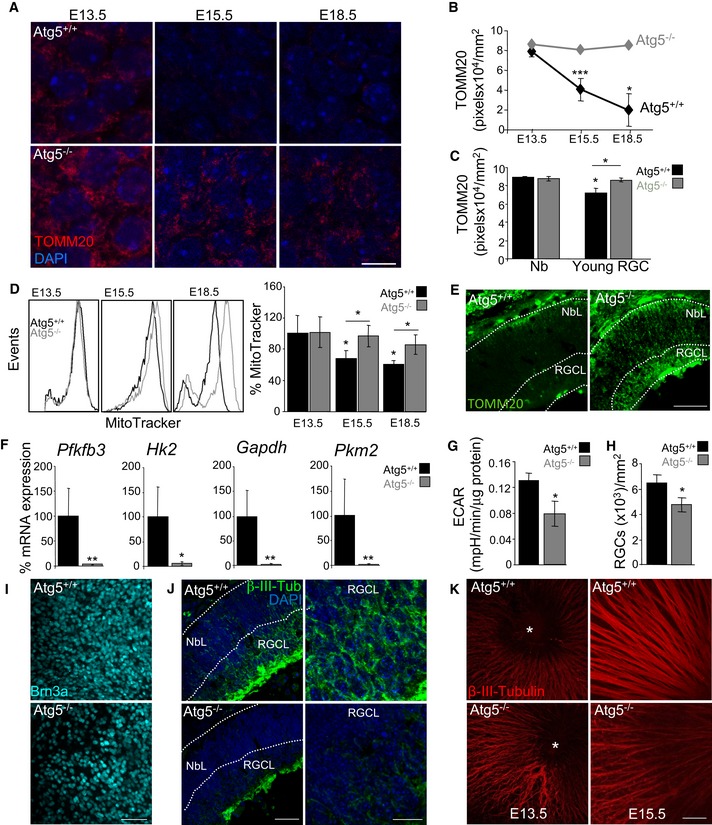
TOMM20 immunostaining in wild‐type (Atg5+/+) and Atg5‐deficient (Atg5−/−) retinal whole mounts corresponding to the indicated embryonic stages. At E13.5, the central retina is shown where the young RGCs are located. Scale bar, 10 μm.
Quantification of TOMM20 immunostaining in retinas from (A) (n = 4–15 retinas per group). Data are presented as mean ± SEM. *P < 0.05, ***P < 0.001 (Mann‐Whitney U‐test).
Quantification of TOMM20 immunostaining in peripheral (Nb) and central (young RGCs) areas of wild‐type (Atg5+/+) and Atg5‐deficient (Atg5−/−) retinas at E13.5 (n = 4–15 retinas per group). Data are presented as mean ± SEM. *P < 0.05 (Mann‐Whitney U‐test).
Flow cytometry histograms and mean fluorescence intensity in dissociated retinas, stained with MTDR, corresponding to different embryonic stages, and corresponding quantification (n = 7–16 retinas per group). Data are presented as mean ± SEM. *P < 0.05 (Mann‐Whitney U‐test).
TOMM20 immunostaining in E15.5 retinal sections from wild‐type (Atg5+/+) and Atg5‐deficient (Atg5−/−) retinas. NbL, neuroblast layer; RGCL, retinal ganglion cell layer. Scale bar, 75 μm.
mRNA expression of the indicated genes in wild‐type (Atg5+/+) and Atg5‐deficient (Atg5−/−) retinas at E15.5 (n = 5–6 pools of two retinas per group). Data are presented as mean ± SEM. *P < 0.05, **P < 0.01 (Mann‐Whitney U‐test).
Extracellular acidification rate (ECAR) in wild‐type (Atg5+/+) and Atg5‐deficient (Atg5−/−) at E15.5 (n = 11–15 pools of two retinas per group). Data are presented as mean ± SEM. *P < 0.05 (Mann‐Whitney U‐test).
Quantification of the number of RGCs in (I) (n = 11–12 retinas per group). Data are presented as mean ± SEM. *P < 0.05 (Mann‐Whitney U‐test).
Assessment of RGC differentiation by Brn3a immunostaining in retinal flatmounts from wild‐type (Atg5+/+) and Atg5‐deficient (Atg5−/−) mouse retinas at E15.5. Scale bar, 50 μm.
β‐III‐tubulin immunostaining (green) of RGCs in retinal sections from E15.5 Atg5‐deficient mice. DAPI‐stained nuclei are shown in blue. Scale bar, 75 μm. Higher magnification images of the RGCL are shown on the right. Scale bar, 20 μm.
β‐III‐tubulin immunostaining of RGCs axons in retinal flatmounts from E13.5 and E15.5 retinas from wild‐type (Atg5+/+) and Atg5‐deficient (Atg5−/−) animals. Scale bar, 50 μm.
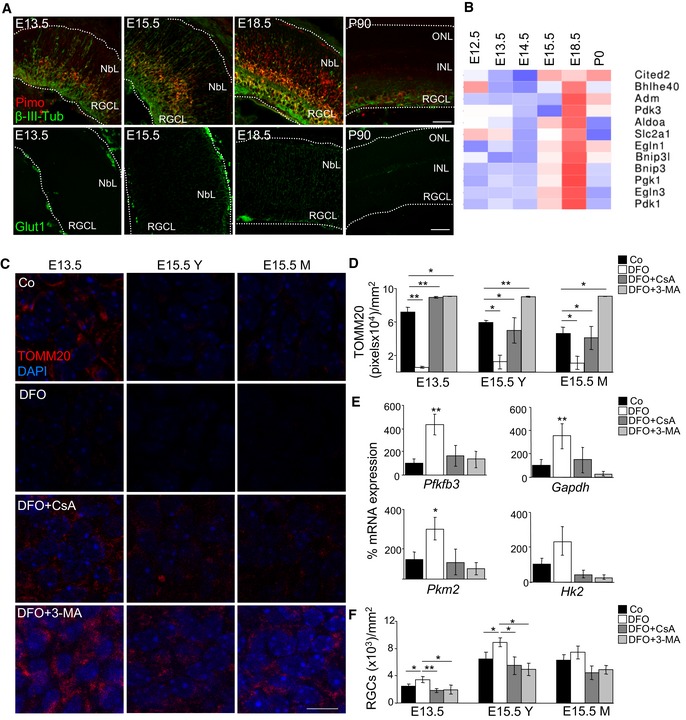
- A
Immunostaining for pimonidazole (red), β‐III‐tubulin (green, upper row) and SLC2A1 (green, bottom row) in mouse eye sections at the indicated stages. NbL, neuroblast layer; RGCL, retinal ganglion cell layer; INL, inner nuclear layer; ONL, outer nuclear layer. Scale bar, 50 μm.
- B
Heat map showing the relative mRNA expression of HIF‐1 alpha target genes as determined by transcriptomic analyses in mouse retinas at the indicated developmental stages.
- C, D
TOMM20 immunostaining and corresponding quantification in retinal flatmounts corresponding to E13.5 and E15.5 retinas incubated with the hypoxia inducer DFO (1 mM) in the absence or presence of CsA or 3‐MA (n = 3–8 retinas per group). Scale bar, 10 μm. Y (young) indicates the peripheral area of the E15.5 retina containing less mature RGCs, and M (mature) indicates the centre of the retina, containing more mature RGCs. Data are presented as mean ± SEM. *P < 0.05, **P < 0.01 (Mann‐Whitney U‐test).
- E
mRNA expression of the indicated genes in E15.5 retinas treated as in C (n = 3–8 pools of two retinas per group). Data are presented as mean ± SEM. *P < 0.05, **P < 0.01 (Mann‐Whitney U‐test).
- F
Quantification of RGC number after Brn3a immunostaining in retinas treated as in (C) (n = 3–9 per group). Data are presented as mean ± SEM. *P < 0.05, **P < 0.01 (Mann‐Whitney U‐test).
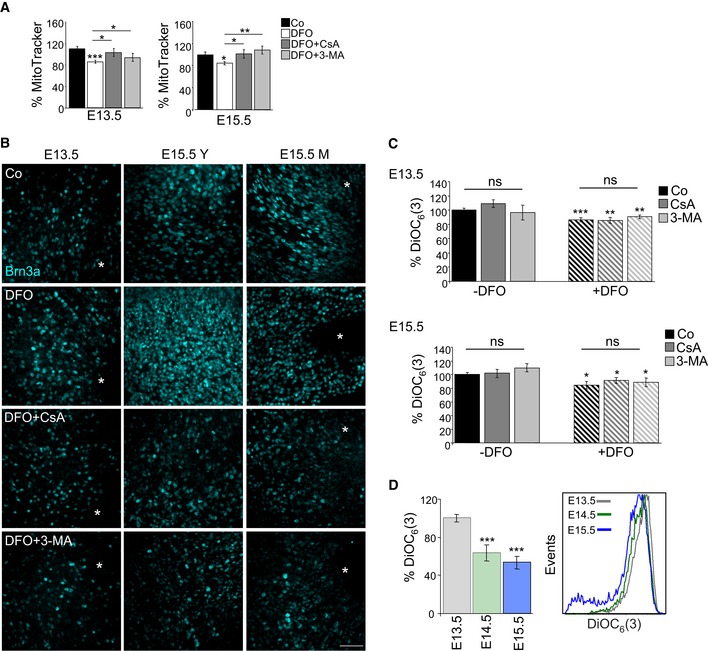
Percentage mean fluorescence intensity (% MitoTracker) in E13.5 and E15.5 retinas incubated for 6 h with DFO in the absence or presence of 3‐MA or CsA (n = 8–14 retinas per group). Data are presented as mean ± SEM. *P < 0.05, **P < 0.01, ***P < 0.001 (Mann‐Whitney U‐test and Student's t‐test).
Assessment of RGC differentiation by Brn3a immunostaining in retinal flatmounts. Image shows Brn3a immunostaining in retinal flatmounts corresponding to E13.5 and E15.5 retinas incubated with the hypoxia inducer DFO (1 mM) in the absence or presence of CsA or 3‐MA. Scale bar, 50 μm. Y (young) indicates the peripheral area of the E15.5 retina containing less mature RGCs, and M (mature) indicates the centre of the retina, containing more mature RGCs.
Chemical hypoxia results in decreased mitochondrial membrane potential as determined by flow cytometry with DiOC6(3) in E13.5 (n = 5–24 retinas per group) and E15.5 (n = 9–21 retinas per group) retinas incubated with the hypoxia inducer DFO (1 mM) in the absence or presence of CsA or 3‐MA. Data are presented as mean ± SEM. *P < 0.05, **P < 0.01, ***P < 0.001 (Mann‐Whitney U‐test).
Determination of mitochondrial membrane potential by flow cytometry with DiOC6(3) in retinas at the indicated embryonic stages (n = 10–16 retinas per group). Data are presented as mean ± SEM. ***P < 0.001 (Mann‐Whitney U‐test).
- A
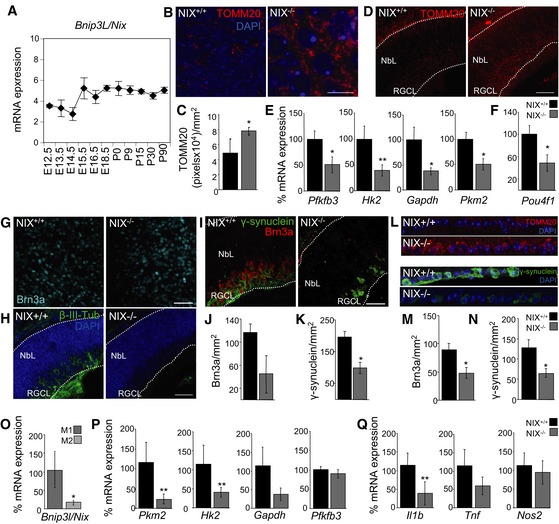
qPCR measurement of BNIP3L/NIX mRNA expression in mouse retinas at indicated developmental stages (n = 2–3 pools of retinas per embryonic stage). Data are presented as mean ± SEM.
- B, C
TOMM20 immunostaining (B) and corresponding quantification (C) (n = 4–8 retinas per group) in retinal flatmounts from wild‐type and NIX‐deficient mice at E15.5. Scale bar, 10 μm. Data are presented as mean ± SEM. *P < 0.05 (Mann‐Whitney U‐test).
- D
Immunostaining for TOMM20 (red) in retinal sections from E15.5 wild‐type and NIX‐deficient mice. DAPI‐stained nuclei are shown in blue. NbL, neuroblast layer; RGCL, retinal ganglion cell layer. Scale bar, 75 μm.
- E
mRNA expression of the indicated genes in E15.5 wild‐type (NIX+/+) and NIX‐deficient (NIX−/−) mouse retinas (n = 5–8 pools of two retinas per group). Data are presented as mean ± SEM. *P < 0.05, **P < 0.01 (Mann‐Whitney U‐test).
- F
mRNA expression of Pou4f1 (Brn3a) in E15.5 wild‐type (NIX+/+) and NIX‐deficient (NIX−/−) retinas (n = 5–8 pools of two retinas per group). Data are presented as mean ± SEM. *P < 0.05 (Student's t‐test).
- G
Assessment of RGC differentiation by Brn3a immunostaining in retinal flatmounts from E15.5 wild‐type (NIX+/+) and NIX‐deficient (NIX−/−) mice. Scale bar, 50 μm.
- H
β‐III‐tubulin immunostaining (green) in retinal sections from E15.5 wild‐type and NIX−/−‐deficient mice. DAPI‐stained nuclei are shown in blue. NbL, neuroblast layer; RGCL, retinal ganglion cell layer. Scale bar, 75 μm.
- I
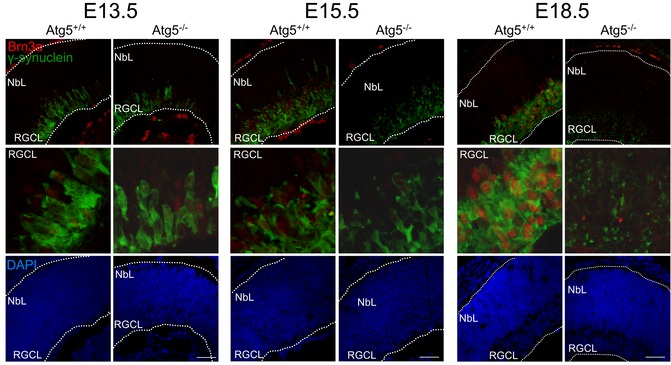
Brn3a (red) and γ‐synuclein (green) staining in retinal sections from E15.5 wild‐type and NIX‐deficient mice. Scale bar, 50 μm.
- J
Quantification of RGC number after Brn3a immunostaining in the RGC layer in eye sections from E15.5 wild‐type (NIX+/+) and NIX‐deficient (NIX−/−) mice (n = 4 eyes per group). Data are presented as mean ± SEM (Mann‐Whitney U‐test).
- K
Quantification of RGC number after γ‐synuclein immunostaining in the RGC layer in eye sections from E15.5 wild‐type (NIX+/+) and NIX‐deficient (NIX−/−) mice (n = 4 eyes per group). Data are presented as mean ± SEM. *P < 0.05 (Mann‐Whitney U‐test).
- L
Immunostaining of the RGCL for TOMM20 (red), γ‐synuclein (green) and DAPI (blue) in retinal sections from adult wild‐type and NIX‐deficient mice.
- M
Quantification of RGC number after Brn3a immunostaining in the RGC layer in eye sections from adult wild‐type (NIX+/+) and NIX‐deficient (NIX−/−) mice (n = 3 eyes per group). Data are presented as mean ± SEM. *P < 0.05 (Mann‐Whitney U‐test).
- N
Quantification of RGC number after γ‐synuclein immunostaining in the RGC layer in eye sections from adult wild‐type (NIX+/+) and NIX‐deficient (NIX−/−) mice (n = 3 eyes per group). Data are presented as mean ± SEM. *P < 0.05 (Mann‐Whitney U‐test).
- O
qPCR measurement of BNIP3L/NIX mRNA expression in M1 and M2 macrophages (n = 6 per group). Data are presented as mean ± SEM. *P < 0.05 (Mann‐Whitney U‐test).
- P, Q
qPCR measurement of mRNA expression of glycolytic (P) and proinflammatory markers (Q) in M1 peritoneal macrophages from wild‐type (NIX+/+) and NIX‐deficient (NIX−/−) mice (n = 6–8 per group). Data are presented as mean ± SEM. **P < 0.01 (Mann‐Whitney U‐test).
- A
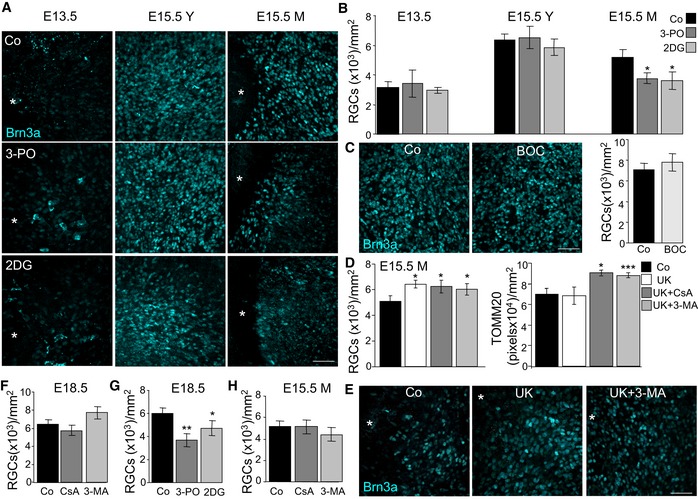
Brn3a immunostaining of RGCs in flat‐mounted retinas corresponding to the indicated embryonic stages incubated with the glycolysis inhibitors 3‐PO (10 μM) or 2DG (10 mM). Scale bar, 50 μm.
- B
Quantification of the number of RGCs in E13.5 and E15.5 retinas incubated as in (A) (n = 3–12 retinas per group). Data are presented as mean ± SEM. *P < 0.05 (Mann‐Whitney U‐test).
- C
Caspase inhibition does not influence RGC differentiation as determined by Brn3a immunostaining of RGCs in flat‐mounted E15.5 retinas treated with the pan‐caspase inhibitor Bob‐D‐FMK. Scale bar, 50 μm (n = 4 retinas per group). Data are presented as mean ± SEM (Mann‐Whitney U‐test).
- D
Quantification of RGC number and TOMM20 immunostaining in E15.5 retinas treated with 40 μM of UK5099 in the absence or presence of CsA or 3‐MA (n = 6–10 retinas per group). Data are presented as mean ± SEM. *P < 0.05, ***P < 0.001 (Mann‐Whitney U‐test).
- E
Brn3a immunostaining of RGCs in flat‐mounted retinas corresponding to E15.5 retinas incubated with UK in absence or presence of 3‐MA. Scale bar, 50 μm.
- F, G
Quantification of RGC number in E18.5 retinas treated with CsA or 3‐MA (F) (n = 3–7 retinas per group) and with 3‐PO or 2DG (G) (n = 6–12 retinas per group). Data are presented as mean ± SEM. *P < 0.05, **P < 0.01 (Mann‐Whitney U‐test).
- H
Quantification of RGC number in E15.5 retinas treated with CsA and 3‐MA (n = 9–12 retinas per group). Data are presented as mean ± SEM (Mann‐Whitney U‐test).
- A, B
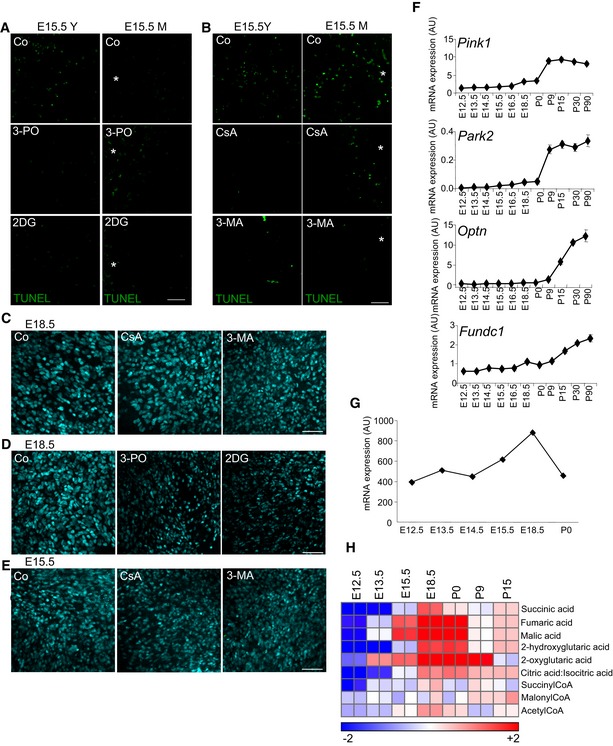
TUNEL staining to assess cell death in E15.5 retinas treated with the indicated treatments. Scale bar, 50 μm.
- C
Brn3a immunostaining of RGCs in flat‐mounted E18.5 retinas incubated with CsA or 3‐MA. Scale bar, 50 μm.
- D
Brn3a immunostaining of RGCs in flat‐mounted E18.5 retinas incubated with 3‐PO or 2DG. Scale bar, 50 μm.
- E
Brn3a immunostaining of RGCs in the mature region of flat‐mounted E15.5 retinas incubated with CsA or 3‐MA. Scale bar, 50 μm.
- F
qRT–PCR analysis of mRNA expression of the mitophagy regulators Pink1, Park2, Optn and Fundc1 (n = 2–3 pools of retinas per group). Data are presented as mean ± SEM.
- G
mRNA expression of LDHA in retinas at the indicated ages.
- H
VAccumulation of TCA cycle intermediates during retinal development.
Comment in
-
NIX-ing mitochondria: from development to pathology.EMBO J. 2017 Jun 14;36(12):1650-1652. doi: 10.15252/embj.201797110. Epub 2017 May 22. EMBO J. 2017. PMID: 28533231 Free PMC article.
-
BNIP3L/NIX-dependent mitophagy regulates cell differentiation via metabolic reprogramming.Autophagy. 2018;14(5):915-917. doi: 10.1080/15548627.2017.1332567. Epub 2018 Feb 9. Autophagy. 2018. PMID: 28614042 Free PMC article.
References
-
- Aerbajinai W, Giattina M, Lee YT, Raffeld M, Miller JL (2003) The proapoptotic factor Nix is coexpressed with Bcl‐xL during terminal erythroid differentiation. Blood 102: 712–717 - PubMed
-
- Agathocleous M, Harris WA (2013) Metabolism in physiological cell proliferation and differentiation. Trends Cell Biol 23: 484–492 - PubMed
MeSH terms
Substances
Grants and funding
LinkOut - more resources
Full Text Sources
Other Literature Sources
Molecular Biology Databases
