. 2017 Jul 20;130(3):245-257.
doi: 10.1182/blood-2017-03-772715. Epub 2017 May 2.

Endogenous hepcidin and its agonist mediate resistance to selected infections by clearing non-transferrin-bound iron

Affiliations

Endogenous hepcidin and its agonist mediate resistance to selected infections by clearing non-transferrin-bound iron

Deborah Stefanova et al. Blood. .

Abstract

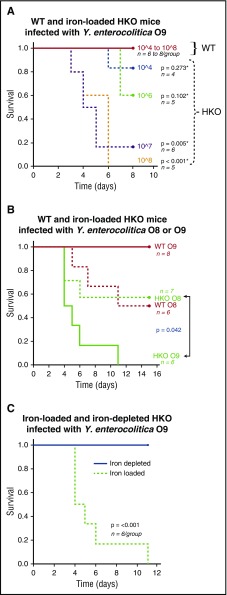
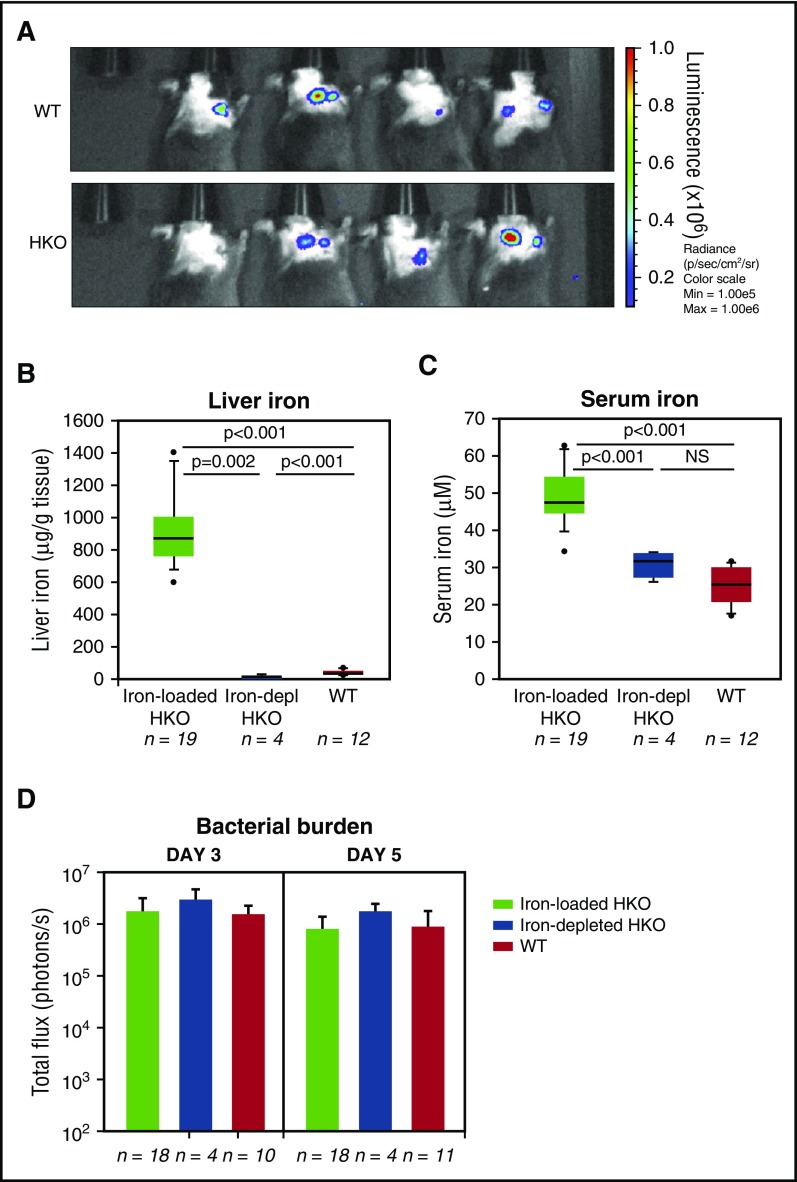
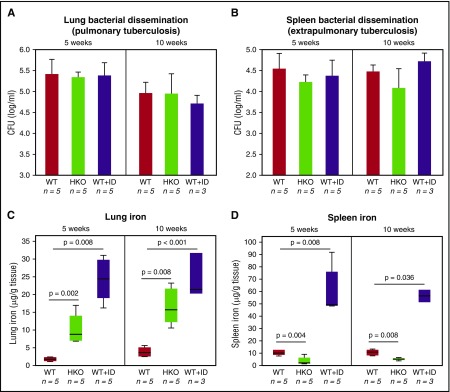
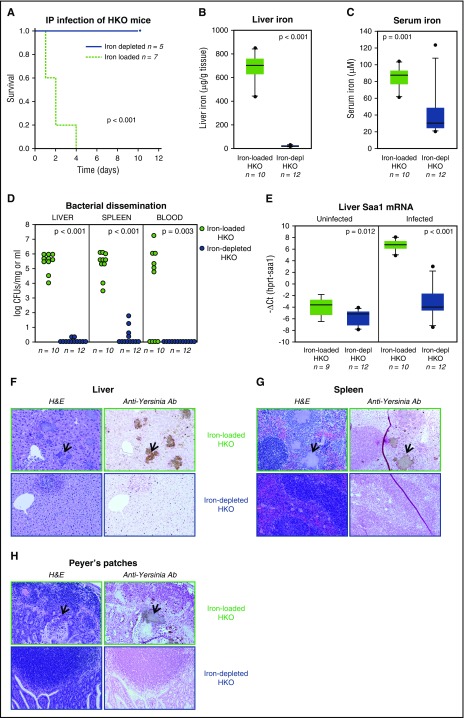
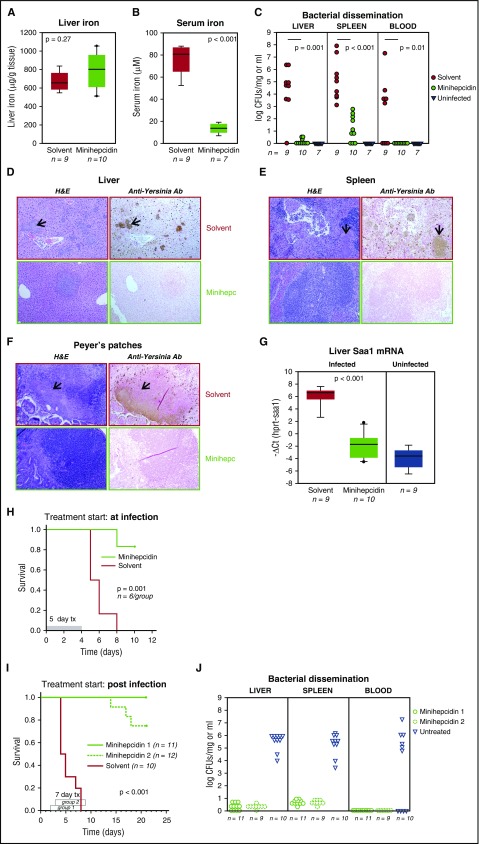
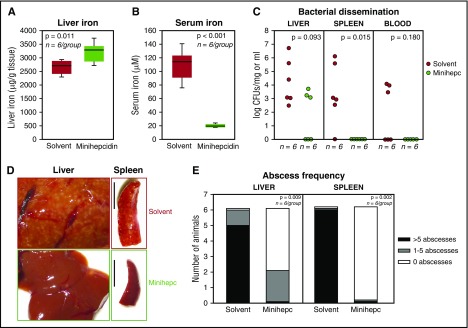
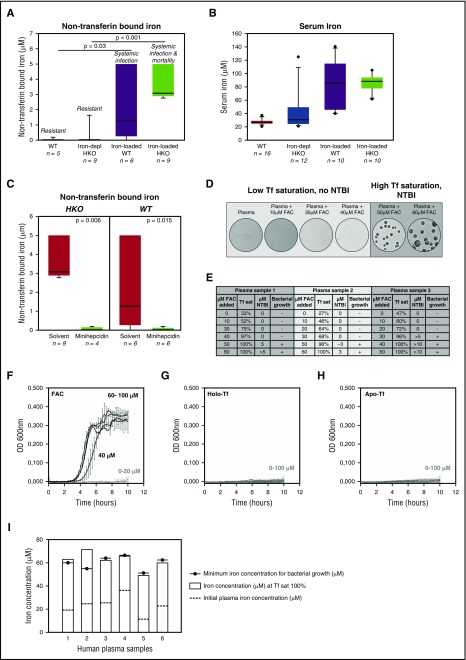
The iron-regulatory hormone hepcidin is induced early in infection, causing iron sequestration in macrophages and decreased plasma iron; this is proposed to limit the replication of extracellular microbes, but could also promote infection with macrophage-tropic pathogens. The mechanisms by which hepcidin and hypoferremia modulate host defense, and the spectrum of microbes affected, are poorly understood. Using mouse models, we show that hepcidin was selectively protective against siderophilic extracellular pathogens (Yersinia enterocolitica O9) by controlling non-transferrin-bound iron (NTBI) rather than iron-transferrin concentration. NTBI promoted the rapid growth of siderophilic but not nonsiderophilic bacteria in mice with either genetic or iatrogenic iron overload and in human plasma. Hepcidin or iron loading did not affect other key components of innate immunity, did not indiscriminately promote intracellular infections (Mycobacterium tuberculosis), and had no effect on extracellular nonsiderophilic Y enterocolitica O8 or Staphylococcus aureus Hepcidin analogs may be useful for treatment of siderophilic infections.


Figures

Figure 1.
Figure 1.
Hepcidin deficiency and resulting iron overload promote mortality from siderophilic but not nonsiderophilic Y enterocolitica. (A) Survival after oral infection with increasing doses of siderophilic Y enterocolitica O9 (104-108 CFUs per mouse) of WT mice with normal iron status or naturally iron-loaded HKO mice. *Comparison of HKO to WT mice infected with the same dose. (B) Survival curve for WT or naturally iron-loaded HKO mice infected through oral gavage with 108 CFUs per mouse Y enterocolitica serotype O9 (siderophilic) or O8 (nonsiderophilic). (C) Survival of naturally iron-loaded or dietary iron-depleted HKO mice after oral infection with 108 CFUs per mouse Y enterocolitica O9. Infection with siderophilic O9 bacteria resulted in significantly greater mortality than infection with nonsiderophilic O8 bacteria in iron-loaded HKO mice. Survival is defined in “Methods.” Statistical comparison of survival was performed using multifactorial Kaplan-Meier log-rank analysis.
Figure 2.
Figure 2.
Hepcidin deficiency and iron overload do not alter susceptibility to catheter-associated infection with gram-positive S aureus. (A) A 0.5-cm catheter piece was incubated for 15 minutes at 107 CFU/mL bioluminescent S aureus and implanted under the skin of mice. Infection burden was assessed by in vivo bioluminescence imaging every other day starting on day 1 after surgery. Representative images from day 3 are shown. (B-C) Liver and serum iron in iron-loaded and iron-depleted HKO mice and WT mice. (D) Bacterial burden as measured by total luminescence flux was maximal on days 3 and 5, but similar between iron-loaded HKO, iron-depleted HKO, and WT mice. Statistical analysis was performed using the Student t test (B: ID HKO vs WT; C) or Mann-Whitney U test (the rest). Max, maximum; Min, minimum; NS, not significant.
Figure 3.
Figure 3.
M tuberculosis infection is not affected by hepcidin deficiency or iron loading in mice. Control WT mice, naturally iron-loaded HKO mice, and parenterally iron-loaded WT mice (iron-dextran injection, WT + ID) were infected with 30 CFUs of M tuberculosis (aerosol). After 5 and 10 weeks, there was no difference between the 3 groups of mice in pulmonary (A) or extrapulmonary (B) bacterial burden as assessed by tissue CFUs. (C-D) Lung and spleen iron concentration. Statistical analysis: Student t test if data were normally distributed (C: WT vs HKO 5 weeks, WT vs WT+ID 10 weeks; D: WT vs HKO, 5 weeks) and Mann-Whitney U test if they were not normally distributed.
Figure 4.
Figure 4.
Iron overload promotes rapid growth and dissemination of Y enterocolitica O9. (A) Survival of naturally iron-loaded or dietary iron-depleted HKO mice after IP infection with 108 CFU Y enterocolitica O9 is comparable to that after oral infection (Figure 1C) indicating that intestinal bacterial translocation is not the critical iron-dependent step. (B-H) Iron-loaded or iron-depleted (depl) HKO mice were orally infected with 108 CFUs per mouse Y enterocolitica O9. (B-C) Liver and serum iron concentrations confirmed iron loading and iron depletion of HKO mice. (D) Iron-loaded HKOs had dramatically increased bacterial dissemination to the liver, spleen, and blood as assessed by tissue CFUs, and consequently (E) much higher liver Saa1 mRNA expression compared with iron-depleted HKOs. (F-H) Hematoxylin and eosin (H&E) and staining with antibody (Ab) specific for Y enterocolitica O9 of tissue sections from the liver, spleen, and Peyer patches of iron-loaded (in green rectangles) or iron-depleted (in blue rectangles) HKO mice; ×10 magnification. Arrows point to bacterial abscesses. Survival is defined in “Methods.” Statistical analysis of survival curves (A) was performed using multifactorial Kaplan-Meier log-rank analysis. Statistical analysis in panels B through E was performed using the Student t test for normally distributed data (D: spleen CFUs; E) and the Mann-Whitney U test for data that were not normally distributed. ΔCt, Δcycle threshold; hprt, hypoxanthine-guanine phosphoribosyltransferase.
Figure 5.
Figure 5.
High extracellular iron promotes Y enterocolitica O9 virulence, and lowering of plasma iron by minihepcidin treatment prevents mortality. (A-H) Iron-loaded HKO mice were orally infected with 108 CFUs of Y enterocolitica O9 and treated with solvent or minihepcidin (Minihepc; 100 nmol). Minihepcidin treatment did not alter liver iron (A) but lowered serum iron (B) and prevented bacterial dissemination to the liver, spleen, and blood (C). (D-F) H&E or anti–Y enterocolitica antibody staining of tissue sections from the liver, spleen, and Peyer patches of solvent-treated (in red rectangles) or minihepcidin-treated (in green rectangles) HKO mice; ×10 magnification. Arrows point to bacterial abscesses. (G) Liver Saa1 mRNA expression. (H) Survival curves. (I-J) Iron-loaded HKO mice were orally infected with 108 CFUs per mouse Y enterocolitica O9 and treated with solvent or minihepcidin for 7 days starting on day 2 (Minihepcidin 1) or 3 (Minihepcidin 2) after infection. (I) Survival curve. (J) Bacterial dissemination and tissue burden for minihepcidin-treated groups was assayed at euthanasia (on day 21 after infection). Tissue CFUs of iron-loaded moribund HKO mice were used for comparison (D). Survival is defined in “Methods.” Statistical analysis: The Student t test was used for normally distributed data (B; C: spleen CFUs; G) and the Mann-Whitney U test for data that were not normally distributed (A; C: liver and blood CFUs). Survival (H-I) was analyzed using Kaplan-Meier log-rank. tx, treatment.
Figure 6.
Figure 6.
Minihepcidin treatment is beneficial even in mice with intact hepcidin regulation and iatrogenic iron overload. WT mice were iron loaded through IP injection of 20 mg of iron dextran on day −1, then orally infected with 108 CFUs of Y enterocolitica O9 on day 0 and treated with solvent or minihepcidin (100 nmol per day) for 10 days. (A-B) Liver and serum iron levels. (C) Bacterial dissemination to liver, spleen, and blood assessed by CFUs (whole liver and spleen). (D) Gross pathology of liver and spleen, with many abscesses visible in the tissues from solvent group. Scale bar, 1 cm. (E) Abscess proportion analysis (χ2 test) showed abscess formation predominantly in solvent-treated animals, whereas minihepcidin treatment rescued the phenotype. Statistical analysis was done using the Student t test for normally distributed data (A; B; C: liver CFUs) and the Mann-Whitney U test for data that are not normally distributed (C). Data in panel F were analyzed using the χ2 test.
Figure 7.
Figure 7.
Bacterial growth depends on NTBI. (A-E) Y enterocolitica and (F-I) V vulnificus. (A) NTBI and (B) serum iron measurements in WT, iron-depleted HKO, iron-loaded WT, and iron-loaded HKO mice. Presence of NTBI correlates with the severity of Y enterocolitica infection. (C) Minihepcidin treatment abolished NTBI in serum of iron-loaded WT and HKO mice. (D) Microscopy images (magnification ×4) of bacterial growth 24 hours after plating Y enterocolitica O9 (106 CFU/mL) on agar plates made of human plasma supplemented with 0 to 60 μM FAC. Bacterial growth was observed only in the samples with measurable NTBI (dark gray section). (E) Transferrin (Tf) saturation (sat), NTBI concentration, and bacterial growth on agar plates made from plasma of 3 different donors. Statistical analysis (A,C): Mann-Whitney U test. (F-I) V vulnificus (1 × 10³ CFU/mL) were grown in vitro in human plasma supplemented with (F) 0 to 100 μM FAC, (G) 0 to 100 μM holo-Tf, or (H) 0 to 100 μM apo-Tf. V vulnificus growth was initiated only when 40 to 100 μM FAC was added to the plasma at which point transferrin saturation reached 100%. Bacteria did not grow in plasma supplemented with holo-Tf or apo-Tf. Each line represents mean (n = 3) ± standard deviation. (I) V vulnificus growth was measured in 6 different human plasma samples supplemented with a range of FAC. Black circle indicates the iron concentration at which V vulnificus growth was initiated. White bar shows plasma iron concentration at which transferrin saturation reached 100% for each sample. Dashed line indicates baseline plasma iron concentration for each human sample. V vulnificus growth in vitro in human plasma occurred only when transferrin was nearly completely saturated. OD, optical density.

Comment in

Similar articles

Cited by

References

    1. Rodriguez R, Jung CL, Gabayan V, et al. . Hepcidin induction by pathogens and pathogen-derived molecules is strongly dependent on interleukin-6. Infect Immun. 2014;82(2):745-752. - PMC - PubMed
    1. Nemeth E, Ganz T. Regulation of iron metabolism by hepcidin. Annu Rev Nutr. 2006;26:323-342. - PubMed
    1. Christopher GW. Escherichia coli bacteremia, meningitis, and hemochromatosis. Arch Intern Med. 1985;145(10):1908. - PubMed
    1. Gerhard GS, Levin KA, Price Goldstein J, Wojnar MM, Chorney MJ, Belchis DA. Vibrio vulnificus septicemia in a patient with the hemochromatosis HFE C282Y mutation. Arch Pathol Lab Med. 2001;125(8):1107-1109. - PubMed
    1. Manso C, Rivas I, Peraire J, Vidal F, Richart C. Fatal Listeria meningitis, endocarditis and pericarditis in a patient with haemochromatosis. Scand J Infect Dis. 1997;29(3):308-309. - PubMed

MeSH terms