. 2017 Apr 15;31(8):774-786.
doi: 10.1101/gad.294991.116. Epub 2017 May 2.

Mutant IDH1 regulates the tumor-associated immune system in gliomas

Affiliations

Mutant IDH1 regulates the tumor-associated immune system in gliomas

Nduka M Amankulor et al. Genes Dev. .

Abstract

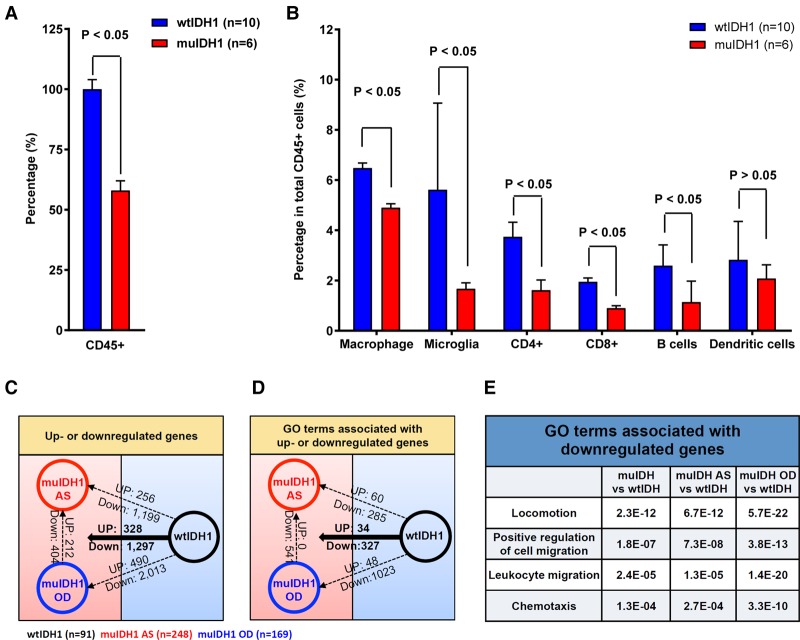
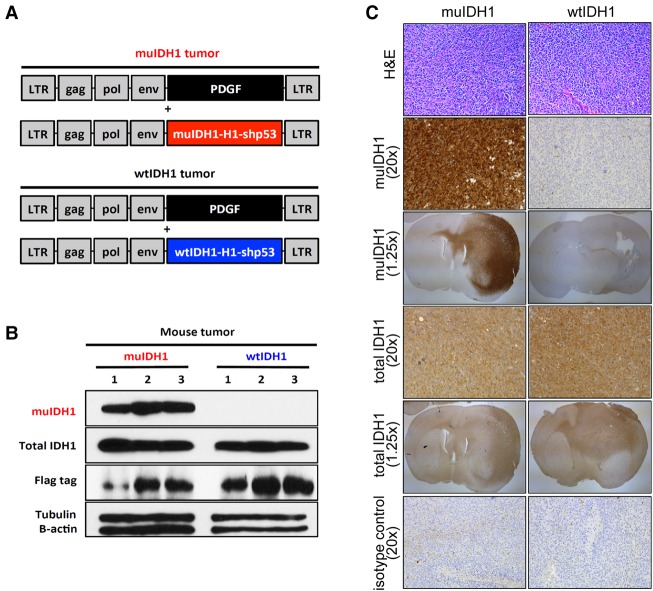
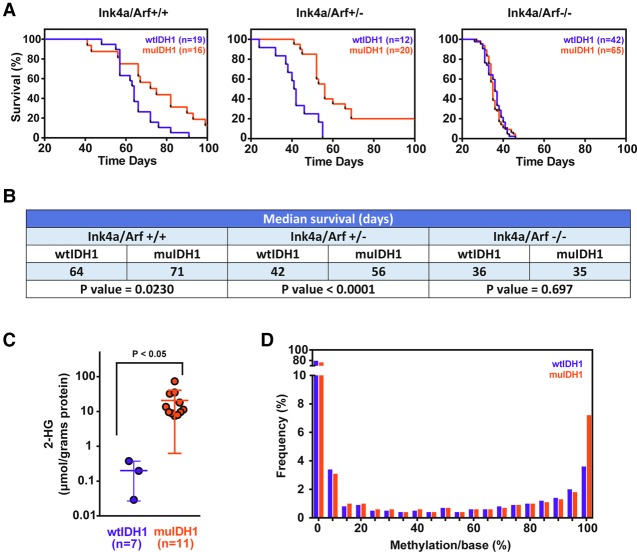
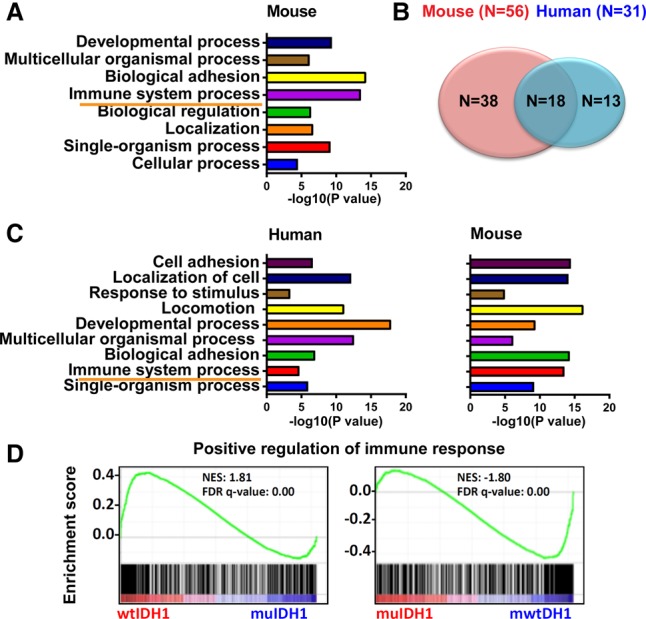
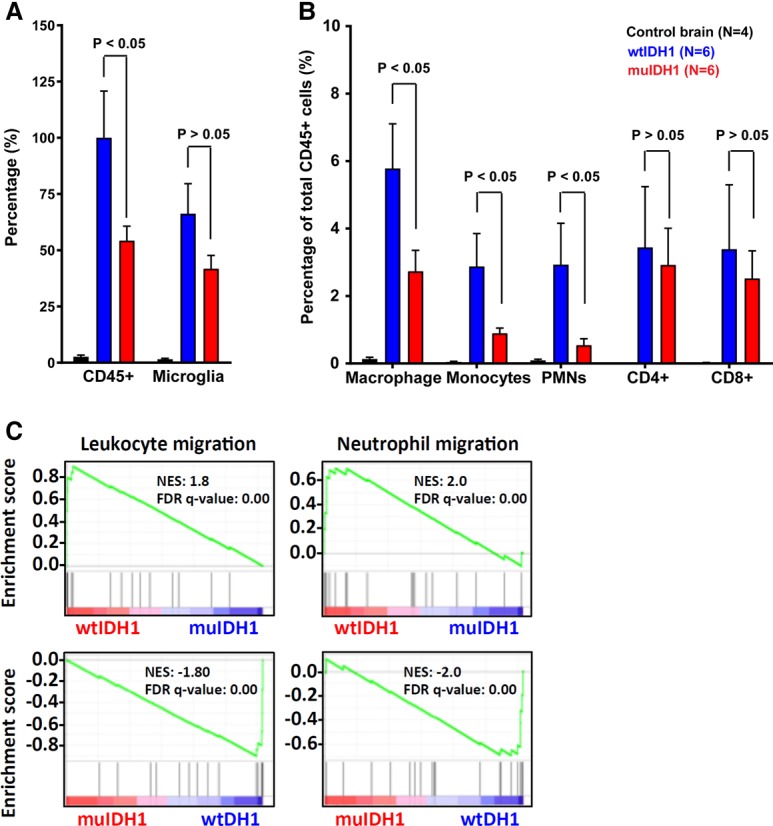
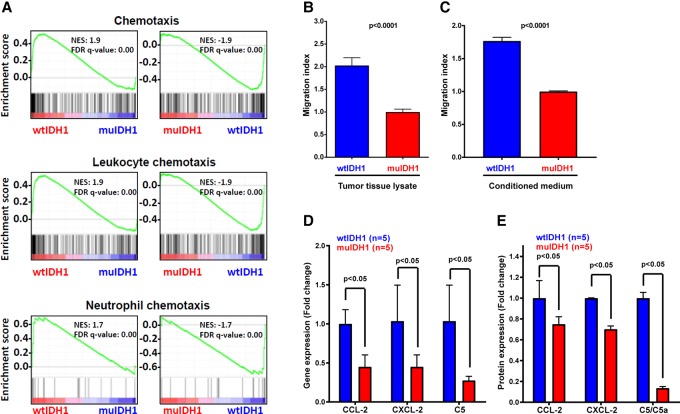
Gliomas harboring mutations in isocitrate dehydrogenase 1/2 (IDH1/2) have the CpG island methylator phenotype (CIMP) and significantly longer patient survival time than wild-type IDH1/2 (wtIDH1/2) tumors. Although there are many factors underlying the differences in survival between these two tumor types, immune-related differences in cell content are potentially important contributors. In order to investigate the role of IDH mutations in immune response, we created a syngeneic pair mouse model for mutant IDH1 (muIDH1) and wtIDH1 gliomas and demonstrated that muIDH1 mice showed many molecular and clinical similarities to muIDH1 human gliomas, including a 100-fold higher concentration of 2-hydroxygluratate (2-HG), longer survival time, and higher CpG methylation compared with wtIDH1. Also, we showed that IDH1 mutations caused down-regulation of leukocyte chemotaxis, resulting in repression of the tumor-associated immune system. Given that significant infiltration of immune cells such as macrophages, microglia, monocytes, and neutrophils is linked to poor prognosis in many cancer types, these reduced immune infiltrates in muIDH1 glioma tumors may contribute in part to the differences in aggressiveness of the two glioma types.

Keywords: IDH mutation; glioma; immuno-oncology.


Figures

Figure 1.
Figure 1.
Human muIDH1 gliomas had repressed tumor-associated immune systems. (A,B) FACS analysis using wtIDH1 (n = 10) and muIDH1 (n = 6) human glioma tissues to quantify tumor-associated immune cells. Error bars show the standard error of mean (SEM). Analysis was done using Student's t-test. (C) Summary of the number of up-regulated and down-regulated genes between two glioma groups: wtIDH1 human low-grade gliomas (LGGs, black, n = 91), human muIDH1 astrocytomas (AS, red; n = 248), and human muIDH1 oligodendrogliomas (OD, blue; n = 169), (D) Summary of the number of gene ontology (GO) terms associated with up-regulated and down-regulated genes between two glioma groups. (E) Immune-related GO terms and corresponding P-values that are associated with the down-regulated genes in muIDH1 human gliomas.
Figure 2.
Figure 2.
muIDH1-expressing mouse gliomas were generated using RCAS/tva technology. (A) Three RCAS vectors expressing PDGFa (black), human wtIDH1-shp53 with H1 promoter (wtIDH1-H1-shp53; blue), and human muIDH1-shp53 with H1 promoter (muIDH1-H1-shp53; red). IDH1 R132H was used for muIDH1. (B) Western blotting using mouse glioma tissues to verify muIDH1 expression. Glioma tissues were harvested from each glioma group (n = 3) and subjected to Western blotting using the IDH1 R132H antibody. All three muIDH1 mouse gliomas expressed muIDH1, while wtIDH1 mouse gliomas lacked muIDH1 expression. (C) Images of wtIDH1 and muIDH1 mouse gliomas using hematoxylin and eosin (H&E) staining and immunohistochemistry. Immunohistochemistry showed that muIDH1 expression was limited to muIDH1 mouse tumors. Images taken with 1.25× objectives show whole mouse brain sections with tumors infiltrating into normal brain tissue.
Figure 3.
Figure 3.
muIDH1 mouse gliomas resembled muIDH1 human gliomas. (A) Survival plots of muIDH1 versus wtIDH1 mouse gliomas with different genomic backgrounds (Ntva_Ink4a/Arf+/+, Ntva_Ink4a/Arf+/−, and Ntva_Ink4a/Arf−/−) (Hambardzumyan et al. 2009). (B) Table showing median survivals and P-values. (C) 2-HG concentrations in murine gliomas. Metabolites from murine glioma tissues were extracted followed by DATAN derivatization. 2-HG was measured with liquid chromatography-mass spectrometry. Seven and 11 metabolite extracts were used for the wtIDH1 and muIDH1 mouse glioma groups, respectively. Error bars show the standard deviation (SD). Analysis was done using Student's t-test. (D) CpG island methylation analysis using reduced representation bisulfite sequencing (RRBS). n = 4 muIDH1; n = 2 wtIDH1.
Figure 4.
Figure 4.
muIDH1 mouse gliomas resembled muIDH1 human gliomas. (A) PANTHER overrepresentation test using the down-regulated genes in muIDH1 mouse gliomas. (B,C) Overlaps of clustered GO terms between mouse and human muIDH1 gliomas. (D) GSEA using the human immune response gene set.
Figure 5.
Figure 5.
FACS analysis using muIDH1 and wtIDH1 mouse gliomas to quantify immune cells. (A) Normalized data showing total CD45+ cells and microglia relative to total CD45+ cells in wtIDH1 mouse gliomas. (B) Quantitation of each immune cell type. (C) GSEA plots showing that the gene expression of wtIDH1 mouse gliomas was positively associated with leukocyte migration, in contrast to muIDH1 mouse gliomas. Error bars show the SEM. Analysis was done using Student's t-test.
Figure 6.
Figure 6.
Quantitative analysis of chemotaxis and chemokines. (A) GSEA plots showing that the gene expression of wtIDH1 mouse gliomas was positively associated with chemotaxis, leukocyte chemotaxis, and neutrophil chemotaxis, in contrast to muIDH1 mouse gliomas. (B) Migration index using wtIDH1 (n = 5) and muIDH1 (n = 9) tumor tissue lysates. (C) Migration index using conditioned medium from wtIDH1 (n = 5) and muIDH1 (n = 9) tumor-derived cells. (D) mRNA expression of CCL-2, CXCL-2, and C5 using quantitative PCR. (E) Protein expression of CCL-2, CXCL-2, and C5. Error bars show the SEM. Analysis was done using Student's t-test.

Similar articles

Cited by

References

    1. Akalin A, Kormaksson M, Li S, Garrett-Bakelman FE, Figueroa ME, Melnick A, Mason CE. 2012. methylKit: a comprehensive R package for the analysis of genome-wide DNA methylation profiles. Genome Biol 13: R87. - PMC - PubMed
    1. Badie B, Schartner JM. 2000. Flow cytometric characterization of tumor-associated macrophages in experimental gliomas. Neurosurgery 46: 957–961. - PubMed
    1. Bai H, Harmanci AS, Erson-Omay EZ, Li J, Coskun S, Simon M, Krischek B, Ozduman K, Omay SB, Sorensen EA, et al. 2016. Integrated genomic characterization of IDH1-mutant glioma malignant progression. Nat Genet 48: 59–66. - PMC - PubMed
    1. Bolouri H, Zhao LP, Holland EC. 2016. Big data visualization identifies the multidimensional molecular landscape of human gliomas. Proc Natl Acad Sci 113: 5394–5399. - PMC - PubMed
    1. Brennan CW, Verhaak RG, McKenna A, Campos B, Noushmehr H, Salama SR, Zheng S, Chakravarty D, Sanborn JZ, Berman SH, et al. 2013. The somatic genomic landscape of glioblastoma. Cell 155: 462–477. - PMC - PubMed

Publication types

MeSH terms

Substances