. 2017 Apr 15;31(8):757-773.
doi: 10.1101/gad.293027.116. Epub 2017 May 2.

Elevated FOXG1 and SOX2 in glioblastoma enforces neural stem cell identity through transcriptional control of cell cycle and epigenetic regulators

Affiliations

Elevated FOXG1 and SOX2 in glioblastoma enforces neural stem cell identity through transcriptional control of cell cycle and epigenetic regulators

Harry Bulstrode et al. Genes Dev. .

Abstract

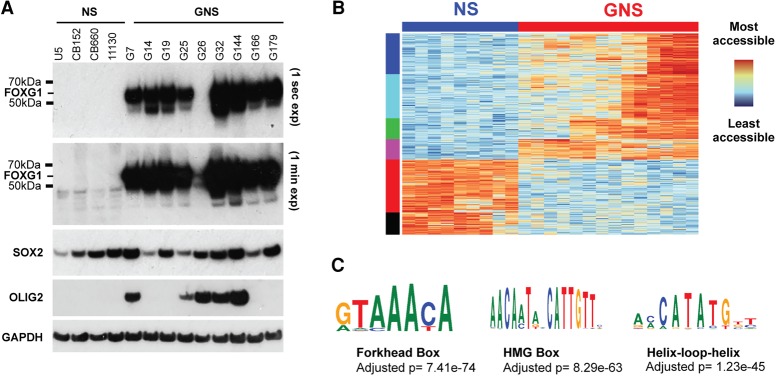
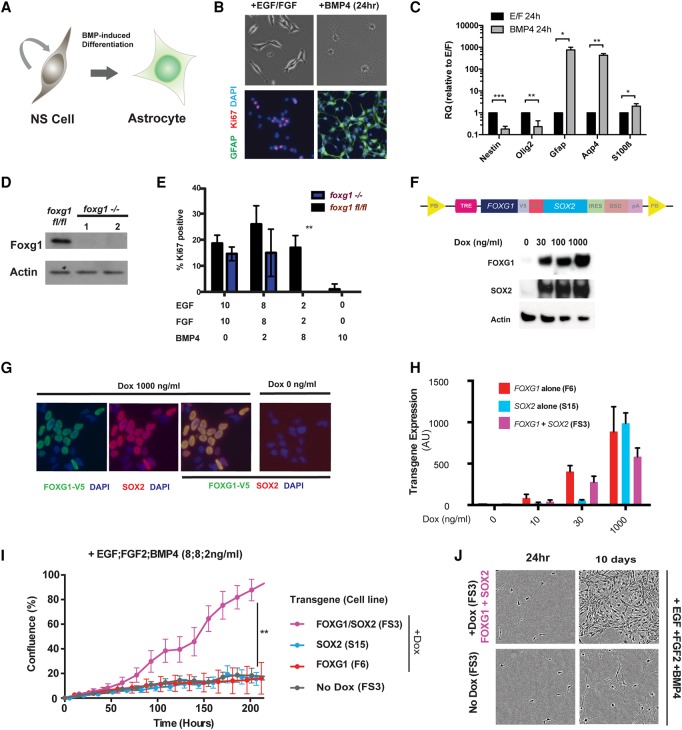
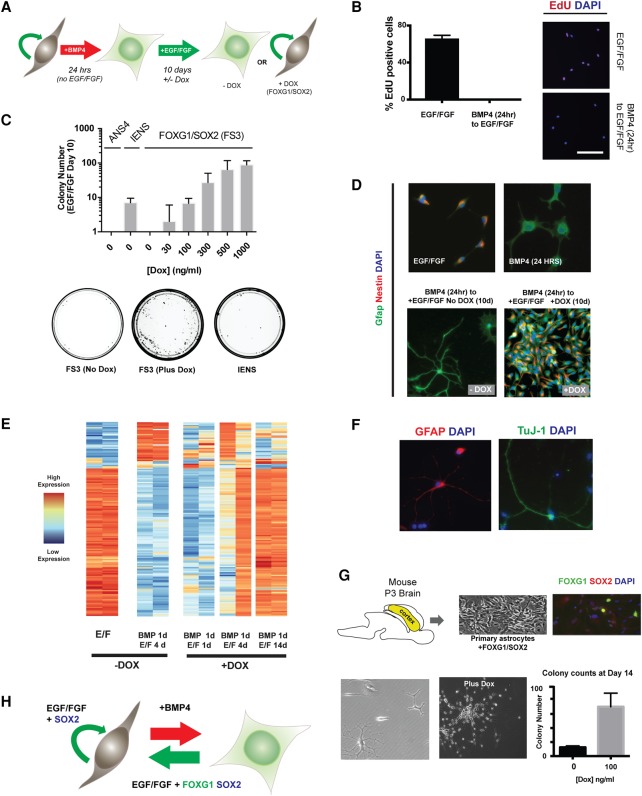
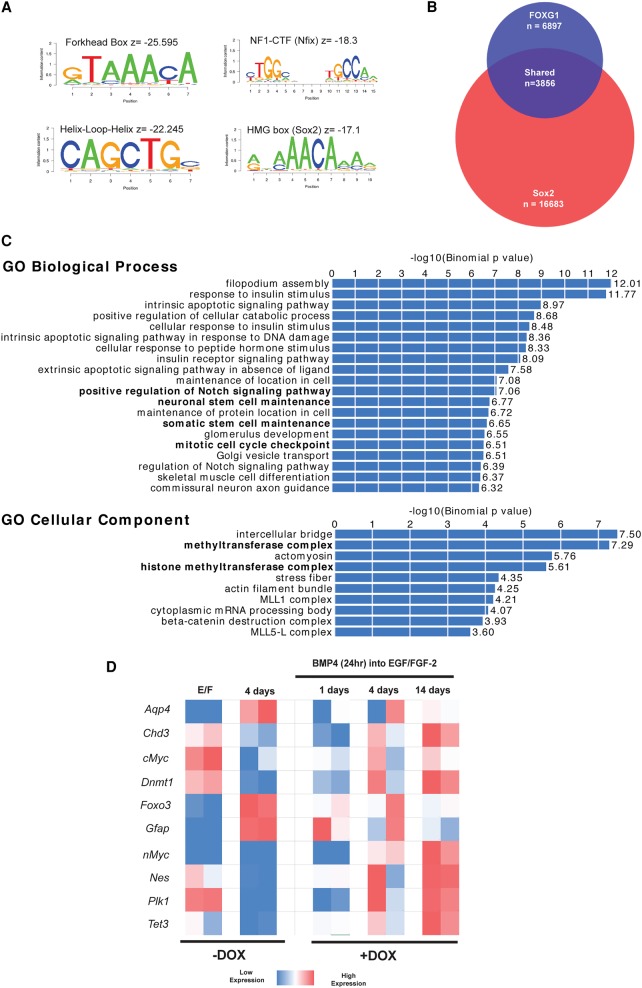
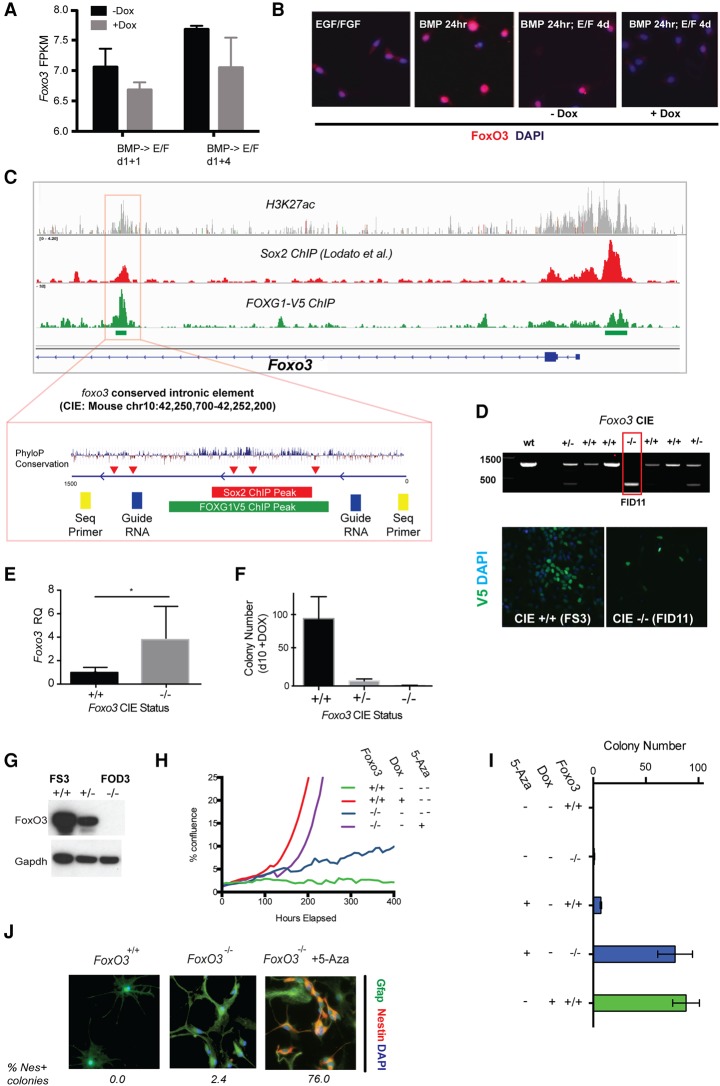
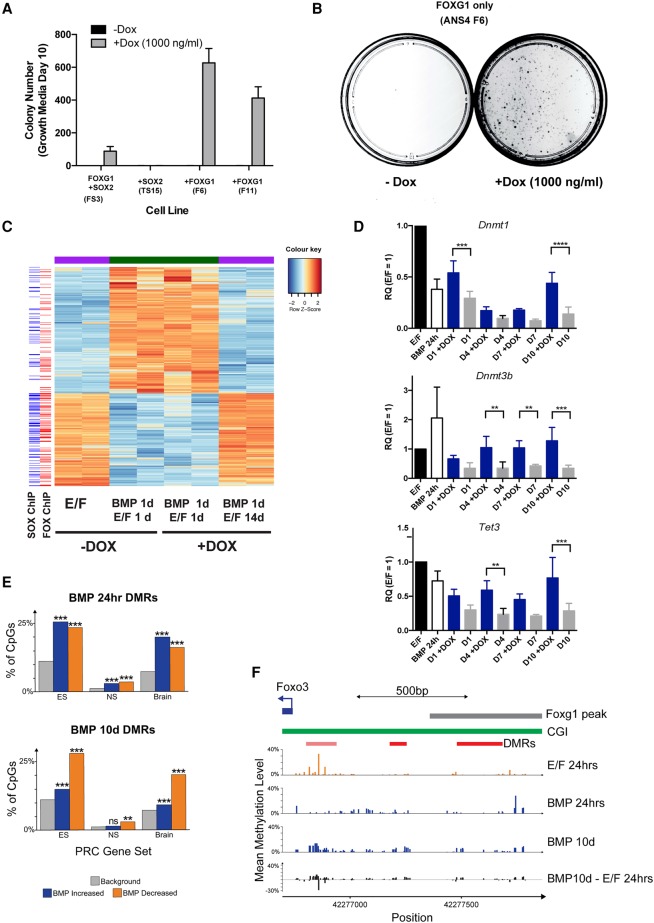
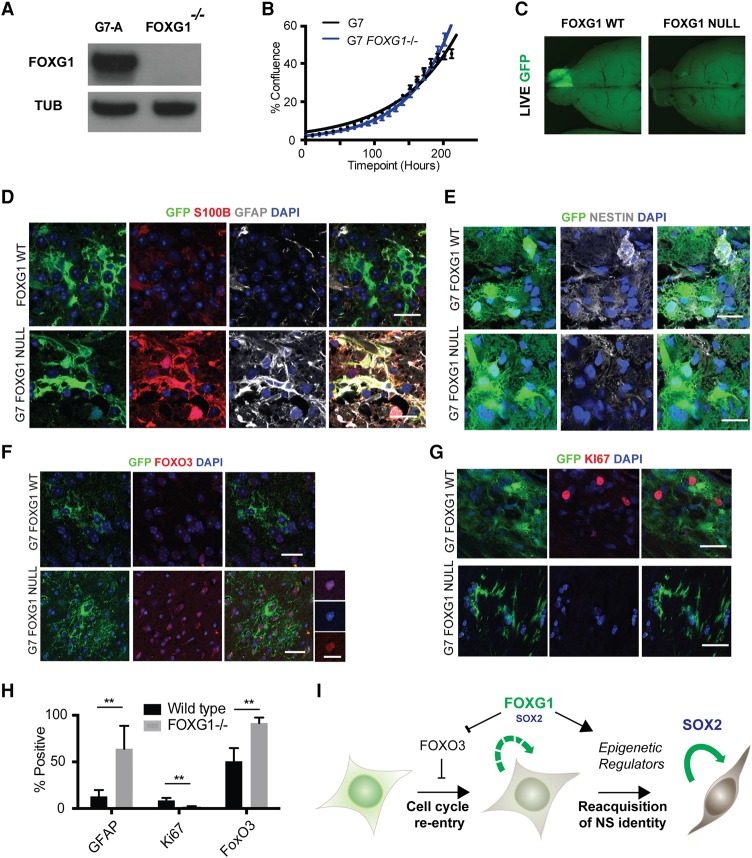
Glioblastoma multiforme (GBM) is an aggressive brain tumor driven by cells with hallmarks of neural stem (NS) cells. GBM stem cells frequently express high levels of the transcription factors FOXG1 and SOX2. Here we show that increased expression of these factors restricts astrocyte differentiation and can trigger dedifferentiation to a proliferative NS cell state. Transcriptional targets include cell cycle and epigenetic regulators (e.g., Foxo3, Plk1, Mycn, Dnmt1, Dnmt3b, and Tet3). Foxo3 is a critical repressed downstream effector that is controlled via a conserved FOXG1/SOX2-bound cis-regulatory element. Foxo3 loss, combined with exposure to the DNA methylation inhibitor 5-azacytidine, enforces astrocyte dedifferentiation. DNA methylation profiling in differentiating astrocytes identifies changes at multiple polycomb targets, including the promoter of Foxo3 In patient-derived GBM stem cells, CRISPR/Cas9 deletion of FOXG1 does not impact proliferation in vitro; however, upon transplantation in vivo, FOXG1-null cells display increased astrocyte differentiation and up-regulate FOXO3. In contrast, SOX2 ablation attenuates proliferation, and mutant cells cannot be expanded in vitro. Thus, FOXG1 and SOX2 operate in complementary but distinct roles to fuel unconstrained self-renewal in GBM stem cells via transcriptional control of core cell cycle and epigenetic regulators.

Keywords: astrocyte; cell cycle; dedifferentiation; epigenetics; glioblastoma; neural stem cell.


Figures

Figure 1.
Figure 1.
FOXG1 and SOX2 are consistently expressed at high levels across GNS cells. (A) Western blot to determine levels of FOXG1, SOX2, and OLIG2 expression across a set of GNS cells and normal NS controls. (B) ATAC-seq (assay for transposase-accessible chromatin [ATAC] using sequencing) libraries were generated in NS and GNS cells. The 100 most differentially accessible sites across biological replicates of nine GNS cell lines and four NS cells were identified and are shown in a heat map. (C) The most differentially accessible loci are enriched for key NS-specific TF motifs, most significantly the forkhead box motif.
Figure 2.
Figure 2.
FOXG1/SOX2 overexpression can inhibit BMP-induced astrocyte differentiation. (A) Mouse NS cell lines provide an experimentally tractable model to study astrocyte differentiation. BMP4 treatment for 24 h is sufficient to trigger efficient differentiation: cell cycle exit, adoption of astrocyte morphological features (flattened or star-shaped), and up-regulation of Gfap. (B) Twenty-four hours after replacing EGF/FGF-2 with BMP4, morphological changes are accompanied by down-regulation of Ki67 and up-regulation of Gfap. (C) Quantitative RT–PCR (qRT–PCR) analysis shows that, at a population level, BMP4 treatment of NS cells at low density (10 cells per square millimeter) results in significant down-regulation of Nestin and Olig2 and up-regulation of astrocyte markers Gfap, Aqp4, and S100β. Mean ± SD. n = 3. Significance was assessed by Student's t-test with Holm-Sidak correction for multiple comparisons. (*) P ≤ 0.05; (**) P ≤ 0.01; (***) P ≤ 0.001. (D) Western blot to show that Foxg1 levels in clones picked following Cre treatment of Foxg1fl/fl NS cells demonstrate an absence of protein expression. (E) Ki67 immunocytochemistry (ICC) was used to score proliferation in Foxg1 ablated cells (nanograms per milliliter). (F) A doxycycline (Dox)-inducible transgene cassette was designed to enable inducible coexpression of FOXG1 and SOX2. (TRE) TET-responsive element; (V5) V5 epitope tag; (P2A) porcine teschovirus-1 2A self-cleaving peptide sequence; (PB) piggyBac; (BSD) blasticidin resistance; (IRES) internal ribosome entry site. Western blot (below) confirmed dose-dependent increases in FOXG1 and SOX2 protein levels. (G) ICC for V5 and SOX2 confirms a Dox-induced (1000 ng/mL) increase in V5-FOXG1 and SOX2 levels. (H) Clonal lines (F6, F11, and FS3) harboring the inducible cassettes (shown in F) (Supplemental Fig. S2E,F) were generated, and transgene mRNA levels were determined by qRT–PCR following exposure to growth medium supplemented with different concentrations of Dox. (I) Growth curves for mouse NS cells cultured in medium supplemented with 8 ng/mL each mitogens EGF/FGF-2 plus 2 ng/mL BMP4 either with or without induction of FOXG1/SOX2 overexpression by Dox. Significance was assessed by Student's t-test: FS3 +Dox versus FS3 −Dox, n = 3; P < 0.001 at all time points after 178 h. (J) Phase contrast images of FS3 cells cultured in medium supplemented with 8 ng/mL each mitogens EGF/FGF-2 plus 2 ng/mL BMP4 with or without Dox supplementation after 24 h and 10 d.
Figure 3.
Figure 3.
FOXG1/SOX2 drives reacquisition of NS cell identity in post-mitotic astrocytes. (A) Schematic of the experimental strategy used to test dedifferentiation. Cells at clonal density (10 cells per square millimeter) were treated with 10 ng/mL BMP4 for 24 h and then switched to EGF/FGF-2 medium with or without transgene induction by Dox treatment. (B) EdU staining shows that no rapidly cycling cells remain after 24 h of BMP4 treatment. Twenty-four hours after plating in EGF/FGF-2 or BMP4, a 24-h pulse of EdU was administered in medium containing EGF/FGF-2. Representative images of EdU staining and quantification of the percentage of EdU-positive cells are shown for each condition. Mean ± SD. n = 2 independent experiments. Bar, 100 µm. (C) Transgene dose determines the extent of colony formation after 10 d in EGF/FGF-2. n = 3 independent experiments. Tumor-initiating IENS cells retained colony-forming ability after BMP treatment and served as a positive control, while ANS4 cells served as a negative control. Below are shown example 10-cm dishes for FS3 (no Dox), FS3 plus 1000 ng/mL Dox, and IENS treated with BMP4 for 24 h and returned to EGF/FGF-2 for 10 d. FS3 cells form colonies efficiently on transgene induction. (D) ICC for FS3 cells showing Gfap and Nestin protein levels after 24 h in EGF/FGF-2, 24 h in BMP4, return to EGF/FGF-2 for 10 d without Dox, and return to EGF/FGF-2 for 10 d with Dox. (E) Heat map of the most differentially expressed transcripts across RNA sequencing (RNA-seq) libraries at various time points during dedifferentiation; biological replicates are shown for each condition, with variability at early stages due to the low absolute numbers of cells that dedifferentiate. (F) FS3 cells retain astrocytic and neuronal differentiation potential after long-term expansion (∼30 d), as shown by ICC for Gfap and Tuj1. (G) Mouse primary astrocytes were derived from a postnatal day 3 (P3) mouse cortex, and the FOXG1/SOX2-inducible transgene was introduced by lipofection. Following the described colony-forming assay, colonies were scored 2 wk following restoration of EGF/FGF-2. (H) A working model: In the presence of mitogens, FOXG1/SOX2 acts to restrict differentiation commitment and drive proliferation.
Figure 4.
Figure 4.
ChIP-seq of FOXG1 targets in mouse NS cells. (A) FOXG1-V5 ChIP-seq identifies 6897 binding peaks conserved across two separately derived mouse NS cell lines (Foxg1 ChIP mm10.bed). Motif analysis within the ChIP-seq peak regions for FOXG1-V5 reveals enrichment for the forkhead box motif as well as HLH, NF1–CTF, and HMG-box motifs. (B) There is extensive overlap between FOXG1- and Sox2-bound regions, with 3856 of 6897 FOXG1-bound regions also exhibiting Sox2 binding. (C) Shared bound regions were assigned to gene loci using the Stanford University genomic regions of enrichment annotations tool (GREAT; FOXG1_Sox2 intersect gene associations.txt) and were found to be enriched for the GO terms shown (FOXG1_Sox2 intersect gene ontology.tsv). (D) RNA-seq demonstrates that Foxo3 is up-regulated after BMP4 treatment, along with astrocyte markers Gfap and Aqp4; in contrast, Nestin and epigenetic remodeling machinery Tet3 and Dnmt1 are down-regulated. NS cell expression patterns return by day 14 (+Dox).
Figure 5.
Figure 5.
FOXG1/SOX2 forced expression drives reduced expression of Foxo3, and genetic ablation of Foxo3 removes a barrier to cell cycle re-entry. (A) RNA-seq data for Foxo3 following return to EGF/FGF-2 for 1 or 4 d with or without Dox. (FPKM) Fragments per kilobase of transcript per million mapped reads. (B) ICC for FoxO3 protein in FS3 cells plated at clonal density after 24 h in EGF/FGF-2, 24 h in BMP4, and return to EGF/FGF-2 for 4 d with or without Dox. (C) The Foxo3 locus is bound by FOXG1 and Sox2 at both the promoter region and a CIE (indicated by red box). (Top) These regions enrich for H3K27 acetylation, a marker of active promoters and enhancers, and demonstrates high conservation across mammalian species (PhyloP). Clusters of the AAACA sequence comprising part of both Forkhead- and Sox-binding motifs are indicated by red arrowheads. Guide RNAs flanking the CIE were selected with a view to excision of this region by CRISPR/Cas9 (blue rectangles), along with sequencing primers for genotyping the resulting clones (yellow rectangles). (D) PCR genotyping to confirm biallelic deletion with the expected single band in one line (termed FID11); FID11 retains the ability to respond to Dox and hence induce FOXG1-V5 expression, as determined by ICC (below). (E) Deletion of the FOXG1/SOX2-bound CIE results in derepression of Foxo3 mRNA expression in NS cell proliferation conditions. n = 3. (*) P < 0.02). (F) Colony formation following Dox-induced FOXG1/SOX2 expression is abolished in CIE-deleted cells. Mean ± SEM. (G) Western blot confirming the absence of FoxO3 protein expression in FOD3, a clonal cell line harboring a frameshift insertion–deletion (indel) mutation on the nontargeted allele. (H) Following BMP treatment, Foxo3−/− FOD3 cells divide slowly in growth conditions (doubling time ∼6 d), in contrast to Foxo3+/+ controls, which remain cycle-arrested. FOXG1/SOX2 induction or treatment of FOD3 cells with 5-azacytidine (5-Aza) drives rapid colony formation and proliferation to confluence (doubling time ∼24 h). (I) Colony-forming assay at 10 d for dedifferentiation responses in Foxo3−/− cells and those treated with 5-Aza with and without Dox. (J) ICC for Nestin and Gfap. The proportion of cells positive for nestin in representative colonies is indicated below the panels. See also Supplemental Figure S5D.
Figure 6.
Figure 6.
FOXG1 overexpression results in increased activation of regulators of DNA methylation, and these may affect key polycomb target genes. (A) Colony numbers upon return to self-renewal medium with or without 1000 ng/mL Dox for 10 d following 24 h of BMP4 treatment. Induction of FOXG1 alone in two independent lines (F6 and F11) induced colony formation at higher efficiency than in FS3. Induction of SOX2 alone (TS15) was not sufficient to drive colony formation. (B) Example of a colony-forming assay for F6 showing colonies after 10 d in EGF/FGF-2 only on the addition of Dox. (C) RNA-seq confirms that, following FOXG1 induction by Dox, BMP4-treated F6 cells reacquire an NS cell-like transcriptional signature. (Left) Alignment with ChIP-seq data for FOXG1 and SOX2 indicates that many of the genes activated on dedifferentiation are bound by FOXG1 and SOX2. (D) qRT–PCR analysis of Dnmt1, Dnmt3b, and Tet3. Mean ± SD. n = 4. Significance was assessed by two-way ANOVA with Bonferroni post-hoc test. (**) P ≤ 0.01; (***) P ≤ 0.001; (****) P ≤ 0.0001. (E) Analysis of enrichment of reduced representation bilsulfite sequencing (RRBS) identified differentially methylated regions (DMRs) near genes marked by polycomb in mouse embryonic stem (ES) cells, NS cells, and brains. Shown is the percentage of CpGs assayed by RRBS found near polycomb-marked genes (background, gray) compared with those in significant DMRs after either 24 h or 10 d of differentiation. (Blue) BMP-increased methylation; (orange) BMP-decreased methylation. Significance was assessed with Fisher's exact tests (**) P < 0.01; (***) P < 0.001. n = 3. (F) Mean methylation profiles observed by RRBS in the Foxo3 promoter, including the locations of its CpG island (CGI) and Foxg1 ChIP-seq peak. Significant DMRs are shown in red together with an additional DMR that did not reach statistical significance in all replicates of the experiment (pale red).
Figure 7.
Figure 7.
Genetic ablation of FOXG1 in human GBM stem cells using Cas9-assisted gene targeting. (A) CRISPR/Cas-based gene targeting was used to knock out FOXG1 in G7 cells, and no protein was detectable by Western blot, with a frameshift mutation demonstrated on the second FOXG1 allele in this clone (see Supplemental Fig. S7). (B) Growth curve displaying percentage confluence over time for G7 and G7 FOXG1−/− cell lines, indicating that the FOXG1−/− clone proliferates at a rate similar to that of parental controls in vitro. (C) Upon xenotransplantation, wild-type G7 cells expressing a GFP reporter form invasive tumors, but FOXG1−/− derivatives fail to do so. n = 4 for each cell line. (D) Immunohistochemistry (IHC) analysis of xenografts reveals that the G7 FOXG1 mutant cells display increased expression of astrocyte markers S100β (red) and GFAP (gray), reduced expression of NESTIN (gray) (E), increased expression of FOXO3 (F), and decreased expression of Ki67 (red) (G). (H) Quantitation of the percentage of cells positive for GFAP, Ki67, and FOXO3 from IHC. (I) Working model of FOXG1 and SOX2 function in GBM based on this study. (Green cell) Post-mitotic or quiescent astrocytes; (brown/gray cell) radial glia-like proliferative NS cell. Bar, 10 µm; bar for higher-magnification images in F, 20 µm. Students t-test, n = 4; P < 0.005.

References

    1. Alonso MM, Diez-Valle R, Manterola L, Rubio A, Liu D, Cortes-Santiago N, Urquiza L, Jauregi P, Lopez de Munain A, Sampron N, et al. 2011. Genetic and epigenetic modifications of Sox2 contribute to the invasive phenotype of malignant gliomas. PLoS One 6: e26740. - PMC - PubMed
    1. Arnold K, Sarkar A, Yram MA, Polo JM, Bronson R, Sengupta S, Seandel M, Geijsen N, Hochedlinger K. 2011. Sox2+ adult stem and progenitor cells are important for tissue regeneration and survival of mice. Cell Stem Cell 9: 317–329. - PMC - PubMed
    1. Avilion AA, Nicolis SK, Pevny LH, Perez L, Vivian N, Lovell-Badge R. 2003. Multipotent cell lineages in early mouse development depend on SOX2 function. Genes Dev 17: 126–140. - PMC - PubMed
    1. Bachoo RM, Maher EA, Ligon KL, Sharpless NE, Chan SS, You MJ, Tang Y, DeFrances J, Stover E, Weissleder R, et al. 2002. Epidermal growth factor receptor and Ink4a/Arf: convergent mechanisms governing terminal differentiation and transformation along the neural stem cell to astrocyte axis. Cancer Cell 1: 269–277. - PubMed
    1. Brennan CW, Verhaak RGW, McKenna A, Campos B, Noushmehr H, Salama SR, Zheng S, Chakravarty D, Sanborn JZ, Berman SH, et al. 2013. The somatic genomic landscape of glioblastoma. Cell 155: 462–477. - PMC - PubMed

Publication types

MeSH terms