

Bitter Melon Enhances Natural Killer-Mediated Toxicity against Head and Neck Cancer Cells
- PMID: 28465362
- PMCID: PMC5499682
- DOI: 10.1158/1940-6207.CAPR-17-0046
Bitter Melon Enhances Natural Killer-Mediated Toxicity against Head and Neck Cancer Cells
Abstract
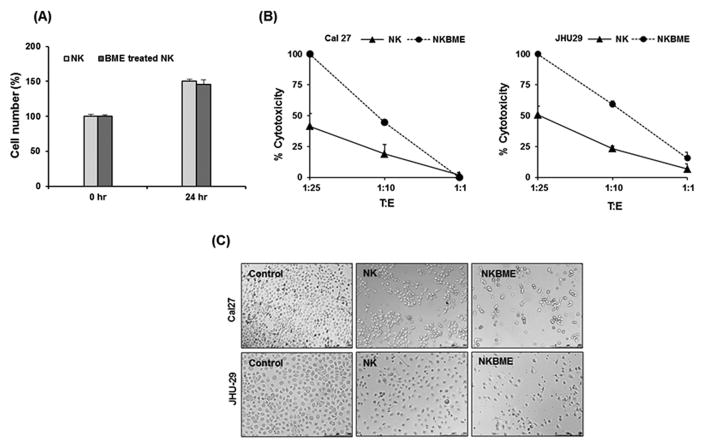
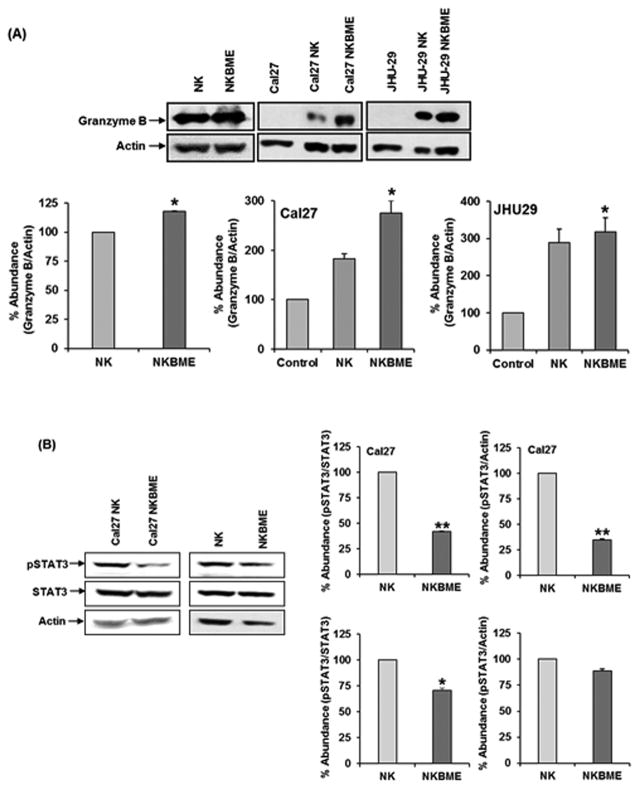
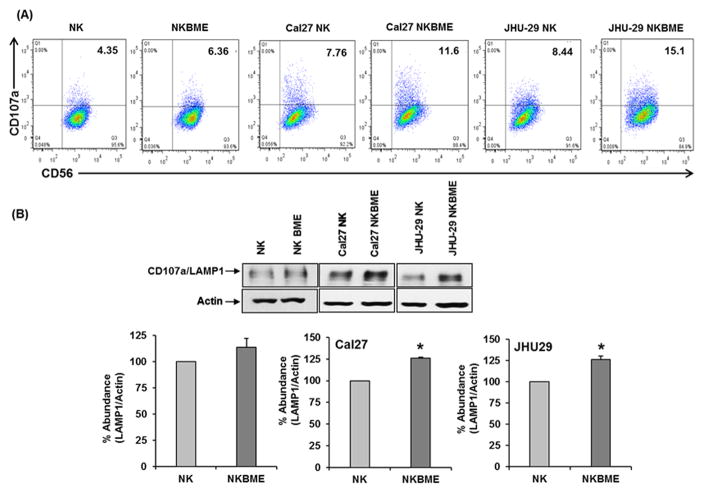
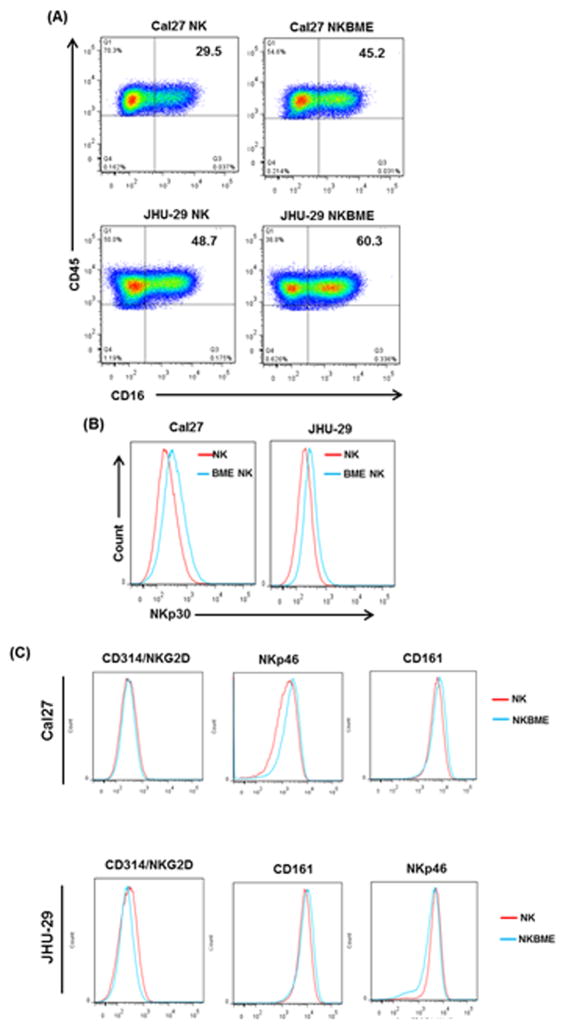
Natural killer (NK) cells are one of the major components of innate immunity, with the ability to mediate antitumor activity. Understanding the role of NK-cell-mediated tumor killing in controlling of solid tumor growth is still in the developmental stage. We have shown recently that bitter melon extract (BME) modulates the regulatory T cell (Treg) population in head and neck squamous cell carcinoma (HNSCC). However, the role of BME in NK-cell modulation against HNSCC remains unknown. In this study, we investigated whether BME can enhance the NK-cell killing activity against HNSCC cells. Our results indicated that treatment of human NK-cell line (NK3.3) with BME enhances ability to kill HNSCC cells. BME increases granzyme B accumulation and translocation/accumulation of CD107a/LAMP1 in NK3.3 cells exposed to BME. Furthermore, an increase in cell surface expression of CD16 and NKp30 in BME-treated NK3.3 cells was observed when cocultured with HNSCC cells. Collectively, our results demonstrated for the first time that BME augments NK-cell-mediated HNSCC killing activity, implicating an immunomodulatory role of BME. Cancer Prev Res; 10(6); 337-44. ©2017 AACR.
©2017 American Association for Cancer Research.
Conflict of interest statement
Figures
Similar articles
-
Immunomodulatory role of bitter melon extract in inhibition of head and neck squamous cell carcinoma growth.Oncotarget. 2016 May 31;7(22):33202-9. doi: 10.18632/oncotarget.8898. Oncotarget. 2016. PMID: 27120805 Free PMC article.
-
IFNalpha2b stimulated release of IFNgamma differentially regulates T cell and NK cell mediated tumor cell cytotoxicity.Immunol Lett. 2007 Jan 15;108(1):68-77. doi: 10.1016/j.imlet.2006.10.002. Epub 2006 Nov 2. Immunol Lett. 2007. PMID: 17112599
-
Bitter Melon Prevents the Development of 4-NQO-Induced Oral Squamous Cell Carcinoma in an Immunocompetent Mouse Model by Modulating Immune Signaling.Cancer Prev Res (Phila). 2018 Apr;11(4):191-202. doi: 10.1158/1940-6207.CAPR-17-0237. Epub 2017 Oct 23. Cancer Prev Res (Phila). 2018. PMID: 29061560 Free PMC article.
-
Landscape of natural killer cell activity in head and neck squamous cell carcinoma.J Immunother Cancer. 2020 Dec;8(2):e001523. doi: 10.1136/jitc-2020-001523. J Immunother Cancer. 2020. PMID: 33428584 Free PMC article. Review.
-
The prognostic role of NK cells and their ligands in squamous cell carcinoma of the head and neck: a systematic review and meta-analysis.Oncoimmunology. 2020 Apr 23;9(1):1747345. doi: 10.1080/2162402X.2020.1747345. eCollection 2020. Oncoimmunology. 2020. PMID: 32363116 Free PMC article.
Cited by
-
Micheliolide Inhibits Liver Cancer Cell Growth Via Inducing Apoptosis And Perturbing Actin Cytoskeleton.Cancer Manag Res. 2019 Oct 29;11:9203-9212. doi: 10.2147/CMAR.S216870. eCollection 2019. Cancer Manag Res. 2019. PMID: 31754310 Free PMC article.
-
Bitter Melon (Momordica Charantia), a Nutraceutical Approach for Cancer Prevention and Therapy.Cancers (Basel). 2020 Jul 27;12(8):2064. doi: 10.3390/cancers12082064. Cancers (Basel). 2020. PMID: 32726914 Free PMC article. Review.
-
Oxymatrine Inhibits the Proliferation and Invasion of Breast Cancer Cells via the PI3K Pathway.Cancer Manag Res. 2019 Dec 13;11:10499-10508. doi: 10.2147/CMAR.S221950. eCollection 2019. Cancer Manag Res. 2019. Retraction in: Cancer Manag Res. 2022 Aug 02;14:2289-2290. doi: 10.2147/CMAR.S384253. PMID: 31853201 Free PMC article. Retracted.
-
Toosendanin Suppresses Glioma Progression Property and Induces Apoptosis by Regulating miR-608/Notch Axis.Cancer Manag Res. 2020 May 13;12:3419-3431. doi: 10.2147/CMAR.S240268. eCollection 2020. Cancer Manag Res. 2020. PMID: 32494206 Free PMC article.
-
Impact of Ninjin'Yoeito on Fatigue in Patients Receiving Nab-Paclitaxel Plus Gemcitabine Therapy: A Prospective, Single-Arm, Phase II Open Label, Nonrandomized, Historically-Controlled Study.Curr Ther Res Clin Exp. 2020 Sep 15;93:100605. doi: 10.1016/j.curtheres.2020.100605. eCollection 2020. Curr Ther Res Clin Exp. 2020. PMID: 33014206 Free PMC article.
References
-
- Festenstein H, Schmidt W. Variation in MHC antigenic profiles of tumor cells and its biological effects. Immunol Rev. 1981;60:85–127. - PubMed
-
- Ljunggren HG, Karre K. In search of the ‘missing self’: MHC molecules and NK cell recognition. Immunol Today. 1990;11:237–244. - PubMed
-
- Ljunggren HG, Malmberg KJ. Prospects for the use of NK cells in immunotherapy of human cancer. Nat Rev Immunol. 2007;7:329–339. - PubMed
MeSH terms
Substances
Grants and funding
LinkOut - more resources
Full Text Sources
Other Literature Sources
Medical
Miscellaneous
