. 2017 May;29(5):1053-1072.
doi: 10.1105/tpc.16.00981. Epub 2017 May 2.

Ethylene-Inhibited Jasmonic Acid Biosynthesis Promotes Mesocotyl/Coleoptile Elongation of Etiolated Rice Seedlings

Affiliations

Ethylene-Inhibited Jasmonic Acid Biosynthesis Promotes Mesocotyl/Coleoptile Elongation of Etiolated Rice Seedlings

Qing Xiong et al. Plant Cell. 2017 May.

Abstract

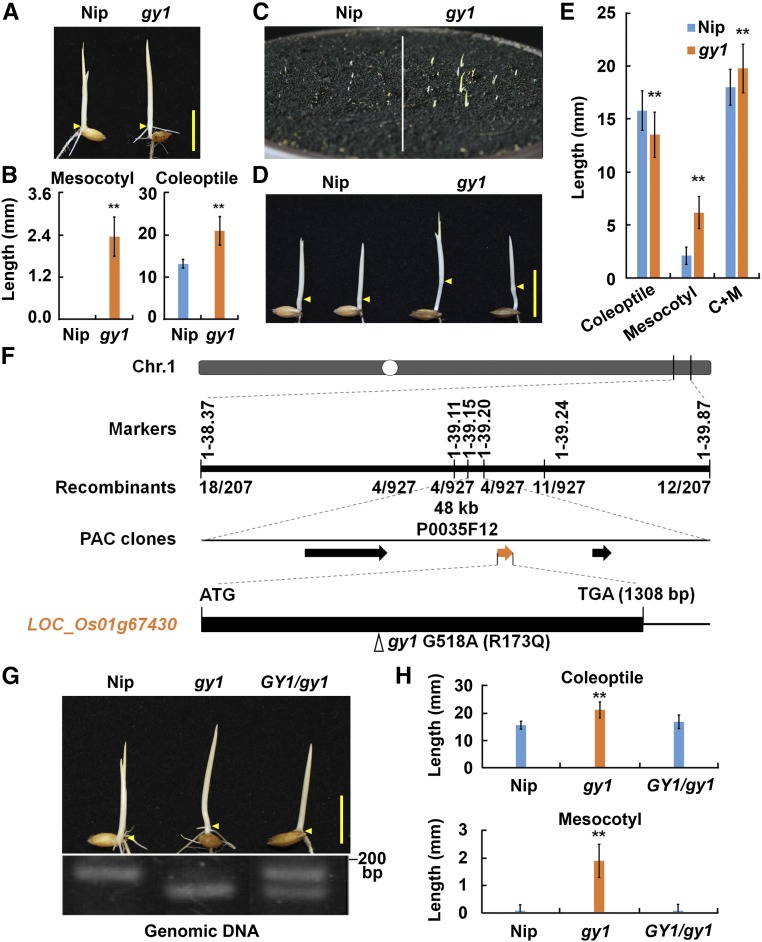
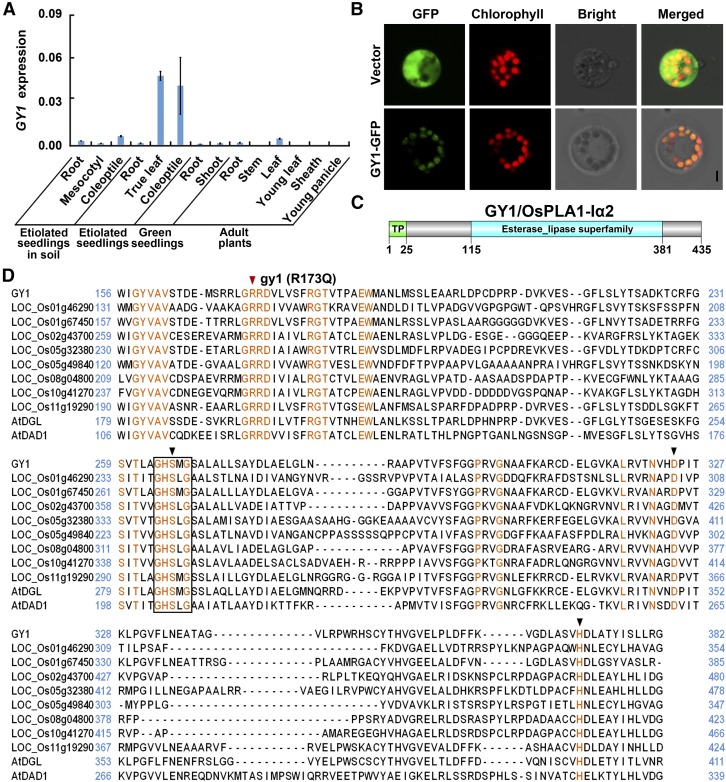
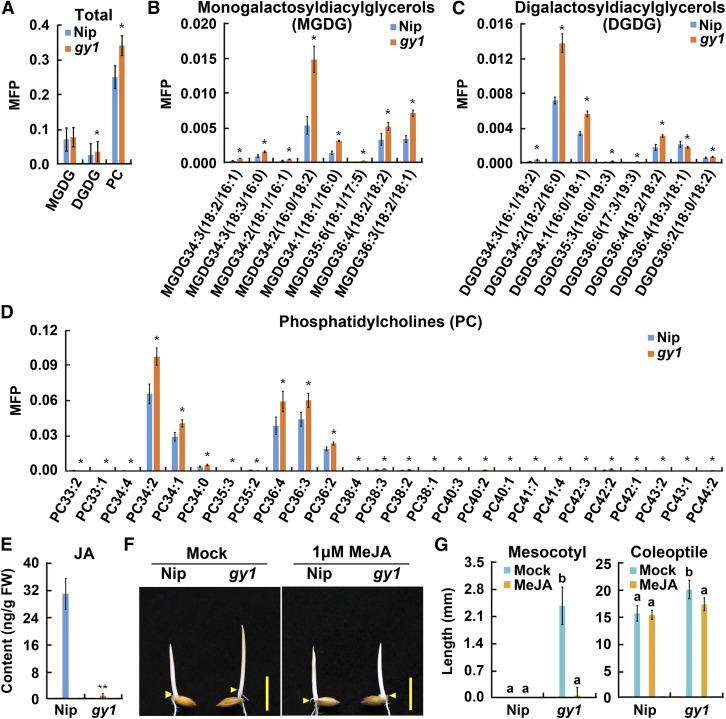
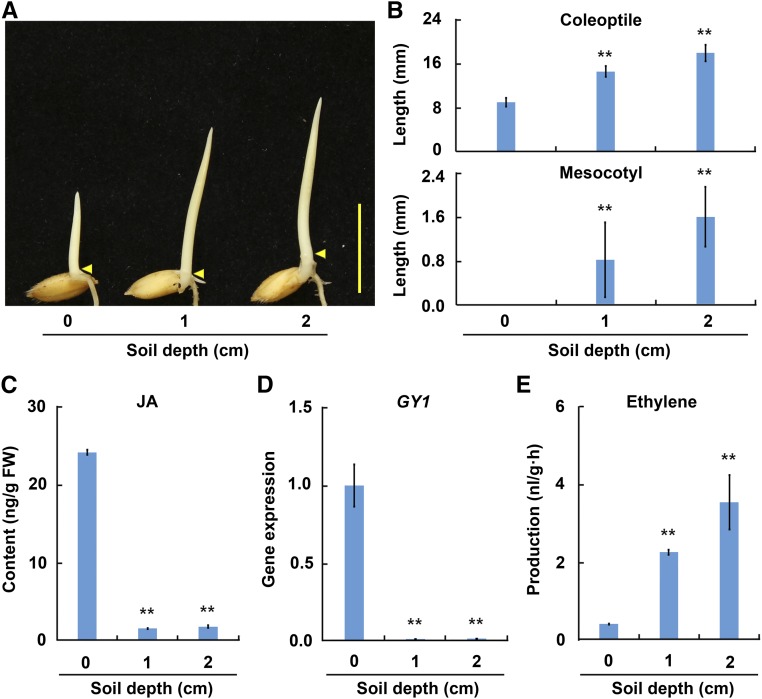
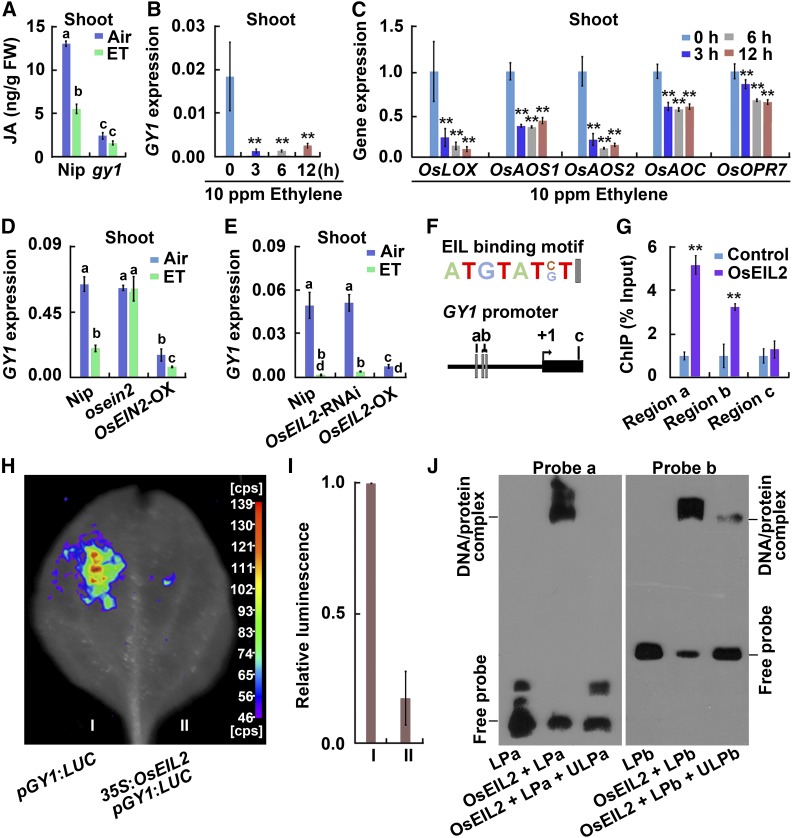
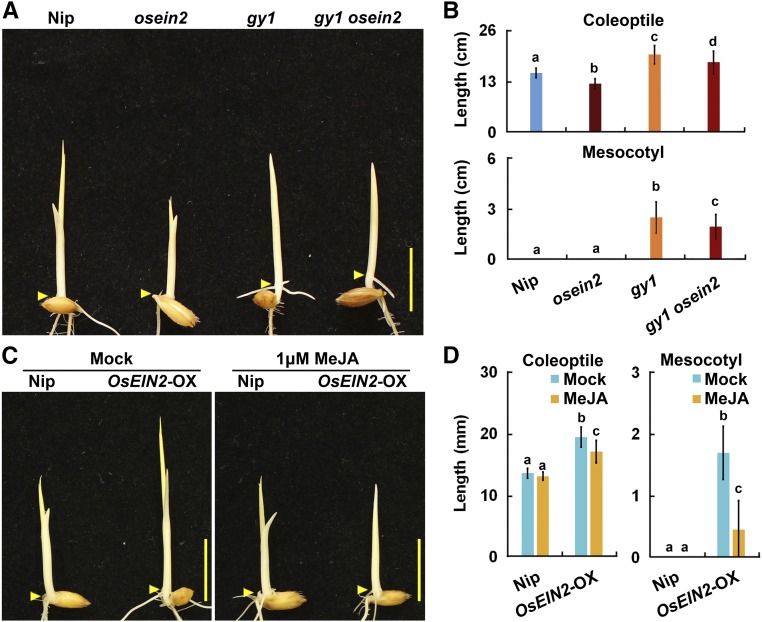
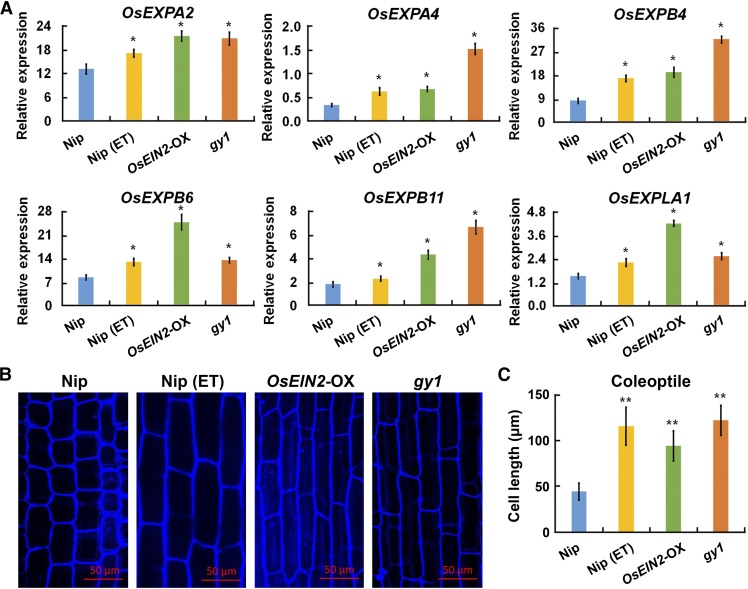
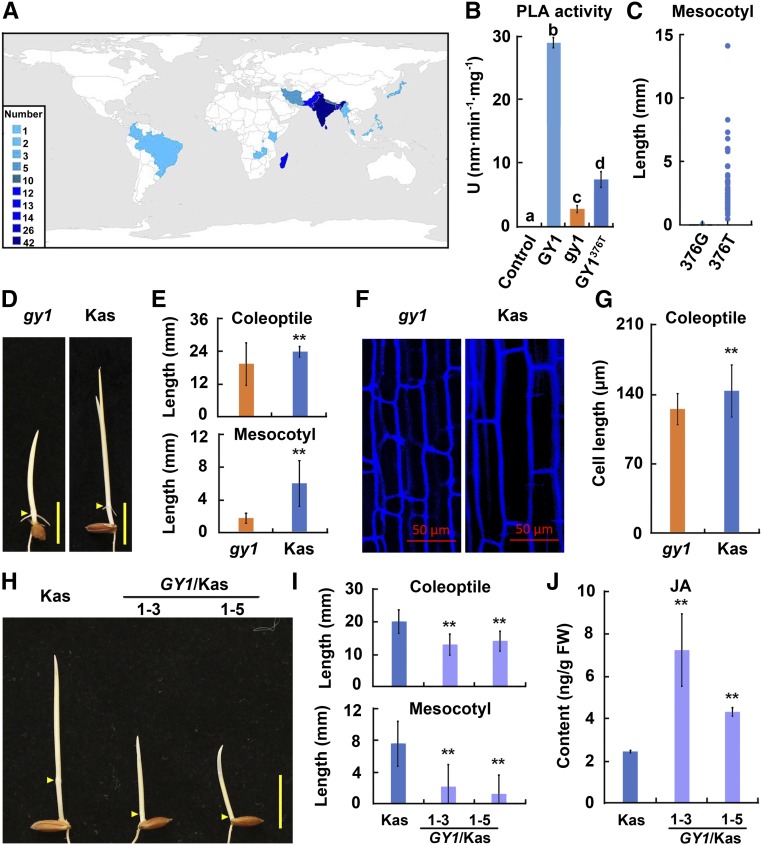
Elongation of the mesocotyl and coleoptile facilitates the emergence of rice (Oryza sativa) seedlings from soil and is affected by various genetic and environment factors. The regulatory mechanism underlying this process remains largely unclear. Here, we examined the regulation of mesocotyl and coleoptile growth by characterizing a gaoyao1 (gy1) mutant that exhibits a longer mesocotyl and longer coleoptile than its original variety of rice. GY1 was identified through map-based cloning and encodes a PLA1-type phospholipase that localizes in chloroplasts. GY1 functions at the initial step of jasmonic acid (JA) biosynthesis to repress mesocotyl and coleoptile elongation in etiolated rice seedlings. Ethylene inhibits the expression of GY1 and other genes in the JA biosynthesis pathway to reduce JA levels and enhance mesocotyl and coleoptile growth by promoting cell elongation. Genetically, GY1 acts downstream of the OsEIN2-mediated ethylene signaling pathway to regulate mesocotyl/coleoptile growth. Through analysis of the resequencing data from 3000 rice accessions, we identified a single natural variation of the GY1 gene, GY1376T , which contributes to mesocotyl elongation in rice varieties. Our study reveals novel insights into the regulatory mechanism of mesocotyl/coleoptile elongation and should have practical applications in rice breeding programs.


Figures

Figure 1.
Figure 1.
Phenotype of the gy1 Mutant and Map-Based Cloning of GY1. (A) Comparison of Nip and gy1 etiolated seedlings grown in water for 3 d after germination in darkness. Arrowheads indicate positions of coleoptilar nodes between the mesocotyl and coleoptile. Bars = 10 mm. (B) Mesocotyl and coleoptile length of etiolated seedlings represented in (A). The values are means ± sd of 20 to 30 seedlings per sample. The asterisks indicate significant difference compared with Nip (**P < 0.01, Student’s t test). (C) Emergence of Nip and gy1 from soil. Germinated seeds were sown at a depth of 2 cm and seedlings were grown for 3 d under a 14-h-light/10-h-dark photoperiod. (D) Etiolated Nip and gy1 seedlings grown in soil as in (C). Arrowheads indicate positions of coleoptilar nodes between the mesocotyl and coleoptile. Bar = 10 mm. (E) Coleoptile and mesocotyl length of etiolated seedlings represented in (D). The values are means ± sd of 20 to 30 seedlings per sample. The asterisks indicate significant difference compared with Nip (**P < 0.01, Student’s t test). (F) Map-based cloning of GY1. The GY1 locus was mapped to a 48-kb region between marker 1-39.15 and marker 1-39.20 of chromosome 1. The numbers below the markers indicate the number of recombinant individuals among the examined individuals with the mutant phenotype from the F2 segregated population. The mutation site of gy1 (G518A for nucleotide change and R173Q for amino acid change) is indicated by an arrowhead in the schematic diagram of GY1. The black box represents the coding region of GY1. (G) The GY1 genomic sequence complemented the gy1 mutant phenotype. Etiolated seedlings from Nip, gy1, and the GY1-complemented line of gy1 grown for 3 d after germination are shown. Arrowheads indicate positions of nodes. The lower panel is the confirmation of the transgenic line by cleaving PCR products with Aor51H I. The PCR products were amplified with the dCAPS primers listed in Supplemental Table 7. Bar = 10 mm. (H) Coleoptile and mesocotyl length of etiolated seedlings represented in (G). The values are means ± sd of 20 to 30 seedlings per sample. The asterisks indicate significant difference compared with Nip (**P < 0.01, Student’s t test).
Figure 2.
Figure 2.
GY1 Expression, Protein Subcellular Localization, and Alignment Analysis of GY1 with Its Homologs. (A) GY1 expression level in different organs of Nip detected by qPCR relative to OsActin2 expression. “Etiolated seedlings in soil” indicate that the germinated seeds were sown in soil at a depth of 4 cm. “Etiolated seedlings” and “Green seedlings” represent seedlings cultured under regular water conditions in darkness and in 14 h light/10 h dark, respectively. “Adult plants” represent plants grown in the field. The values are means ± sd of three biological replicates (independent pools of tissue) per sample. (B) GY1 is localized in chloroplasts of rice protoplasts as revealed by the merged green fluorescence of GY1-GFP fusion protein and the red autofluorescence of chlorophyll. Bar = 5 μm. (C) A schematic diagram of GY1 protein. A transit peptide (TP) and an esterase/lipase domain are indicated. (D) Alignment of GY1 and its homologs. Multiple alignments of amino acid sequences of GY1 and its homologs in rice and Arabidopsis were conducted using MEGA6. Identical residues are shaded in orange. The black box indicates the highly conserved GXSXG motif of PLA1. The black arrowheads indicate a triad of amino acids in the catalytic center of PLA1. The red arrowhead indicates the mutation site (R173Q) in gy1.
Figure 3.
Figure 3.
Lipid Contents and JA Contents in Rice Seedlings and MeJA Rescue of gy1 Phenotype. (A) Total monogalactosyldiacylglycerols (MGDG), digalactosyldiacylglycerols (DGDG), and PC levels expressed in molar fractions normalized to total polar lipids (MFP) in etiolated seedlings from Nip and gy1 grown for 3 d after germination in dark. The values are means ± sd of four biological replicates (independent pools of tissue) per sample. The asterisks indicate significant difference compared with the corresponding values in Nip (*P < 0.05, Student’s t test). (B) Levels of monogalactosyldiacylglycerol species in etiolated seedlings of Nip and gy1. Other indications are as in (A). (C) Levels of digalactosyldiacylglycerol species in etiolated seedlings of Nip and gy1. Other indications are as in (A). (D) Levels of PC species in etiolated seedlings from Nip and gy1. Other indications are as in (A). (E) JA content in etiolated seedlings from Nip and gy1 grown for 3 d after germination in dark. The values are means ± sd of three biological replicates (independent pools of tissue) per sample. The asterisks indicate significant difference compared with Nip (**P < 0.01, Student’s t test). (F) MeJA (1 μM) treatment rescued gy1 phenotype. The etiolated seedlings were grown for 3 d after germination in dark. Arrowheads indicate positions of the coleoptilar nodes between mesocotyl and coleoptile. Bar = 10 mm. (G) Mesocotyl and coleoptile length of etiolated seedlings represented in (F). The values are means ± sd of 20 to 30 seedlings per sample. Different letters above each column indicate significant difference between the compared pairs (P < 0.05, Student’s t test).
Figure 4.
Figure 4.
Phenotypic and Hormone Changes in Rice Seedlings after Seed-Sowing at Different Soil Depths. (A) Comparison of Nip etiolated seedlings sown at different depths in soil. The germinated seeds were covered with 0, 1, and 2 cm soil and the seedlings were grown for 3 d in darkness. Arrowheads indicate positions of coleoptilar nodes between the mesocotyl and coleoptile. Bar = 10 mm. (B) Coleoptile and mesocotyl length of Nip etiolated seedlings represented in (A). The values are means ± sd of 20 to 30 seedlings per sample. The asterisks indicate significant difference compared with the “0 cm” value (**P < 0.01, Student’s t test). (C) JA contents in shoots of Nip seedlings sown at different depths. The values are means ± sd of three biological replicates (independent pools of tissue) per sample. The asterisks indicate significant difference compared with the “0 cm” value (**P < 0.01, Student’s t test). (D) GY1 relative expression in shoots of Nip seedlings sown at different depths. The expression was detected by qPCR relative to OsActin2. The values are means ± sd of three biological replicates (independent pools of tissue) per sample. The asterisks indicate significant difference compared with the “0 cm” value (**P < 0.01, Student’s t test). (E) Ethylene production in Nip seedlings sown at different depths. The values are means ± sd of three biological replicates (independent pools of tissue) per sample. The asterisks indicate significant difference compared with the “0 cm” value (**P < 0.01, Student’s t test).
Figure 5.
Figure 5.
Ethylene Inhibits GY1 Expression through OsEIL2. (A) JA content in etiolated seedlings from Nip and gy1 grown for 3 d after germination in darkness. ET indicates 10 ppm ethylene treatment for 8 h. The values are means ± sd of three biological replicates (independent pools of tissue) per sample. Different letters above each column indicate significant difference between the compared pairs (P < 0.05, Student’s t test). (B) GY1 expression in shoots of Nip etiolated seedlings after 10 ppm ethylene treatment for 8 h. The quantitation was performed by qPCR relative to OsActin2 expression. The values are means ± sd of three biological replicates (independent pools of tissue) per sample. The asterisks indicate significant difference compared with the “0 h” value (**P < 0.01, Student’s t test). (C) Expression of OsLOX, OsAOS1, OsAOS2, OsAOC, and OsOPR7 from the JA biosynthesis pathway in shoots of etiolated Nip seedlings. The seedlings were treated with 10 ppm ethylene for 8 h, and the quantitation was performed by qPCR relative to OsActin2 expression. The expression level of each gene at the “0 h” treatment was set to 1 and other values were compared with it. The values are means ± sd of three biological replicates (independent pools of tissue) per sample. The asterisks indicate significant difference compared with the “0 h” value (**P < 0.01, Student’s t test). (D) GY1 expression level in the shoots of Nip, mhz7/osein2, and MHZ7/OsEIN2-OX etiolated seedlings after treatment with 10 ppm ethylene (ET) for 8 h. The quantitation was performed by qPCR relative to OsActin2 expression. The values are means ± sd of three biological replicates (independent pools of tissue) per sample. Different letters above each column indicate significant difference between the compared pairs (P < 0.05, Student’s t test). (E) GY1 expression in etiolated seedlings from Nip, OsEIL2-RNAi, and OsEIL2-OX after 10 ppm ethylene treatment for 8 h. Other indications are as in (D). (F) The EIL binding motif in the GY1 promoter region. a, b, and c indicate regions examined by ChIP-PCR in (G). a and b also indicate probe a and probe b used in (J), respectively. (G) Enrichment fold of the ChIP-PCR signals from the regions shown in (F). The ChIP analysis was performed with the wild-type Nip (Control) and 35S:OsEIL2:GFP (OsEIL2) transgenic plants. Error bars indicate ± sd from three biological repeats (independent pools of tissue). Asterisks indicate that the difference between OsEIL2 value and control value is significant (P < 0.01, Student’s t test). (H) OsEIL2 represses the promoter activity of GY1 in a transient expression assay in tobacco leaves. 35S:OsEIL2 was used as an effector plasmid and pGY1:LUC as a reporter plasmid harboring the GY1 promoter-driven LUC. More than five biological replicates (independent pools of tissue) were performed with similar results. (I) Quantitative analysis of luminescence intensity in samples from (G). The values are means ± sd of four biological replicates (independent pools of tissue). The asterisks indicate significant difference compared with the control (**P < 0.01, Student’s t test). (J) OsEIL2 protein binds to the promoter region of GY1 containing the EIL binding site. GST-tagged OsEIL2 N terminus fusion protein (OsEIL2) was incubated with biotin-labeled DNA fragments (probe a and probe b), respectively. An excess of unlabeled probe (competitor) was also added to compete with the biotin-labeled promoter region for OsEIL2 binding. LPa indicates labeled probe a. ULPa indicates unlabeled probe a. LPb indicates labeled probe b. ULPb indicates unlabeled probe b. The upper bands are labeled probes bound with OsEIL2 protein.
Figure 6.
Figure 6.
Genetic Interaction of GY1 with OsEIN2. (A) Etiolated Nip, gy1, osein2, and the gy1 osein2 double mutant seedlings grown for 3 d after germination in darkness. Arrowheads indicate the coleoptilar nodes between the mesocotyl and coleoptile. Bar = 10 mm. (B) Coleoptile and mesocotyl length of etiolated Nip, gy1, osein2, and gy1 osein2 double mutant seedlings grown for 3 d after germination in darkness. The values are means ± sd of 20 to 30 seedlings per sample. Different letters above each column indicate significant difference between the compared pairs (P < 0.05, Student’s t test). (C) Etiolated seedlings from Nip and MHZ7/OsEIN2-OX without (mock) or with 1 μM MeJA treatment grown for 3 d after germination in darkness. Arrowheads indicate the coleoptilar nodes between the mesocotyl and coleoptile. Bar = 10 mm. (D) Coleoptile and mesocotyl length of etiolated seedlings from Nip and MHZ7/OsEIN2-OX without (mock) or with 1 μM MeJA treatment grown for 3 d after germination in darkness. The values are means ± sd of 20 to 30 seedlings per sample. Different letters above each column indicate significant difference between the compared pairs (P < 0.05, Student’s t test).
Figure 7.
Figure 7.
Expression of Expansin Family Genes and Cell Length of Coleoptiles in Different Seedlings. (A) The expression level of OsEXPA2, OsEXPA4, OsEXPB4, OsEXPB6, OsEXPB11, and OsEXPLA1 (expansin-like A1) in the shoots of etiolated Nip, Nip with 10 ppm ethylene (ET) treatment, MHZ7/OsEIN2-OX, and gy1 seedlings, detected by qPCR relative to OsActin2 expression. The values are means ± sd of three biological replicates (independent pools of tissue) per sample. The asterisks indicate significant difference compared with Nip (P < 0.05, Student’s t test). (B) Coleoptile cells of etiolated Nip, Nip with 10 ppm ethylene treatment, MHZ7/OsEIN2-OX, and gy1 seedlings. Bar = 50 μm. (C) Cell lengths of the coleoptiles of etiolated Nip, Nip with 10 ppm ethylene treatment, MHZ7/OsEIN2-OX, and gy1 seedlings. The values are means ± sd of 20 to 30 cells per sample. The asterisks indicate significant difference compared with Nip (**P < 0.01, Student’s t test).
Figure 8.
Figure 8.
Natural Variation of GY1 Correlates with Mesocotyl Elongation in Rice Accessions and GY1 Suppresses the Long Mesocotyl and Coleoptile Phenotypes in Kasalath Etiolated Seedlings. (A) Distribution of the rice accessions harboring the 376T SNP in GY1. Countries are labeled with different shades of blue according to the number of varieties distributed in each country. The countries include Asian countries (India, Bangladesh, Sri Lanka, Pakistan, Nepal, Iran, Japan, Malaysia, Myanmar, and Philippines), African countries (Madagascar, Burundi, Kenya, Liberia, and Zambia), South American countries (Brazil and Colombia), and an Oceania country (Fiji). (B) PLA activity of GY1, gy1 (GY1518A), and GY1376T. PLA activity was measured in vitro with dye-labeled PC as a substrate at 30°C. GY1, gy1 (GY1518A), and GY1376T were expressed as fusion proteins with the SUMO peptide. SUMO peptide was used as a control. Values are means ± sd for four independent replicates. Different letters above each column indicate significant difference between the compared pairs (P < 0.05, LSD and S-N-K test). (C) The 376T SNP of GY1 correlates with long mesocotyls in rice accessions. The 376G SNP of GY1 is related to short/no mesocotyl. (D) Etiolated seedlings of gy1 and Kasalath (Kas) grown for 3 d after germination in darkness. Arrowheads indicate the coleoptilar nodes between mesocotyl and coleoptile. Bar = 10 mm. (E) Coleoptile and mesocotyl length of etiolated seedlings from (C). The values are means ± sd of 20 to 30 seedlings per sample. The asterisks indicate significant difference compared with gy1 (**P < 0.01, Student’s t test). (F) Coleoptile cells of etiolated seedlings from gy1 and Kas. Bar = 50 μm. (G) Cell length of coleoptile as shown in (E). The values are means ± sd of 20 to 30 cells per sample. The asterisks indicate significant difference compared with gy1 (**P < 0.01, Student’s t test). (H) GY1376G expression inhibits the long mesocotyl and coleoptile phenotype in Kas with GY1376T. Phenotype of etiolated seedlings from Kas and two transgenic lines transformed with GY1376G grown for 3 d after germination in darkness. Arrowheads indicate the coleoptilar nodes between the mesocotyl and coleoptile. The dCAPS marker was used to genotype GY1 and GY1376T by cleaving PCR products with FspI. dCAPS primers are listed in Supplemental Table 7. Bar = 10 mm. (I) Coleoptile and mesocotyl length of etiolated seedlings from (G). The values are means ± sd of 20 to 30 seedlings per sample. The asterisks indicate significant difference compared with Kas (**P < 0.01, Student’s t test). (J) JA contents in the shoots of etiolated seedlings from Kas (with GY1376T) and two transgenic lines transformed with GY1376G grown for 3 d after germination in darkness. The values are means ± sd of three biological replicates (independent pools of tissue) per sample. The asterisks indicate significant difference compared with Kas (**P < 0.01, Student’s t test).

Similar articles

Cited by

References

    1. Alonso J.M., Hirayama T., Roman G., Nourizadeh S., Ecker J.R. (1999). EIN2, a bifunctional transducer of ethylene and stress responses in Arabidopsis. Science 284: 2148–2152. - PubMed
    1. Bannenberg G., Martínez M., Hamberg M., Castresana C. (2009). Diversity of the enzymatic activity in the lipoxygenase gene family of Arabidopsis thaliana. Lipids 44: 85–95. - PubMed
    1. Bart R., Chern M., Park C.J., Bartley L., Ronald P.C. (2006). A novel system for gene silencing using siRNAs in rice leaf and stem-derived protoplasts. Plant Methods 2: 13. - PMC - PubMed
    1. Biswas K.K., Neumann R., Haga K., Yatoh O., Iino M. (2003). Photomorphogenesis of rice seedlings: a mutant impaired in phytochrome-mediated inhibition of coleoptile growth. Plant Cell Physiol. 44: 242–254. - PubMed
    1. Bleecker A.B., Kende H. (2000). Ethylene: a gaseous signal molecule in plants. Annu. Rev. Cell Dev. Biol. 16: 1–18. - PubMed

LinkOut - more resources