. 2017 May 2;8(3):e00375-17.
doi: 10.1128/mBio.00375-17.

Plasma Membrane Association by N-Acylation Governs PKG Function in Toxoplasma gondii

Affiliations

Plasma Membrane Association by N-Acylation Governs PKG Function in Toxoplasma gondii

Kevin M Brown et al. mBio. .

Abstract

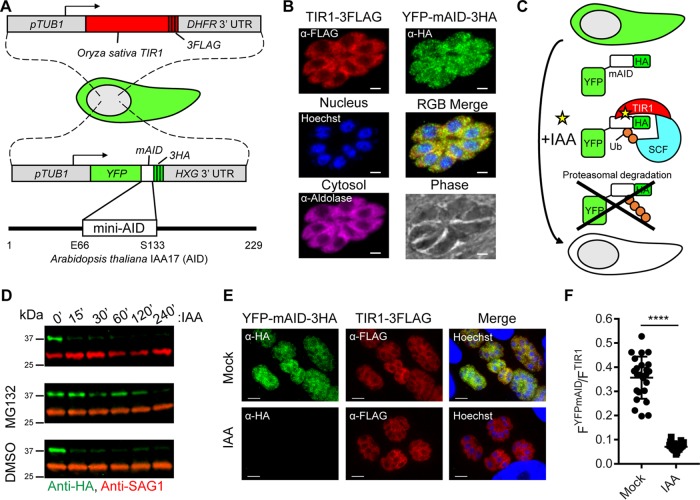
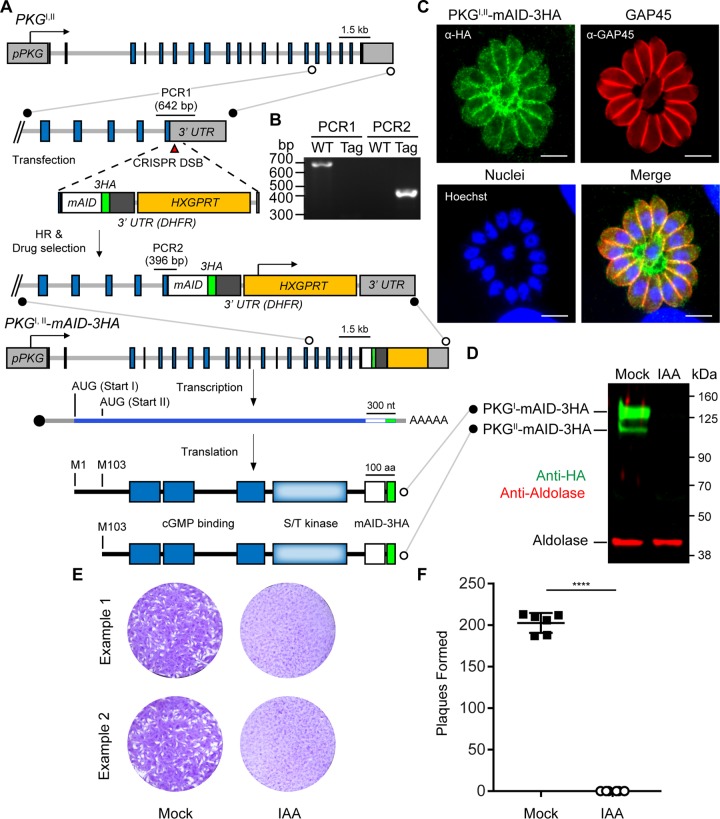
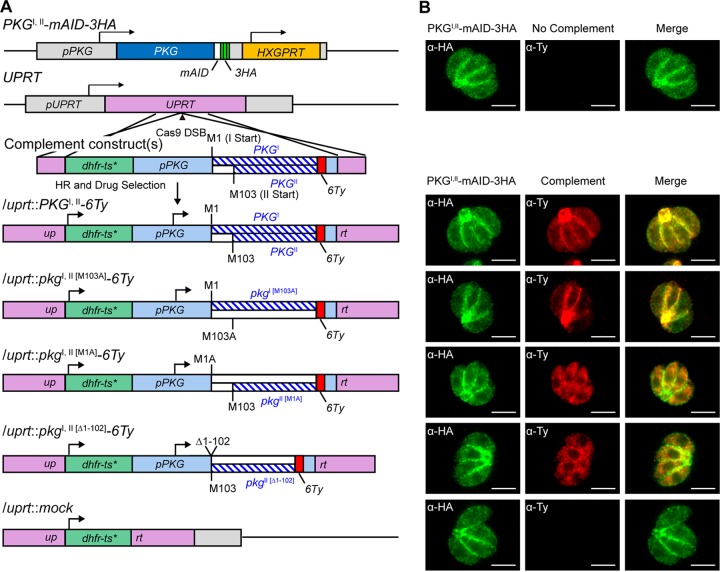
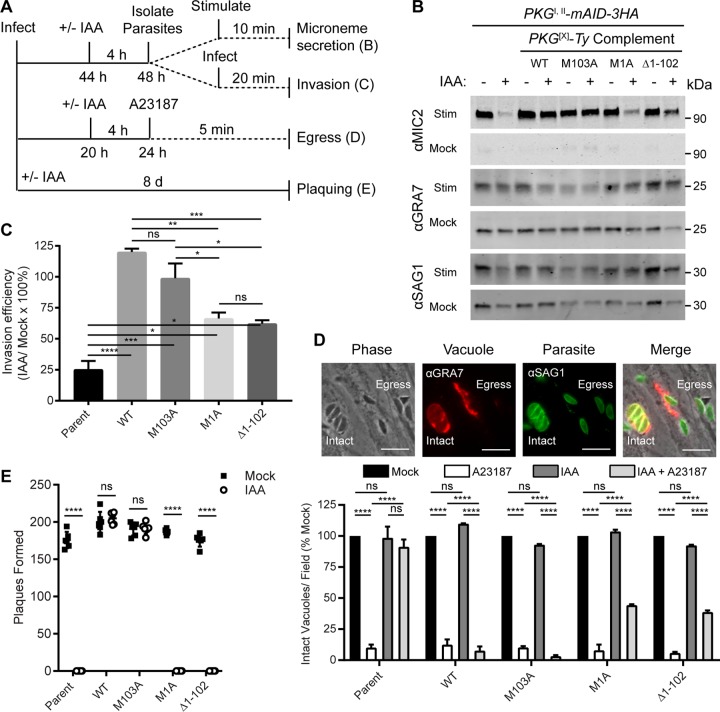
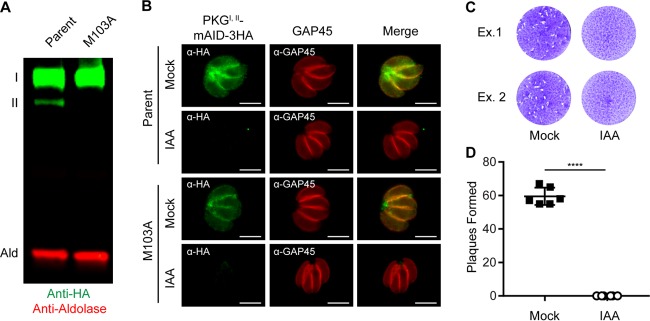
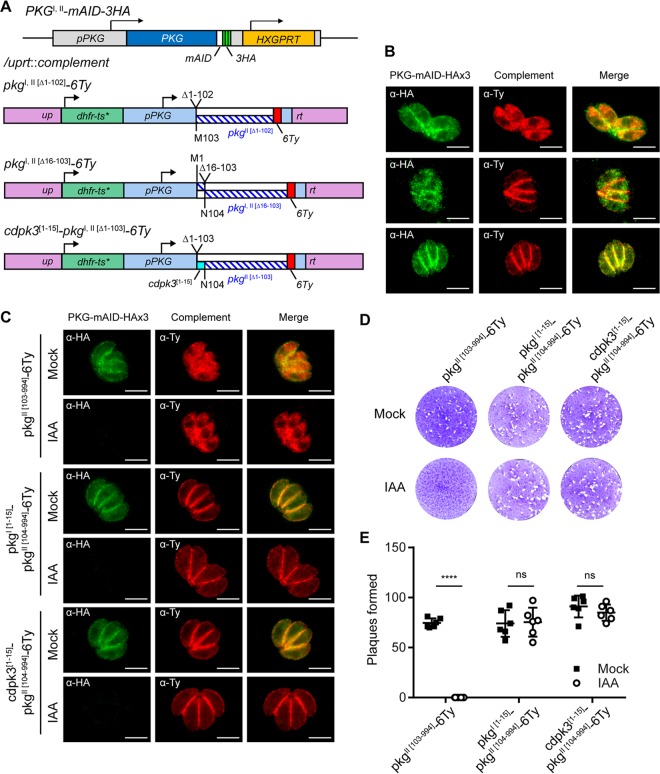
Cyclic GMP (cGMP)-dependent protein kinase (protein kinase G [PKG]) is essential for microneme secretion, motility, invasion, and egress in apicomplexan parasites, However, the separate roles of two isoforms of the kinase that are expressed by some apicomplexans remain uncertain. Despite having identical regulatory and catalytic domains, PKGI is plasma membrane associated whereas PKGII is cytosolic in Toxoplasma gondii To determine whether these isoforms are functionally distinct or redundant, we developed an auxin-inducible degron (AID) tagging system for conditional protein depletion in T. gondii By combining AID regulation with genome editing strategies, we determined that PKGI is necessary and fully sufficient for PKG-dependent cellular processes. Conversely, PKGII is functionally insufficient and dispensable in the presence of PKGI The difference in functionality mapped to the first 15 residues of PKGI, containing a myristoylated Gly residue at position 2 that is critical for membrane association and PKG function. Collectively, we have identified a novel requirement for cGMP signaling at the plasma membrane and developed a new system for examining essential proteins in T. gondiiIMPORTANCEToxoplasma gondii is an obligate intracellular apicomplexan parasite and important clinical and veterinary pathogen that causes toxoplasmosis. Since apicomplexans can only propagate within host cells, efficient invasion is critically important for their life cycles. Previous studies using chemical genetics demonstrated that cyclic GMP signaling through protein kinase G (PKG)-controlled invasion by apicomplexan parasites. However, these studies did not resolve functional differences between two compartmentalized isoforms of the kinase. Here we developed a conditional protein regulation tool to interrogate PKG isoforms in T. gondii We found that the cytosolic PKG isoform was largely insufficient and dispensable. In contrast, the plasma membrane-associated isoform was necessary and fully sufficient for PKG function. Our studies identify the plasma membrane as a key location for PKG activity and provide a broadly applicable system for examining essential proteins in T. gondii.


Figures

FIG 1
FIG 1
Generation of an AID system in T. gondii. (A) Schematic representation of T. gondii engineered to coexpress the auxin receptor TIR1 from Oryza sativa and YFP fused to mAID from Arabidopsis thaliana. (B) Coexpression of TIR1-3FLAG (red) and YFP-mAID-3HA (green) in T. gondii determined by IF microscopy. Aldolase (magenta) and Hoechst dye (blue) highlight the cytosol and nuclei, respectively. Scale bars, 2 µm. (C) Schematic representation of conditional YFP-mAID-3HA depletion. Ub, ubiquitin; SCF, Skp-1, Cullin, F-box (TIR1)-containing complex. (D) Western blot assay of lysed YFP-mAID-3HA parasites, probed with antibodies recognizing HA and SAG1. Parasites were treated with 500 µM IAA or the vehicle (EtOH) for up to 240 min in the presence of 50 µM MG132 or the vehicle (DMSO). Data are from a single experiment of two or more experiments with the same outcome. (E) Coexpression of YFP-mAID-3HA (green) and TIR1-3FLAG (red) following treatment with 500 µM IAA or the vehicle (EtOH) for 4 h determined by IF microscopy with the antibodies indicated. Scale bars, 5 µm. (F) Ratiometric quantification of YFP-mAID-3HA to TIR1-3FLAG IF microscopy per vacuole. Mean values of individual vacuoles (EtOH, n = 24; IAA, n = 23) from two experiments ± the standard deviation, ****, P < 0.0001 (unpaired two-tailed Student t test).
FIG 2
FIG 2
Fusion of mAID to PKGI,II in TIR1 parasites allows the simultaneous depletion of PKGI and PKGII isoforms. (A) Strategy for tagging of PKGI,II with mAID in TIR1-3FLAG parasites and depiction of the two protein isoforms produced from the PKGI,II-mAID-3HA transcript. (B) DNA electrophoretogram of diagnostic PCRs from genomic DNA showing 3′ integration of mAID-3HA into PKGI,II. The genomic loci acting as templates for PCR1 and PCR2 amplicons are shown in panel A. Lanes: WT (wild type), TIR1-3FLAG parent; Tag, PKGI,II-mAID-3HA parasites. (C) Coexpression of PKGI-mAID-3HA and PKGII-mAID-3HA (both green) in PKGI,II-mAID-3HA parasites determined by IF microscopy. GAP45 (red) is a marker for the parasite plasma membrane. Scale bars = 5 µm. (D) Western blot assay of lysed PKGI,II-mAID-3HA parasites probed with antibodies recognizing HA and aldolase. Parasites were treated with 500 µM IAA or the vehicle (EtOH) for 4 h prior to lysis. (E, F) Plaque formation by PKGI,II-mAID-3HA parasites treated with 500 µM IAA or the vehicle (EtOH) for 8 days (E) and mean number of plaques formed per well (mock, n = 6; IAA, n = 6) ± the standard deviation (F). ****, P < 0.0001 (unpaired two-tailed Student t test). Panels D to F each show data from a single example from three experiments with the same outcome.
FIG 3
FIG 3
Genetic complementation of strain PKGI,II-mAID-3HA. (A) Schematic of the CRISPR/Cas9 strategy used to insert a second copy of PKG or mutant isoforms of pkg into the UPRT locus of PKGI,II-mAID-3HA parasites. dhfr-ts*, Pyrr allele. (B) Coexpression of PKGI,II-mAID-3HA (both green) and PKGI,II-6Ty (red) constructs assessed by IF microscopy. Scale bars = 5 µm.
FIG 4
FIG 4
Functional analysis of PKG isoforms. (A) Flow chart showing the experimental design used to test selected PKG-dependent cellular processes. (B) Western blot assay of parasite ESA fractions probed with antibodies recognizing MIC2 (microneme secretion), GRA7 (dense granule secretion), and SAG1 (surface protein shedding). Parasites were treated with 500 µM IAA or the vehicle (EtOH) for 4 h to deplete PKGI,II-mAID-3HA and then stimulated with BSA-EtOH or buffer alone prior to ESA collection. (C) Invasion of HFF monolayers following treatment with 500 µM IAA or the vehicle (EtOH) for 4 h to deplete PKGI,II-mAID-3HA. Invasion efficiency was calculated as the percentage of the total number of parasites that invaded each host cell in the IAA and mock treatments. Shown are mean values from three experiments each consisting of five replicates per sample and 16 image fields per replicate ± the standard error of the mean. Adjusted P values: *, <0.05; **, <0.01; ***, <0.001; ****, <0.0001; ns, not significant (one-way analysis of variance with Tukey’s multiple-comparison test). (D) Egress from HFF monolayers as determined by IF microscopy. Parasites were grown in HFFs for 20 h and treated with 500 µM IAA or the vehicle (EtOH) for 4 h to deplete PKGI,II-mAID-3HA and then treated with 4 µM calcium ionophore A23187 for 5 min or left untreated. The micrographs at the top illustrate the difference in intact vacuoles. SAG1 (green) parasites remain tightly clustered and are surrounded by the vacuolar membrane, detected with GRA7 (red), versus those that have egressed and where the parasites are scattered outside the vacuole (marked egress). Scale bars = 10 µm. Mean numbers (from two experiments) of intact vacuoles per field as a percentage of the mock treatment for each strain ± the standard error of the mean are shown. In each experiment, 10 fields per treatment per strain were analyzed. Adjusted P value: ****, <0.0001; ns, not significant (two-way analysis of variance with Tukey’s multiple-comparison test). WT, wild type. (E) Plaque formation by parasites treated with 500 µM IAA or the vehicle (EtOH) for 8 days. Shown is the mean number of plaques formed per well (EtOH, n = 6; IAA, n = 6) ± the standard deviation from a single experiment of three experiments with the same outcome. ****, P < 0.0001 (multiple unpaired two-tailed Student t test).
FIG 5
FIG 5
PKGII is dispensable in the presence of PKGI. (A) Western blot assay of parasite lysates probed with antibodies recognizing HA (green) and aldolase (red). (B) Coexpression of PKGI,II-mAID-3HA (both green) and GAP45 (red) in parasites assessed by IF microscopy. Scale bars = 5 µm. (C, D) Plaque formation by parasites treated with 500 µM IAA or the vehicle (EtOH) for 8 days (C) and mean number of plaques formed per well (mock, n = 6; IAA, n = 6) ± the standard deviation (D). ****, P < 0.0001 (unpaired two-tailed Student t test). Panels B to D show data from single experiments of sets of three experiments with the same outcome. The micrograph rows in panel B correspond to the adjacent schematic in panel A.
FIG 6
FIG 6
Plasma membrane localization functionally distinguishes PKGI from PKGII. (A) Schematic of the CRISPR/Cas9 strategy used to insert a second copy of PKG or mutant isoforms of pkg into the UPRT locus of PKGI,II-mAID-3HA parasites. dhfr-ts*, Pyrr allele. (B) Coexpression of PKGI,II-mAID-3HA (both green) and PKG-6Ty complementation constructs (red) assessed by IF microscopy. Scale bars = 5 µm. The micrograph rows correspond to the adjacent schematic in panel A. (C) Coexpression of PKGI,II-mAID-3HA (both green) and PKG-6Ty complementation constructs (red) following 4 h of treatment with 500 µM IAA or the vehicle (EtOH) assessed by IF microscopy. Scale bars = 5 µm. (D, E) Plaque formation by parasites treated with 500 µM IAA or the vehicle (EtOH) for 8 days (D) and mean number of plaques formed per well (mock, n = 6; IAA, n = 6) ± the standard deviation from two experiments (E). ****, P < 0.0001; ns, not significant (unpaired two-tailed Student t test). Panels B and C show data from one of at least two experiments with the same outcome.

References

    1. Seeber F, Steinfelder S. 2016. Recent advances in understanding apicomplexan parasites. F1000Res 5:F1000 Faculty Rev-1369. doi:10.12688/f1000research.7924.1. - DOI - PMC - PubMed
    1. Sibley LD. 2010. How apicomplexan parasites move in and out of cells. Curr Opin Biotechnol 21:592–598. doi:10.1016/j.copbio.2010.05.009. - DOI - PMC - PubMed
    1. Heintzelman MB. 2015. Gliding motility in apicomplexan parasites. Semin Cell Dev Biol 46:135–142. doi:10.1016/j.semcdb.2015.09.020. - DOI - PubMed
    1. Carruthers VB, Tomley FM. 2008. Microneme proteins in apicomplexans. Subcell Biochem 47:33–45. doi:10.1007/978-0-387-78267-6_2. - DOI - PMC - PubMed
    1. Jacot D, Tosetti N, Pires I, Stock J, Graindorge A, Hung YF, Han H, Tewari R, Kursula I, Soldati-Favre D. 2016. An apicomplexan actin-binding protein serves as a connector and lipid sensor to coordinate motility and invasion. Cell Host Microbe 20:731–743. doi:10.1016/j.chom.2016.10.020. - DOI - PubMed

Publication types

MeSH terms

LinkOut - more resources