. 2017 May 16;114(20):E3974-E3983.
doi: 10.1073/pnas.1618551114. Epub 2017 May 2.

Molecular codes for cell type specification in Brn3 retinal ganglion cells

Affiliations

Molecular codes for cell type specification in Brn3 retinal ganglion cells

Szilard Sajgo et al. Proc Natl Acad Sci U S A. .

Abstract

Visual information is conveyed from the eye to the brain by distinct types of retinal ganglion cells (RGCs). It is largely unknown how RGCs acquire their defining morphological and physiological features and connect to upstream and downstream synaptic partners. The three Brn3/Pou4f transcription factors (TFs) participate in a combinatorial code for RGC type specification, but their exact molecular roles are still unclear. We use deep sequencing to define (i) transcriptomes of Brn3a- and/or Brn3b-positive RGCs, (ii) Brn3a- and/or Brn3b-dependent RGC transcripts, and (iii) transcriptomes of retinorecipient areas of the brain at developmental stages relevant for axon guidance, dendrite formation, and synaptogenesis. We reveal a combinatorial code of TFs, cell surface molecules, and determinants of neuronal morphology that is differentially expressed in specific RGC populations and selectively regulated by Brn3a and/or Brn3b. This comprehensive molecular code provides a basis for understanding neuronal cell type specification in RGCs.

Keywords: Pou4f1; Pou4f2; neuronal cell types; retinal ganglion cells; transcription factors.


Conflict of interest statement

The authors declare no conflict of interest.

Figures

Fig. 1.
Fig. 1.
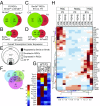
Experimental goal and design. (A) E15 retina containing heterogeneous undifferentiated cells (gray) and RGCs (purple), which are mostly postmitotic and extend axons. (B) P3 retina with RGCs extending dendrites. RGC axons are involved in synapse formation. (C) Comparison strategies. (i) RGC-enriched genes were identified by comparing E15 or P3 RGCs (Brn3aAP or Brn3bAP) with AP-negative cells. (ii) Genes regulated by Brn3s were inferred by comparing Brn3bAP/WT or Brn3aAP/WT (heterozygote) RGCs with Brn3bAP/KO or Brn3aAP/KO (KO) RGCs, respectively. (iii) To identify genes expressed selectively in RGC subpopulations, we compare Brn3bAP/WT with Brn3aAP/WT RGCs. (D) Immunomagnetic purification of RGCs. E15 or P3 retinas are dissociated, and Brn3aAP or Brn3bAP RGCs are separated using anti-AP–coated magnetic beads. RNA was extracted from either supernatant or Brn3AP RGCs-coupled beads and processed for RNASeq. (E) Retinorecipient brain tissue isolation from P3.5 pups. Cholera toxin B (ChTB-AF488) was injected in the eyes of P0.5 mouse pups. At P3.5, brains were isolated and vibratome-sectioned, and green fluorescent regions [LGN, shown in Right, olivary pretectal nucleus (OPN), medial terminal nucleus (MTN), and SC] were dissected. All residual brain regions were pooled and used as controls. (F) The 10-µL samples from each RGC immunopurification were spread on slides and stained for AP and DAPI: (iiii) three examples of Brn3AP RGCs coupled to magnetic beads (top), DAPI nuclear counterstain (middle), and merged images (bottom). Note occasional DAPI-positive AP-negative cells (bead cluster on the right in i). (iv) Retina supernatant after immunopurification showing a Brn3AP RGC (arrowhead) and a retinal pigment epithelium cell (arrow). Estimation of yield and purity is in Materials and Methods and Dataset S1. (Scale bars: E, 250 µm; F, 40 µm.)
Fig. 2.
Fig. 2.
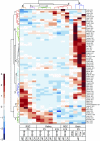
Sample characterization and validation. (A) Log-scale scatter plots comparing FPKM levels. (Left) Comparison of two samples (S1 vs. S2) derived from P3 Brn3aAP/WT RGC; R = 0.9915. (Center) Means of two P3 Brn3aAP/KO RGC samples (KO) vs. means of two P3 Brn3aAP/WT RGC samples (WT); R = 0.9922. (Right) Comparison of a P3 Brn3aAP/WT retinal supernatant (retina) with the mean of two P3 Brn3aAP/WT RGC samples (RGC); R = 0.7761. Red diagonals separate the twofold comparison lines, and the red corners enclose genes with less than two FPKM for both samples in the plot. (B) Clustergram across 18,185 transcripts that were expressed at greater than or equal to one FPKM in at least one of the samples. Clustering was performed on standardized sample values, first along the sample dimension (columns) and then along the transcript dimension (rows) (Materials and Methods). Branches are color-coded and labeled 1–7 as follows: branch 1, Brn3aAP P3 RGCs; branch 2, E15 retina and Brn3bAP RGCs; branch 3, P3 retinas; branch 4, Brn3bAP P3 RGCs; branch 5, SC and PTA; branch 6, whole-brain controls; branch 7, LGN. For each sample (along the bottom), numbers indicate biological replicates. Color scale represents units in SDs of the distribution across all observations for each given row (gene). [Dataset S2 shows cross-correlation matrix of all samples, and Fig. S1 shows additional scatter plots and principal component analysis (PCA).] (C and D) Visualization of mapped reads. (C) Reads from (Upper) Brn3aAP/KO and (Lower) Brn3aAP/WT P3 RGCs mapping to the Brn3a locus. (D) Reads from either (Upper) Brn3bAP/KO or (Lower) Brn3bAP/WT P3 RGCs mapping to the Brn3b locus. The x axis is in kilobases (notches every 0.5 kb). The y axis is scaled to the highest read stack (indicated in the bottom right corner). The AP cDNA inserted in the recombined alleles is indicated. Gray bars flanked by black notches represent reads. Thin blue lines represent spliced reads reaching across two exons. Exons (rectangles) and introns (lines) are shown for Brn3a (Pou4f1, three exons) and Brn3b (Pou4f2, two exons) in C, Lower and D, Lower. Coding regions within exons are blue. (E) Expression levels (FPKM) for Brn3a and Brn3b genes. Mouse WT P3 brain samples are (from top to bottom) whole brain (white; median of two samples), PTA (black; one sample derived from three mice), and SC and LGN (dotted and gray bars, respectively; each medians of three samples). For retina and RGCs, samples are (from top to bottom) P3 Brn3bAP/WT (dark red), Brn3bAP/KO (light red), Brn3aAP/WT (dark green), Brn3aAP/KO (light green), E15 Brn3bAP/WT (dark blue), and Brn3bAP/KO (light blue). Retina values represent individual retinal samples, and RGC samples represent medians of two samples. (F) Expression (FPKM) of the knocked in AP cDNA color-coded as in E. (G) Heat map for known general and subtype-specific RGC markers. Expression levels are normalized to the maximum level for each gene and displayed on a 64-level scale (red is high).
Fig. S1.
Fig. S1.
Statistical characterization of RNASeq samples. (A) Log 10-scale scatter plots of FPKM values for RNASeq samples. The data points represent 26,233 identifiable RefSeq transcripts that were expressed at detectable levels in at least one sample. The two red diagonals separate the twofold comparison lines, and the red corner encloses genes with less than two FPKM for both samples in the plot. (a) Comparison of the two replicates of P3 Brn3bAP/WT RGCs samples; R = 0.9713. (b) Comparison of P3 Brn3bAP/WT RGCs (y axis, medians of two samples) with P3 Brn3bAP/WT retina supernatant control (x axis, one sample); R = 0.9277. (c) Comparison of E15 Brn3bAP/WT RGCs (y axis, means of two samples) with E15 Brn3bAP/WT retina supernatant control (x axis, one sample); R = 0.8684. (d) Comparison of P3 WT PTA (y axis, one sample) with P3 WT whole-brain homogenate (x axis, medians of two samples); R = 0.9739. (e) Comparison of two P3 WT LGN replicates; R = 0.9945. (f) Comparison of P3 WT LGN (y axis, medians of three samples) with P3 WT whole-brain homogenate (x axis, medians of two samples); R = 0.9821. (g) Comparison of two P3 WT SC replicates; R = 0.9914. (h) Comparison of P3 WT SC (y axis, medians of three samples) with P3 WT whole-brain homogenate (x axis, medians of two samples); R = 0.9842. (B and C) PCA plot for principal components 1–2 and 3–4 over all (23,226) RefSeq transcripts of all sequenced samples. WT brain samples [whole brain (brain), SC, LGN and PTA] are in black. P3 Brn3b (RGC) and retinas (sn) are in red, P3 Brn3a (RGC) and retinas (sn) are in green, and E15 Brn3b (RGC) and retina (sn) are in blue. Genotypes for each retina and RGC sample are indicated. (D) PCA cumulative variance plot. Blue bars represent the variance for each principal component, whereas the red lines represent the cumulative sum expressed in percentage of total variance for all components. Note that principal component 1 (PC1) explains about 85% and that PC2 explains about 10%, whereas PC3 and PC4 are almost equal at around 2%. We note that, although PC1 and PC2 produce a separation of the samples in three large groups [i.e., (i) brain samples, (ii) E15 retina and RGC samples, and (iii) P3 retina and RGC samples], the replicates for each group are better “collected” in the PC3 vs. PC4 plot. (E–H) Venn diagrams representing transcripts enriched in Brn3AP RGCs. Expression criteria for transcripts in these panels are as follows. (i) Transcripts are expressed in Brn3AP/WT RGCs at more than two FPKM. (ii) The fold difference between Brn3AP/WT RGCs and retina supernatants is equal to or greater than two. (iii) The fold difference between Brn3AP/WT and Brn3AP/KO RGCs is equal to or greater than two. (E) Partially overlapping gene expression profiles in P3 Brn3aAP/WT RGCs and Brn3bAP/WT RGCs. Note that Brn3aAP/WT-specific transcripts outnumber Brn3bAP/WT-specific or common transcripts. Selection criteria were i and ii. (F) Far more RGC genes are dependent on Brn3b than Brn3a, but neither separately or combined can account for the Brn3AP/WT RGCs-enriched set. Selection criteria were i–iii. (G) Brn3bAP/WT RGCs express partially overlapping but significantly distinct gene expression programs at E15 compared with P3. Selection criteria are i and ii. (H) The number of Brn3b-dependent transcripts increases significantly in Brn3bAP/WT RGCs from E15 to P3. Selection criteria are i–iii. (I) Pie chart summaries of 233 genes analyzed by ISH at P3. Among genes predicted by RNASeq to be RGC-enriched (Brn3–RGC-enriched from A), about 55% appeared RGC-specific, whereas only about 25% appeared negative. Similar ratios were derived by focusing on genes expected to be Brn3-dependent (Brn3-dependent from B). (J) Pie chart summaries of 265 genes found in E15 ISHs from the Allen Brain Institute atlas. The numbers of RGC-specific genes seem to be similar, but genes covering the entire retina are essentially absent. Dataset S4 lists all of the transcripts in the Venn diagrams and pie charts. (K) FPKM values and (L) P3 ISH for genes known to be expressed in RGCs (Pou4f1, Isl2, and Alcam) and negative control. (M) FPKM values and (N) E15 Allen Brain Institute ISH data for genes known to be expressed in RGCs (Eomes, Isl1, and Sncg).
Fig. 3.
Fig. 3.
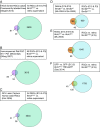
Only a small fraction of genes enriched in Brn3+ RGCs depend on Brn3a or Brn3b. (A–D) Venn diagrams representing transcripts enriched in Brn3AP RGCs. Transcripts reported here are derived from DESeq (42), with a 0.1 false discovery rate and a twofold change between compared conditions. (A and B) Transcripts enriched in Brn3AP RGCs over retina supernatants. (A) Partially overlapping gene expression profiles in P3 Brn3aAP/WT RGCs and Brn3bAP/WT RGCs. (B) Partially overlapping gene expression programs in E15 and P3 Brn3bAP/WT RGCs. (C and D) Transcripts (C) down- or (D) up-regulated in Brn3AP RGCs as a result of either Brn3a or Brn3b loss. (EH) RGC-enriched transcripts validation by ISH. (E and G) FPKM values (indicated on the X axis) for RGC-enriched candidate genes. Plots are scaled to individual maximum levels. Sample color coding as in Fig. 2E. (F) P3 ISHs with probes directed against the 3′ UTR. Note the spectrum of outcomes from RGC-specific (Rab6b and Cpne4) to RGC-enriched (Igsf6 and Nrxn1) and from full retina expression (Itga6) to lack of expression (Lrfn3). (H) In situ analysis of RGC-specific genes at E15.5. Expression images reproduced with permission from the Allen Brain Institute atlas. (I) Pie chart summaries of 223 genes analyzed by ISH at P3 broken down by genes predicted by RNASeq to be RGC-enriched (Brn3–RGC-enriched from A) or Brn3-regulated (Brn3–RGC-regulated from C and D). (J) Pie chart summaries of 58 genes found in E15 ISHs. Fig. S1 K–N shows control experiments for the P3 and E15 in situ screens. Dataset S4 lists all of the transcripts in the Venn diagrams and pie charts. (Scale bar: F, 100 µm; H, 400 µm.)
Fig. 4.
Fig. 4.
Combinatorial gene expression in P3 retinorecipient brain nuclei. (A and B) Venn diagram comparisons of enriched unique or shared genes in LGN-, SC-, and PTA-derived samples. (A) Significantly differentially expressed transcripts identified by DESeq. (B) Transcripts passing the Twofold criterion. (C–G) ISH patterns from Allen Brain Institute atlas at P4 for genes predicted to be nucleus-specific. (C) Cck expression in LGN. (D) Esrrb expression in PTA. (E–G) Gpc3, Barhl1, and Foxb1 expression in three distinct layers of SC. Foxb1 is also expressed in the PTA. Insets show complete sagital brain sections for the genes, documenting expression in additional brain regions. (Scale bars: C–G, 200 µm.) (H) FPKM values across brain regions, retina supernatants, and RGCs for genes presented in C–G. Sample color coding as in Fig. 2E. (I and J) Allen Brain Institute atlas validation outcomes for genes identified in our screen by criteria used in A or B broken down by genes predicted to be expressed only in one retinorecipient nucleus (selective) or expressed at higher levels in two or more retinorecipient nuclei (intersection sets, enriched). From our candidate lists, 122 (LGN), 116 (PTA), and 134 (SC) were present in the Allen Brain Institute atlas, and of those, more than one-half were nucleus-specific for the LGN and SC, but only about one-quarter were nucleus-specific for the PTA. Transcripts in all Venn diagrams and pie charts are listed in Dataset S5.
Fig. 5.
Fig. 5.
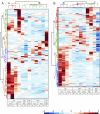
TF repertoire of Brn3aAP and Brn3bAP RGCs and retinorecipient brain areas. (A–D) Venn diagrams representing TF genes enriched in Brn3AP RGCs. Numbers represent transcripts identified using the Twofold and DESeq (parentheses) criteria. Note that the DESeq criteria find a much smaller number of significantly differentially expressed TFs. (E) Venn diagram representing global TF expression in Brn3AP RGCs. Of a list of 2,437 TFs and transcriptional activity molecules (45, 46), 1,647 are expressed at more than one FPKM in Brn3AP RGCs. TF genes enriched in Brn3aAP and/or Brn3bAP RGCs at E15 and/or P3 number 322 by the Twofold criteria (more than two FPKM in RGCs and more than twofold in RGCs compared with retina) and 153 by the DESeq protocol. TF genes differentially expressed in RGCs in a Brn3a- and/or Brn3b-dependent manner are either 95 (Twofold criteria) or 43 (DESeq). (F) Venn diagram with TFs selectively expressed in LGN, SC, and PTA. Numbers represent transcripts identified using the Twofold criteria and DESeq (parentheses). (G) Examples for TFs expressed either selectively or jointly in three retinorecipient nuclei. Expression levels normalized to the maximum level of each gene and displayed on a 64-level heat map (red is high). (H) Clustergram of TFs believed to be important for RGC development. Sample names are labeled at the top, and hierarchical cluster major branches are color-coded and labeled a–c. TFs (highest expressed transcript) are annotated to the right, and hierarchical tree branches of interest are color-coded and labeled 1–5. Color scale bar is at the bottom, and units are in SDs (clustergram details are in Materials and Methods and Fig. 2B). Clustergrams of the complete sets of TFs regulated by Brn3s, enriched in RGCs, or selective for particular retinorecipient areas are provided in Figs. S2 and S3. Dataset S6 lists all transcripts in the Venn diagrams.
Fig. S2.
Fig. S2.
Hierarchical clustering of Brn3-dependent and RGC-Enriched TFs. (A) The clustergram includes 107 transcripts referred to in Fig. 5 B and D. (B) The clustergram includes 388 transcripts referred to in Fig. 5 A and C. Clustering was performed first along the sample dimension and then along the individual gene dimension using the Matlab clustergram function with Euclidean distances and Ward's linkage method. Sample names are labeled at the bottom, and hierarchical cluster major branches are color-coded and labeled a–c. Hierarchical tree branches of interest are color-coded and labeled 1–4, and the transcript identifications are provided in Dataset S6. Color scale bar is at the bottom, and units are in SDs.
Fig. S3.
Fig. S3.
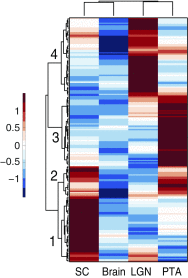
Hierarchical clustering of TFs enriched in retinorecipient areas. The clustergram includes 206 transcripts referred to in Fig. 5F. Clustering and scale bars are the same as in Fig. S2. Sample names are labeled at the bottom. Transcript identifications are provided in Dataset S6. Hierarchical tree branches of interest are labeled 1–4.
Fig. 6.
Fig. 6.
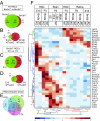
CSM repertoire of Brn3aAP and Brn3bAP RGCs and retinorecipient brain areas. (A–D) Venn diagrams representing adhesion molecule genes from several molecular families believed to be important in neurite formation that were enriched in Brn3AP RGCs. Expression criteria and comparison sets are identical to those in Fig. 5 A–D. The survey includes 822 genes, and the extended analysis is provided in Dataset S7. (E) Venn diagram for adhesion molecules enriched or selective for retinorecipient areas. Expression criteria and comparison are the same as in Fig. 5F (Dataset S7). For A–E, numbers represent transcripts identified using the Twofold and DESeq (parentheses) criteria. (F) Clustergram of a subset of adhesion molecules believed to be important for RGC development. Clustering algorithm and annotations are same as in Fig. 4. Sample names are labeled along the top, and hierarchical cluster major branches are color-coded and labeled a–d. Genes (highest expressed transcript) are annotated on the right, and hierarchical tree branches of interest are color-coded and labeled 1–4. The color scale bar is at the bottom, and units are in SDs. Clustergrams covering the complete sets of differentially regulated or expressed adhesion molecules and guidance receptors are provided in Dataset S7 and Figs. S4 and S5.
Fig. S4.
Fig. S4.
Hierarchical clustering of Brn3-dependent or RGC-enriched CSMs and guidance cues. (A) The clustergram includes 93 transcripts referred to in Fig. 6 B and D. These transcripts have exhibited more than twofold differentials between either Brn3aAP/WT vs. Brn3aAP/KO or Brn3bAP/WT vs. Brn3bAP/KO RGCs. (B) The clustergram includes 237 transcripts referred to in Fig. 6 A and C. These transcripts have exhibited more than twofold differentials between either Brn3aAP/WT or Brn3bAP/WT RGCs and corresponding retina supernatants. Clustering was performed as above. Sample names are labeled at the bottom, and hierarchical cluster major branches are color-coded and labeled a–d. Hierarchical tree branches of interest are color-coded and labeled 1–4, and the transcript identifications are provided in Dataset S7. Note that, for each branch, the transcripts are annotated in ascending order. Color scale bar is at the bottom, and units are in SDs.
Fig. S5.
Fig. S5.
Hierarchical clustering of CSMs and guidance cues enriched in retinorecipient areas. The clustergram includes 206 transcripts referred to in Fig. 6E. These transcripts have exhibited more than twofold differentials between the indicated retinorecipient areas and the whole-brain homogenate. Clustering and scale bars are the same as in Fig. S2. Sample names are labeled at the bottom, and hierarchical cluster major branches are color-coded and labeled a–e. Transcript identifications are indicated to the right, and FPKM values for all samples can be recovered from Dataset S3 by searching with the transcript identifier (e.g., Palld-004). Hierarchical tree branches of interest are labeled 1–7.
Fig. 7.
Fig. 7.
Heterologous overexpression of several RGC-derived genes can affect HEK293 morphology. (A and B) Adeno-associated vector and the overexpression strategy used. A minimized CMV promoter drives an expression cassette flanked by tandem inverted lox sites (black, loxP; white, lox2272) and followed by a minimized SV40 polyadenylation signal. The expression cassette is in reverse orientation and will be activated by inversion/excision induced by the tandem lox sites (FLEX strategy). It consists sequentially of the cDNA for the gene to be expressed (GeneX), a triple HA tag (HA), a self-cleaving T2A peptide, and EGFP coupled to a GAP43 membrane localization signal (meGFP). ITRs are viral inverted terminal repeats. After Cre-mediated inversion–excision, the two peptides are transcribed and separated on translation; the meGFP reveals the plasma membrane, whereas GeneX distributes in its expected subcellular compartment (e.g., nucleus, intracellular compartment, or plasma membrane) and can be traced by immunostaining with αHA. (C) Examples of HEK293-Cre cells transfected with the pAAV_FLEX_GeneX_meGFP vectors. PTPY is a control vector containing teal fluorescent protein tagged with a PSD95 domain and membrane attached yellow fluorescent protein (meYFP). The overexpressed genes are indicated (b–k′). Note extensive process formation or cell area enlargements in HEK293-Cre cells expressing S100a10, Stmn3, Igsf6, Epb4.1l3, Rtn4rl1, and Cpne4. For b–k, highlighted marquees are enlarged, and green and red channels are shown separately in b′–k′. (D) All overexpressed vectors exhibited highly significant cell area enlargements compared with the PTPY control (P < 0.005) (Dataset S8). The y axis is in log10 scale. Box and whiskers plots: the tops and bottoms of each box are the 25th and 75th percentiles of the samples, respectively (interquartile ranges). The lines in the middle of boxes are the sample median. Whiskers are drawn from the ends of the interquartile ranges to the farthest observations within the whisker length (the adjacent values). Short red lines represent outliers. (Scale bar: C, 20 μm.)
Fig. 8.
Fig. 8.
Subcellular localization of candidate genes in RGCs in vivo. (A–D) Examples of adult RGCs from retinas of Brn3bCre/WT mice infected at P0 with AAV1 viral vectors for S100a10, Rtn4rl1, Cpne4, and Igsf6 (constructs are in Fig. 7). Retinas were whole mount-fixed and immunostained with αHA (red) and αGFP (green). (Upper) Merged image of RGC in flat mount perspective; white marquee squares outline soma and segments of dendritic arbor and axon. Lower shows red, green, and merge channels for the highlighted areas. White arrowheads point to meGFP marking dendrite and axon, and white arrows point to HA-tagged gene localization in dendrite and/or axon. Note that, in D, axons and dendritic arbors of two RGCs are visible, and Igsf6 is localized to the axon arbor of only one of them. (E) Dendritic arbor area measurements for Brn3bCre/WT (WT) or Brn3bCre/Cre (KO) RGCs infected with expression vectors for four genes (Datasets S1 and S2). Box and whiskers plots conventions are the same as in Fig. 7D. Examples for the Brn3bCre/Cre (KO) RGC infections are shown in Fig. S6. (Scale bars: A–D, 100 μm; Insets, 35 μm.)
Fig. S6.
Fig. S6.
Subcellular localization of candidate genes in Brn3bCre/KO (KO) RGCs in vivo. (A–D) Examples of adult RGCs from retinas of Brn3bCre/KO mice infected at P0 with AAV1 viral vectors for S100a10, Rtn4rl1, Cpne4, and Igsf6 (Figs. 7 and 8). Sample preparation and labels as in Fig. 8. Examples for the Brn3bCre/WT (WT) RGC infections are shown in Fig. 8, and cell counts and parameters are in Dataset S8. (Scale bar: A–D, 100 μm; Insets, 35 μm.) (E–G) Examples of vertical sections through adult WT mouse retinas showing cellular/subcellular distribution of (E) S100a10, (F) Cpne4, and (G) Igsf6. Inner nuclear layer (INL), inner plexyform layer (IPL), and GCL are indicated at the left. For each marker, retinas from three to six mice were stained, and eight images were captured. Upper shows marker in red, Brn3a (as an RGC marker) in green, and DAPI nuclear stain in blue. Red–blue, green–blue, and merged images are given for each gene. Cells highlighted with arrows are shown enlarged in Lower. Asterisk in E denotes axonal process in an S100a10-positive RGC. Note that punctate staining, most likely derived from dendritic distribution, is visible for all three markers throughout the IPL. S100a10 intensely labeled axons and cell bodies, including the nucleus. Cpne4 had a punctate pattern in the retinal IPL, where the RGC dendrites laminate, as well as the cell bodies and nuclei of some RGCs. Igsf6 labeled RGC bodies excluding the nucleus but was also distributed in some IPL dendrites as puncta. (Scale bar: E–G, 25 μm; Insets, 32 μm.)
Fig. S7.
Fig. S7.
Comparison with other gene expression profiling screens. Venn diagrams represent the partial overlaps with (A–C) three RGC profiling screens and (D–F) three Brn3 or Math5 transcriptional regulation screens. For each comparison, we indicate the screen condition, selection criteria, the reference, and the relevant subset of our data. The genes either unique to the other screens or common with our screen are provided in Dataset S9.

Similar articles

Cited by

References

    1. Hobert O. Regulation of terminal differentiation programs in the nervous system. Annu Rev Cell Dev Biol. 2011;27:681–696. - PubMed
    1. Jessell TM. Neuronal specification in the spinal cord: Inductive signals and transcriptional codes. Nat Rev Genet. 2000;1:20–29. - PubMed
    1. Komiyama T, Luo L. Development of wiring specificity in the olfactory system. Curr Opin Neurobiol. 2006;16:67–73. - PubMed
    1. Bassett EA, Wallace VA. Cell fate determination in the vertebrate retina. Trends Neurosci. 2012;35:565–573. - PubMed
    1. Badea TC, Nathans J. Quantitative analysis of neuronal morphologies in the mouse retina visualized by using a genetically directed reporter. J Comp Neurol. 2004;480:331–351. - PubMed

Publication types

Substances