

Mechanism of signal propagation in Physarum polycephalum
- PMID: 28465441
- PMCID: PMC5441820
- DOI: 10.1073/pnas.1618114114
Mechanism of signal propagation in Physarum polycephalum
Abstract
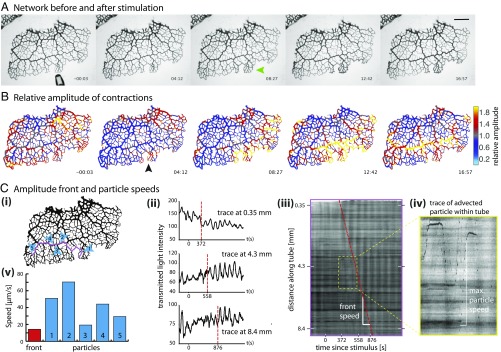
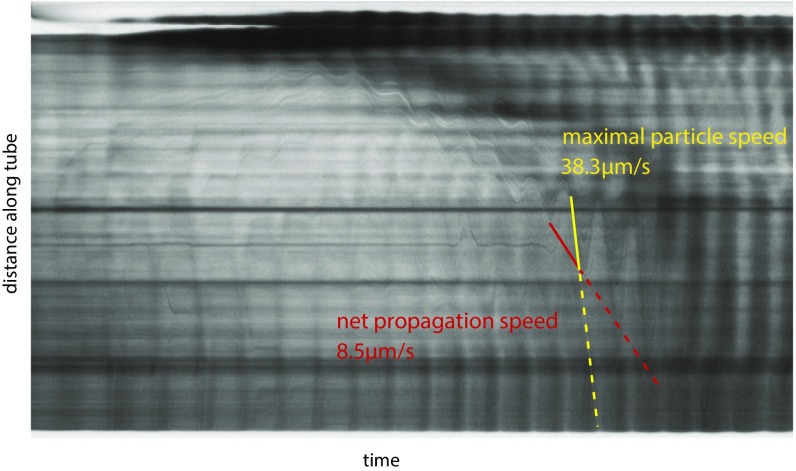
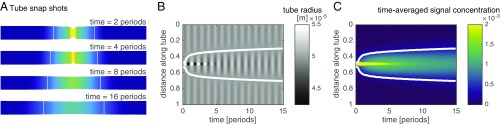
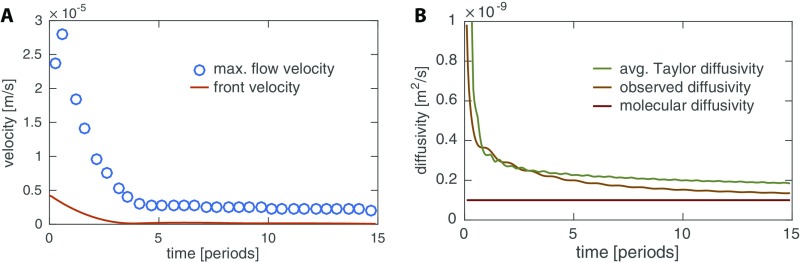
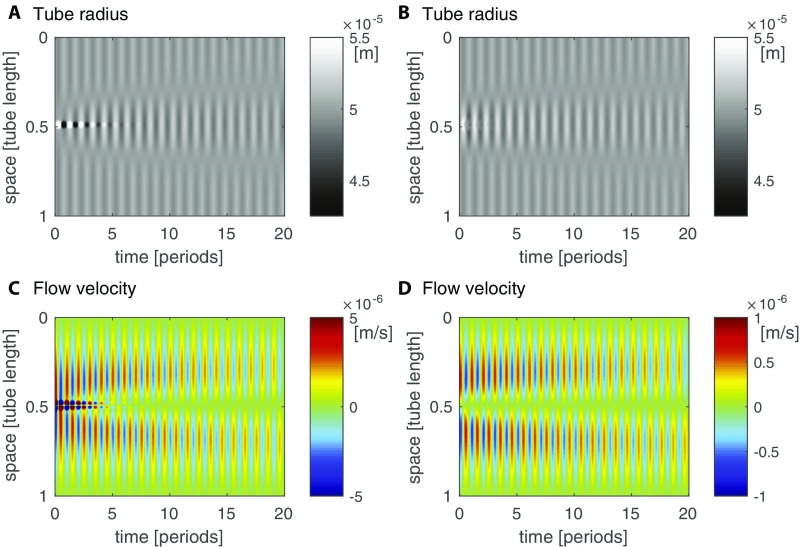
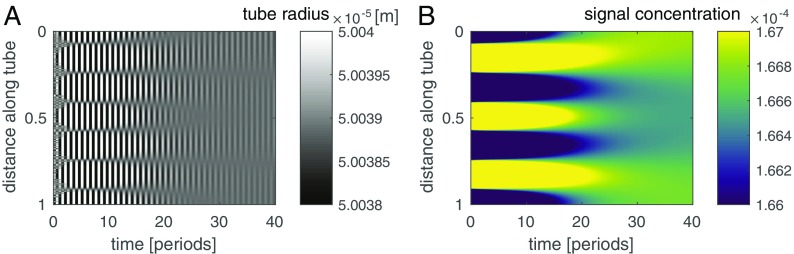
Complex behaviors are typically associated with animals, but the capacity to integrate information and function as a coordinated individual is also a ubiquitous but poorly understood feature of organisms such as slime molds and fungi. Plasmodial slime molds grow as networks and use flexible, undifferentiated body plans to forage for food. How an individual communicates across its network remains a puzzle, but Physarum polycephalum has emerged as a novel model used to explore emergent dynamics. Within P. polycephalum, cytoplasm is shuttled in a peristaltic wave driven by cross-sectional contractions of tubes. We first track P. polycephalum's response to a localized nutrient stimulus and observe a front of increased contraction. The front propagates with a velocity comparable to the flow-driven dispersion of particles. We build a mathematical model based on these data and in the aggregate experiments and model identify the mechanism of signal propagation across a body: The nutrient stimulus triggers the release of a signaling molecule. The molecule is advected by fluid flows but simultaneously hijacks flow generation by causing local increases in contraction amplitude as it travels. The molecule is initiating a feedback loop to enable its own movement. This mechanism explains previously puzzling phenomena, including the adaptation of the peristaltic wave to organism size and P. polycephalum's ability to find the shortest route between food sources. A simple feedback seems to give rise to P. polycephalum's complex behaviors, and the same mechanism is likely to function in the thousands of additional species with similar behaviors.
Keywords: Taylor dispersion; acellular slime mold; behavior; transport network.
Conflict of interest statement
The authors declare no conflict of interest.
Figures
Similar articles
-
Fluid flows shaping organism morphology.Philos Trans R Soc Lond B Biol Sci. 2018 May 26;373(1747):20170112. doi: 10.1098/rstb.2017.0112. Philos Trans R Soc Lond B Biol Sci. 2018. PMID: 29632264 Free PMC article. Review.
-
Random network peristalsis in Physarum polycephalum organizes fluid flows across an individual.Proc Natl Acad Sci U S A. 2013 Aug 13;110(33):13306-11. doi: 10.1073/pnas.1305049110. Epub 2013 Jul 29. Proc Natl Acad Sci U S A. 2013. PMID: 23898203 Free PMC article.
-
A revised model of fluid transport optimization in Physarum polycephalum.J Math Biol. 2017 Feb;74(3):567-581. doi: 10.1007/s00285-016-1036-y. Epub 2016 Jun 11. J Math Biol. 2017. PMID: 27289474
-
Different Morphotypes of Physarum polycephalum as Models for Chemotaxis and Locomotion.Methods Mol Biol. 2024;2828:69-78. doi: 10.1007/978-1-0716-4023-4_7. Methods Mol Biol. 2024. PMID: 39147971
-
Brainless but Multi-Headed: Decision Making by the Acellular Slime Mould Physarum polycephalum.J Mol Biol. 2015 Nov 20;427(23):3734-43. doi: 10.1016/j.jmb.2015.07.007. Epub 2015 Jul 17. J Mol Biol. 2015. PMID: 26189159 Review.
Cited by
-
Emission and biosynthesis of volatile terpenoids from the plasmodial slime mold Physarum polycephalum.Beilstein J Org Chem. 2019 Nov 28;15:2872-2880. doi: 10.3762/bjoc.15.281. eCollection 2019. Beilstein J Org Chem. 2019. PMID: 31839833 Free PMC article.
-
Fluid flows shaping organism morphology.Philos Trans R Soc Lond B Biol Sci. 2018 May 26;373(1747):20170112. doi: 10.1098/rstb.2017.0112. Philos Trans R Soc Lond B Biol Sci. 2018. PMID: 29632264 Free PMC article. Review.
-
Encoding memory in tube diameter hierarchy of living flow network.Proc Natl Acad Sci U S A. 2021 Mar 9;118(10):e2007815118. doi: 10.1073/pnas.2007815118. Proc Natl Acad Sci U S A. 2021. PMID: 33619174 Free PMC article.
-
Emergence of behaviour in a self-organized living matter network.Elife. 2022 Jan 21;11:e62863. doi: 10.7554/eLife.62863. Elife. 2022. PMID: 35060901 Free PMC article.
-
Adaptive behaviour and learning in slime moulds: the role of oscillations.Philos Trans R Soc Lond B Biol Sci. 2021 Mar 15;376(1820):20190757. doi: 10.1098/rstb.2019.0757. Epub 2021 Jan 25. Philos Trans R Soc Lond B Biol Sci. 2021. PMID: 33487112 Free PMC article.
References
-
- Bonner JT. The Evolution of Culture in Animals. Princeton Univ Press; Princeton: 1980.
-
- Berg HC. Chemotaxis in bacteria. Ann Rev Biophys Bioeng. 1975;4:119–136. - PubMed
-
- Boddy L, Hynes J, Bebber DP, Fricker MD. Saprotrophic cord systems: Dispersal mechanisms in space and time. Mycoscience. 2009;50:9–19.
-
- Nakagaki T, Yamada H, Tóth A. Maze-solving by an amoeboid organism. Nature. 2000;407:470. - PubMed
Publication types
MeSH terms
LinkOut - more resources
Full Text Sources
Other Literature Sources
