. 2017 May 2;7(1):1317.
doi: 10.1038/s41598-017-00971-6.

Gene expression profiling describes the genetic regulation of Meloidogyne arenaria resistance in Arachis hypogaea and reveals a candidate gene for resistance

Affiliations

Gene expression profiling describes the genetic regulation of Meloidogyne arenaria resistance in Arachis hypogaea and reveals a candidate gene for resistance

Josh Clevenger et al. Sci Rep. .

Abstract

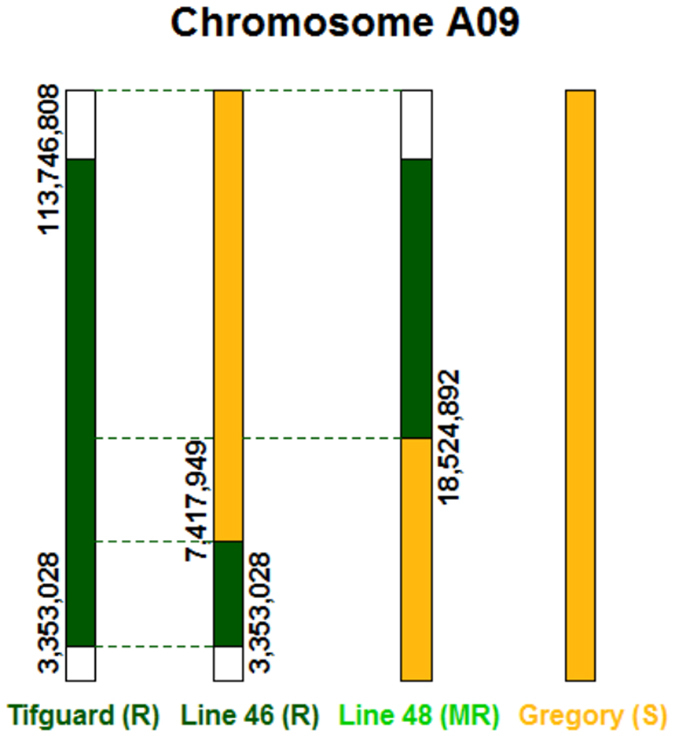
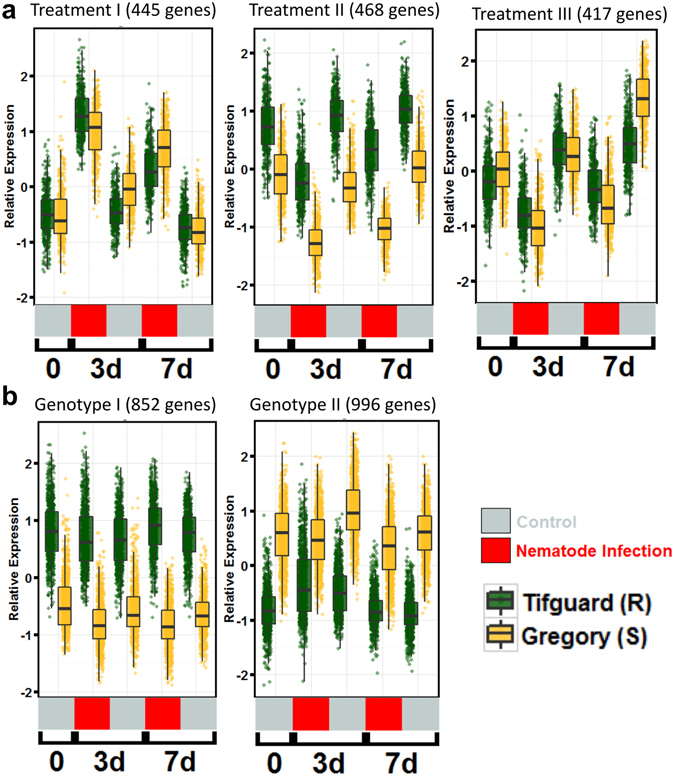
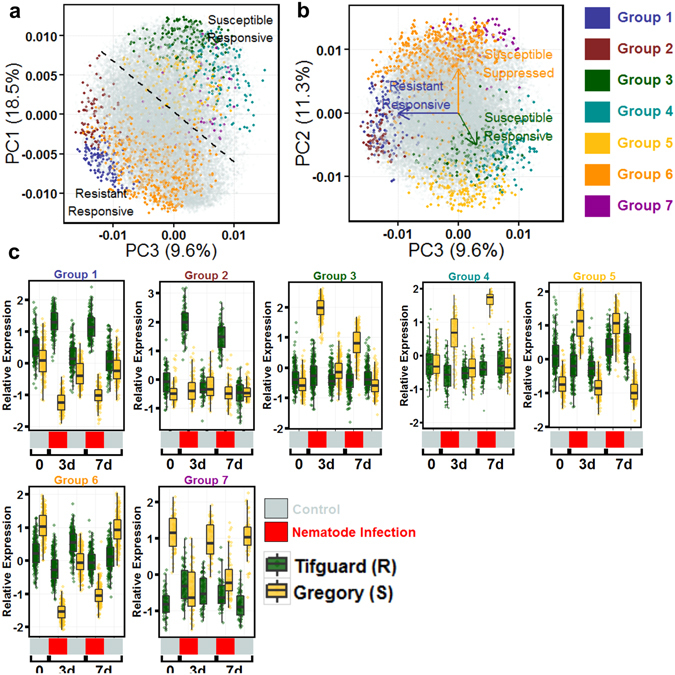
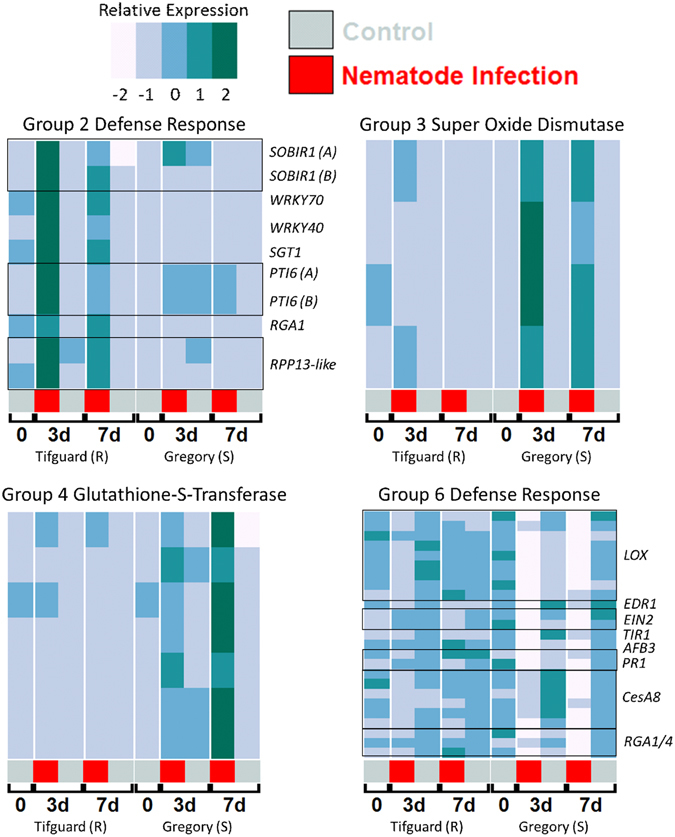
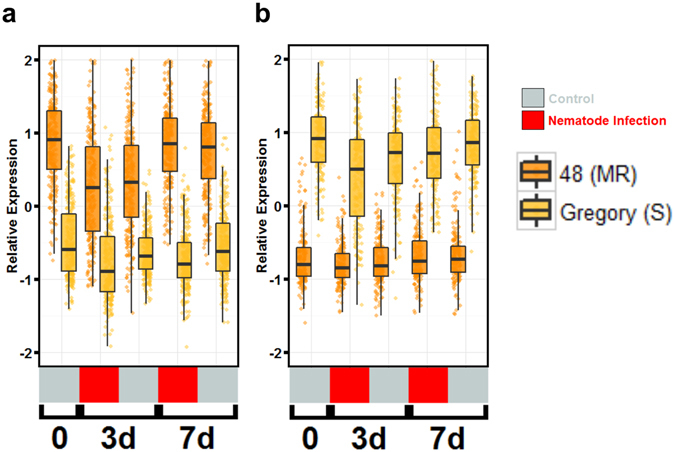
Resistance to root-knot nematode was introgressed into cultivated peanut Arachis hypogaea from a wild peanut relative, A. cardenasii and previously mapped to chromosome A09. The highly resistant recombinant inbred RIL 46 and moderately resistant RIL 48 were selected from a population with cv. Gregory (susceptible) and Tifguard (resistant) as female and male parents, respectively. RNA-seq analysis was performed on these four genotypes using root tissue harvested from root-knot nematode infected plants at 0, 3, 7 days after inoculation. Differential gene expression analysis provides evidence that root-knot nematodes modulate biological pathways involved in plant hormone, defense, cell signaling, cytoskeleton and cell wall metabolism in a susceptible reaction. Corresponding to resistance reaction, an effector-induced-immune response mediated by an R-gene was identified in Tifguard. Mapping of the introgressed region indicated that 92% of linkage group A09 was of A. cardenasii origin in Tifguard. RIL46 and RIL 48 possessed 3.6% and 83.5% of the introgression on A09, respectively. Within the small introgressed region carried by RIL 46, a constitutively expressed TIR-NBS-LRR gene was identified as the candidate for nematode resistance. Potential defense responsive pathways include effector endocytosis through clathrin-coated vesicle trafficking, defense signaling through membrane lipid metabolism and mucilage production.


Conflict of interest statement

The authors declare that they have no competing interests.

Figures

Figure 1
Figure 1
Physical map representation of A. cardenasii introgression in Tifguard, Line 46, and Line 48. Physical mapping is based on mapping of 555 SNPs diagnostic for A. cardenasii onto the A. duranensis reference pseudomolecule A09. Distinction between Gregory and Tifguard based on SWEEP filtered parental SNPs retained in each RIL line.
Figure 2
Figure 2
Co-expression clusters of significantly expressed genes affected by treatment and genotype. (a) Clusters representing genes affected by treatment (nematode infection). (b) Clusters representing genes affected by genotype. Jitter boxplots representing Z-score transformed relative expression of differentially expressed genes in each cluster. Boxplots represent median relative expression, first quartile (bottom of box), third quartile (top of box), and maxima. The actual spread of the data is represented by jittered dots so the relative expression of every individual gene is represented on the plot. Uninoculated control (silver) samples and samples inoculated with 20,000 juvenile Meloidogyne arenaria (red) and harvested at 3 days (3d) and 7 days (7d) after inoculation.
Figure 3
Figure 3
Genes differentially expressed affected by genotype x treatment. (a) PCA of all genes’ expression profiles with selected G x T gene co-expression networks highlighted. Groups can be separated into genes that respond to nematode treatment only in Tifguard (R) and those that respond only in Gregory (S). (b) Graphing PC2 and PC3 allows separation of the 7 co-expression groups into 3 categories, susceptible responsive, susceptible suppressed, and resistant responsive. (c) Boxplots of the expression patterns for each group. Boxplots represent median relative expression, first quartile (bottom of box), third quartile (top of box), and maxima. The actual spread of the data is represented by jittered dots so the relative expression of every individual gene is represented on the plot. Uninoculated control (silver) samples and samples inoculated with 20,000 juvenile Meloidogyne arenaria (red) and harvested at 3 days (3d) or 7 days (7d) after inoculation. Group I (141 genes); Group 2 (81 genes); Group 3 (197 genes); Group 4 (132 genes); Group 5 (184 genes); Group 6 (653 genes); Group 7 (62 genes).
Figure 4
Figure 4
Expression heatmaps of individual differentially expressed genes from top GO enriched categories of selected groups. Individual genes representing top enriched GO terms from genotype x treatment-affected, differentially expressed gene clusters Group 2 (Resistant Responsive; “Defense response”), Group 3 (Susceptible Responsive; “Super Oxide Dismutase Activity”), Group 4 (Susceptible Responsive; “Glutathione Transferase Activity”), and Group 6 (Susceptible Suppressed; “Defense Response”). Heatmap expression is Z-score normalized relative expression. Uninoculated control (silver) samples and samples inoculated with 20,000 juvenile Meloidogyne arenaria (red) and harvested at 3 days (3d) or 7 days (7d) after inoculation. Black boxes in the heatmap indicate the genes are from the same family. For PTI and SOBIR1 the two genes are putative A and B homeologous copies.
Figure 5
Figure 5
Differentially expressed genes affected by genotype between RIL 48 (MR) and Gregory (S). (a) Genes constitutively more highly expressed in line 48 compared to Gregory and (b) genes constitutively lower expressed in line 48 compared to Gregory. Boxplots represent median relative expression, first quartile (bottom of box), third quartile (top of box), and maxima. The actual spread of the data is represented by jittered dots so the relative expression of every individual gene is represented on the plot. Uninoculated control (silver) samples and samples inoculated with 20,000 juvenile Meloidogyne arenaria (red) and harvested at 3 days (3d) or 7 days (7d) after inoculation.

Similar articles

Cited by

References

    1. Abad P, et al. Root-knot nematode parasitism and host response: molecular basis of a sophisticated interaction. Mol Plant Pathol. 2003;4:217–224. doi: 10.1046/j.1364-3703.2003.00170.x. - DOI - PubMed
    1. Dong WB, et al. Resistance in peanut cultivars and breeding lines to three root-knot nematode species. Plant Dis. 2008;92:631–638. doi: 10.1094/PDIS-92-4-0631. - DOI - PubMed
    1. Williamson VM, et al. Nematode pathogenesis and resistance in plants. Plant Cell. 1996;8:1735–1745. doi: 10.1105/tpc.8.10.1735. - DOI - PMC - PubMed
    1. Minton, N. A. & Baujard, P. Nematode parasites of peanut. Plant parasitic nematodes in subtropical and tropical agriculture. M. Luc, R. A. Sikora and J. Bridge. Wallingford, UK, CABl, 285–320 (1990).
    1. Milligan SB, et al. The root knot nematode resistance gene Mi from tomato is a member of the leucine zipper, nucleotide binding, leucine-rich repeat family of plant genes. Plant Cell. 1998;10:1307–1319. doi: 10.1105/tpc.10.8.1307. - DOI - PMC - PubMed

Publication types