. 2017 May 2;7(1):1370.
doi: 10.1038/s41598-017-01409-9.

Oxidation of protein-bound methionine in Photofrin-photodynamic therapy-treated human tumor cells explored by methionine-containing peptide enrichment and quantitative proteomics approach

Affiliations

Oxidation of protein-bound methionine in Photofrin-photodynamic therapy-treated human tumor cells explored by methionine-containing peptide enrichment and quantitative proteomics approach

Ya-Ju Hsieh et al. Sci Rep. .

Abstract

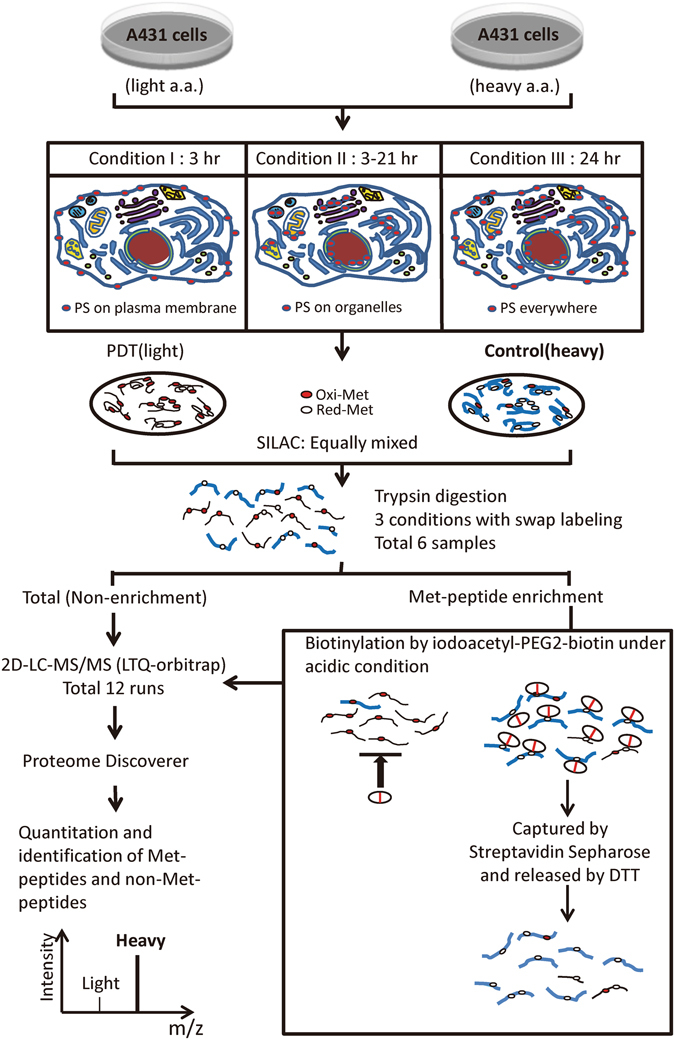
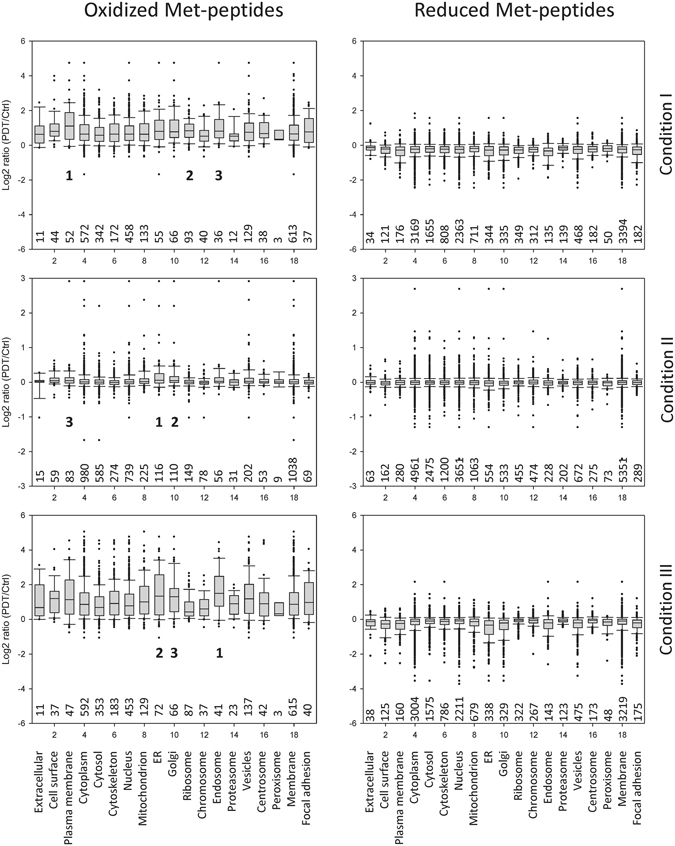
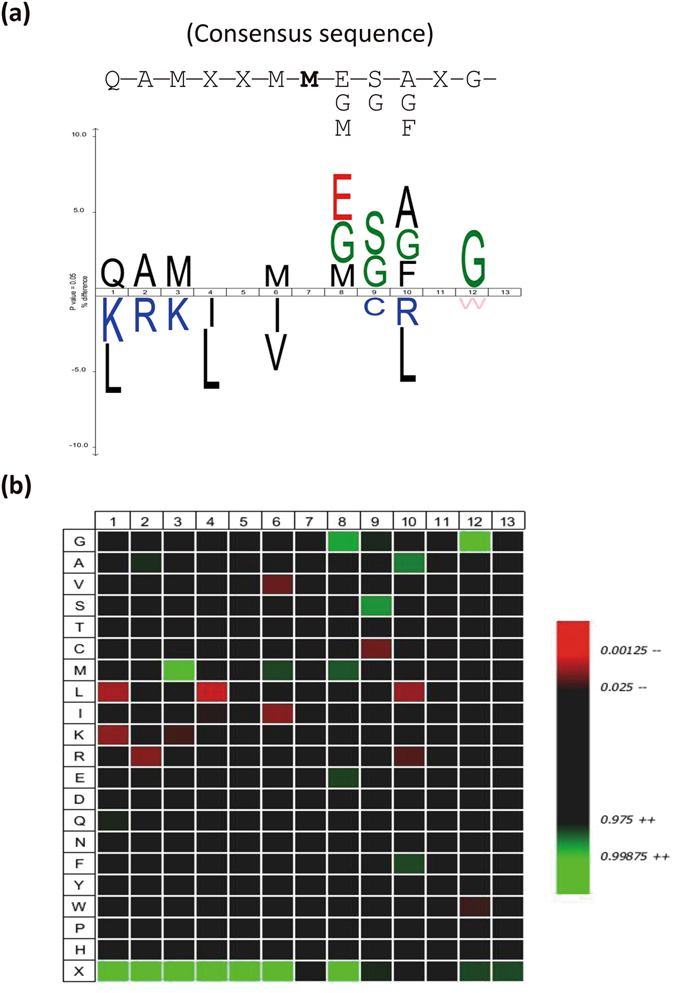
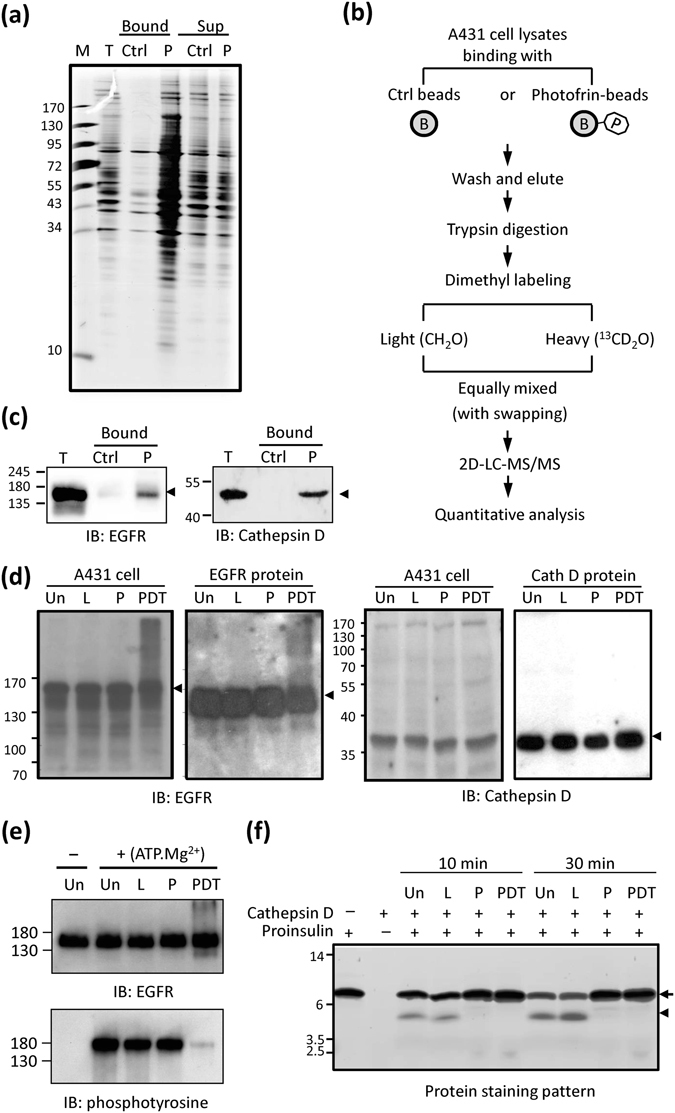
In Photofrin-mediated photodynamic therapy (PDT), cell fate can be modulated by the subcellular location of Photofrin. PDT triggers oxidative damage to target cells, including the methionine (Met) oxidation of proteins. Here, we developed a new Met-containing peptide enrichment protocol combined with SILAC-based quantitative proteomics, and used this approach to explore the global Met oxidation changes of proteins in PDT-treated epidermoid carcinoma A431 cells preloaded with Photofrin at the plasma membrane, ER/Golgi, or ubiquitously. We identified 431 Met-peptides corresponding to 302 proteins that underwent severe oxidation upon PDT and observed overrepresentation of proteins related to the cell surface, plasma membrane, ER, Golgi, and endosome under all three conditions. The most frequently oxidized Met-peptide sequence was "QAMXXMM-E/G/M-S/G-A/G/F-XG". We also identified several hundred potential Photofrin-binding proteins using affinity purification coupled with LC-MS/MS, and confirmed the bindings of EGFR and cathepsin D with Photofrin. The enzyme activities of both proteins were significantly reduced by Photofrin-PDT. Our results shed light on the global and site-specific changes in Met-peptide oxidation among cells undergoing Photofrin-PDT-mediated oxidative stress originating from distinct subcellular sites, and suggest numerous potential Photofrin-binding proteins. These findings provide new insight into the molecular targets through which Photofrin-PDT has diverse effects on target cells.


Conflict of interest statement

The authors declare that they have no competing interests.

Figures

Figure 1
Figure 1
The scheme for Met-peptide enrichment. Reduced Met-peptides are labeled by the iodoacetyl-PEG2-biotin reagent under acidic conditions, whereas the oxidized Met-peptides are not. The labeled peptides are then captured and purified with streptavidin-Sepharose beads. After reduction by DTT, the captured Met-peptides are released from the beads and analyzed by LC-MS/MS.
Figure 2
Figure 2
Workflow for Met oxidation profiling in A431 cells treated with different Photofrin-PDT regimens. SILAC-labeled A431 cells were preloaded with Photofrin (as photosensitizer, PS) under three different incubation conditions (conditions I-III), and treated with or without laser irradiation to generate paired control and PDT cell groups, respectively. Equal amount of protein extracts from the control and PDT groups were mixed at a 1:1 ratio and digested with trypsin. Each digested sample was divided into two parts; one part was directly analyzed by 2D-LC-MS/MS (LTQ-Orbitrap), while the other was subjected to iodoacetyl-PEG2-biotin-mediated Met-peptide enrichment, followed by the same 2D-LC-MS/MS analysis. A label-swap replication of the SILAC experiment was applied to each condition. The Protein Discoverer software (Thermo Scientific) was used to combine and analyze the MS data from all 12 runs.
Figure 3
Figure 3
The efficiency of Met-peptide enrichment from A431 cells under the three different PDT conditions. The numbers of Met- and non-Met-peptides detected in the non-enriched and enriched samples were calculated for each condition. The three conditions (with swapping experiments) were analyzed separately. The red bars indicate the Met-peptides specifically identified in either non-enriched or enriched samples, while the purple bars indicate Met-peptides that were commonly identified in both, and the blue and green bars represent non-Met-peptides. The number above each column denotes the Met-peptides as a percentage of the total identified peptides.
Figure 4
Figure 4
The log2 (PDT/Ctrl) ratio distributions of all identified peptides, non-Met-peptides, oxidized Met-peptides, and reduced Met-peptides under the three conditions. The box represents the 25 to 75% distribution, and the line in the box shows the median ratio. The upper and lower10% distributions are marked at the top and bottom of the box, respectively. The peptide numbers and the ratios of the medians are shown at the bottom.
Figure 5
Figure 5
The redox status of cellular organelles in A431 cells subjected to the different Photofrin-PDT regimens. The proteins corresponding to the quantified Met-peptides (oxidized or reduced) were assigned to their known subcellular locations using GO analysis, and the log2 (PDT/Ctrl) ratio distributions of all oxidized (left panels) and reduced (right panels) Met-peptides were analyzed for each cellular site/organelle under each PDT condition. The box representations are the same as in Fig. 4. The numbers of oxidized (or reduced) Met-peptides grouped and analyzed in each cellular site/organelle are shown below each box. The top three most severely oxidized cellular structures in each PDT condition are indicated by 1, 2 and 3 in left panels.
Figure 6
Figure 6
The consensus sequence of the oxidized Met-peptides, as analyzed using the iceLogo software. The frequencies of each amino acid at positions surrounding the oxidized Met residues of the 431 oxidized Met-peptides from three PDT conditions were analyzed with the iceLogo software, using a reference database containing all of the non-oxidized Met-peptides identified in our experiments. (a) The high- and low-frequency amino acid residues are shown at upper and lower part of the iceLogo, respectively. The oxidized Met residue is set at position 7. (b) A heat map generated from the same analysis. In both panels, only significantly overrepresented amino acid residues (P < 0.05) are shown.
Figure 7
Figure 7
Identification and verification of Photofrin-interacting proteins. (a) SDS-PAGE analysis of potential Photofrin-interacting proteins. A431 cell lysates (1 mg of protein) were incubated with Photofrin-coupled beads (P) or control beads (Ctrl), and washed with 1 M NaCl and PBS. The bead-bound proteins (Bound) and the unbound supernatants (Sup) were subjected to SDS-PAGE followed by silver staining. T, total cell lysates. (b) The proteomics workflow used to identify potential Photofrin-interacting proteins. See the Materials and Methods for details. (c) Samples were processed as described in (a), and the bead-bound proteins (Bound) were subjected to SDS-PAGE followed by Western blot analysis with anti-EGFR or anti-cathepsin D antibodies. T, total cell lysates. (d) A431 cells or recombinant EGFR (or cathepsin D) proteins were left untreated (Un) or treated with laser irradiation (L), Photofrin (P), or both (PDT), and the cell lysates or reaction products were subjected to Western blot analysis with anti-EGFR (left panel) or anti-cathepsin D (right panel) antibodies. (e) Recombinant EGFR was treated as described in (d) and then incubated with (+) or without (−) kinase assay buffer containing ATP.Mg2+at 30 °C for 10 min. The reaction products were subjected to Western blot analysis with anti-EGFR or anti-phosphotyrosine antibodies. (f) Recombinant cathepsin D was treated as described in (d), and the untreated/treated cathepsin D proteins were incubated with a reaction mixture containing 0.5 μg proinsulin at 37 °C for 10 or 30 min. The reaction products were analyzed by SDS-PAGE followed by silver staining. The arrow and arrowhead indicate proinsulin and its processed product, respectively.

References

    1. Dolmans DE, Fukumura D, Jain RK. Photodynamic therapy for cancer. Nat Rev Cancer. 2003;3:380–387. doi: 10.1038/nrc1071. - DOI - PubMed
    1. Sakharov DV, Elstak ED, Chernyak B, Wirtz KW. Prolonged lipid oxidation after photodynamic treatment. Study with oxidation-sensitive probe C11-BODIPY581/591. FEBS Lett. 2005;579:1255–1260. doi: 10.1016/j.febslet.2005.01.024. - DOI - PubMed
    1. Magi B, et al. Selectivity of protein carbonylation in the apoptotic response to oxidative stress associated with photodynamic therapy: a cell biochemical and proteomic investigation. Cell Death Differ. 2004;11:842–852. doi: 10.1038/sj.cdd.4401427. - DOI - PubMed
    1. Woods JA, Traynor NJ, Brancaleon L, Moseley H. The effect of photofrin on DNA strand breaks and base oxidation in HaCaT keratinocytes: a comet assay study. Photochem Photobiol. 2004;79:105–113. doi: 10.1111/j.1751-1097.2004.tb09864.x. - DOI - PubMed
    1. Buytaert E, Dewaele M, Agostinis P. Molecular effectors of multiple cell death pathways initiated by photodynamic therapy. Biochim Biophys Acta. 2007;1776:86–107. - PubMed

Publication types