Thrombopoietin Secretion by Human Ovarian Cancer Cells
- PMID: 28465688
- PMCID: PMC5390644
- DOI: 10.1155/2017/1873834
Thrombopoietin Secretion by Human Ovarian Cancer Cells
Abstract
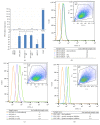
The thrombopoietin (TPO) gene expression in human ovary and cancer cells from patients with ovarian carcinomatosis, as well as several cancer cell lines including MDA-MB231 (breast cancer), K562 and HL60 (Leukemic cells), OVCAR-3NIH and SKOV-3 (ovarian cancer), was performed using RT PCR, real-time PCR, and gene sequencing. Human liver tissues are used as controls. The presence of TPO in the cells and its regulation by activated protein C were explored by flow cytometry. TPO content of cell extract as well as plasma of a patient with ovarian cancer was evaluated by ELISA. The functionality of TPO was performed in coculture on the basis of the viability of a TPO-dependent cell line (Ba/F3), MTT assay, and Annexin-V labeling. As in liver, ovarian tissues and all cancer cells lines except the MDA-MB231 express the three TPO-1 (full length TPO), TPO-2 (12 bp deletion), and TPO-3 (116 pb deletion) variants. Primary ovarian cancer cells as well as cancer cell lines produce TPO. The thrombopoietin production by OVCAR-3 increased when cells are stimulated by aPC. OVCAR-3 cell's supernatant can replace exogenous TPO and inhibited TPO-dependent cell line (Ba/F3) apoptosis. The thrombopoietin produced by tumor may have a direct effect on thrombocytosis/thrombosis occurrence in patients with ovarian cancer.
Figures


Similar articles
-
PO-13 - Production of a functional thrombopoietin by a human ovarian cancer cell line.Thromb Res. 2016 Apr;140 Suppl 1:S181. doi: 10.1016/S0049-3848(16)30146-3. Epub 2016 Apr 8. Thromb Res. 2016. PMID: 27161701
-
Thrombopoietin regulates proliferation, apoptosis, secretory activity and intracellular messengers in porcine ovarian follicular cells: involvement of protein kinase A.J Endocrinol. 2004 Dec;183(3):595-604. doi: 10.1677/joe.1.05763. J Endocrinol. 2004. PMID: 15590985
-
Production of thrombopoietin by human carcinomas and its novel isoforms.Blood. 1999 Sep 15;94(6):1952-60. Blood. 1999. PMID: 10477724
-
Thrombopoietin: expression of its receptor MPL and proliferative effects on leukemic cells.Leukemia. 1996 Sep;10(9):1405-21. Leukemia. 1996. PMID: 8751457 Review.
-
The role of the liver in the production of thrombopoietin compared with erythropoietin.Eur J Gastroenterol Hepatol. 2001 Jul;13(7):791-801. doi: 10.1097/00042737-200107000-00006. Eur J Gastroenterol Hepatol. 2001. PMID: 11474308 Review.
Cited by
-
Platelet-Cancer Interplay: Molecular Mechanisms and New Therapeutic Avenues.Front Oncol. 2021 Jul 12;11:665534. doi: 10.3389/fonc.2021.665534. eCollection 2021. Front Oncol. 2021. PMID: 34322381 Free PMC article. Review.
-
Platelets and Metastasis: New Implications of an Old Interplay.Front Oncol. 2020 Sep 18;10:1350. doi: 10.3389/fonc.2020.01350. eCollection 2020. Front Oncol. 2020. PMID: 33042789 Free PMC article. Review.
-
The "Janus Face" of Platelets in Cancer.Int J Mol Sci. 2020 Jan 25;21(3):788. doi: 10.3390/ijms21030788. Int J Mol Sci. 2020. PMID: 31991775 Free PMC article. Review.
-
Platelets, Thrombocytosis, and Ovarian Cancer Prognosis: Surveying the Landscape of the Literature.Int J Mol Sci. 2020 Oct 31;21(21):8169. doi: 10.3390/ijms21218169. Int J Mol Sci. 2020. PMID: 33142915 Free PMC article. Review.
-
Tumor cell-induced platelet aggregation accelerates hematogenous metastasis of malignant melanoma by triggering macrophage recruitment.J Exp Clin Cancer Res. 2023 Oct 23;42(1):277. doi: 10.1186/s13046-023-02856-1. J Exp Clin Cancer Res. 2023. PMID: 37872588 Free PMC article.
References
-
- Trousseau A. Clinique Médicale de l'Hôtel-Dieu de Paris. Baillière; 1865.
-
- Wojtukiewicz M. Z., Sierko E., Kisiel W. Seminars in Thrombosis and Hemostasis. New York, NY, USA: Stratton Intercontinental Medical Book Corporation; 2007. The role of hemostatic system inhibitors in malignancy; pp. 621–642. - PubMed
LinkOut - more resources
Full Text Sources
Other Literature Sources
Research Materials
Miscellaneous

