Review
. 2018 Feb;34(1):165-177.
doi: 10.1007/s12264-017-0133-2. Epub 2017 May 2.

Cortical Representation of Pain and Touch: Evidence from Combined Functional Neuroimaging and Electrophysiology in Non-human Primates

Affiliations
Review

Cortical Representation of Pain and Touch: Evidence from Combined Functional Neuroimaging and Electrophysiology in Non-human Primates

Li Min Chen. Neurosci Bull. 2018 Feb.

Abstract

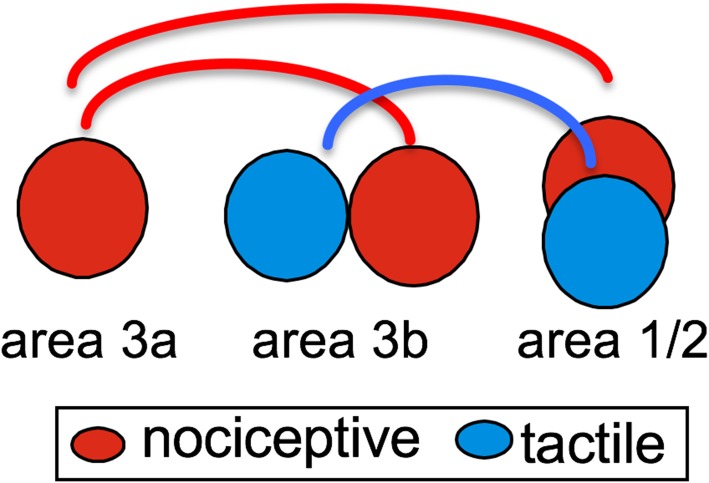
Human functional MRI studies in acute and various chronic pain conditions have revolutionized how we view pain, and have led to a new theory that complex multi-dimensional pain experience (sensory-discriminative, affective/motivational, and cognitive) is represented by concurrent activity in widely-distributed brain regions (termed a network or pain matrix). Despite these breakthrough discoveries, the specific functions proposed for these regions remain elusive, because detailed electrophysiological characterizations of these regions in the primate brain are lacking. To fill in this knowledge gap, we have studied the cortical areas around the central and lateral sulci of the non-human primate brain with combined submillimeter resolution functional imaging (optical imaging and fMRI) and intracranial electrophysiological recording. In this mini-review, I summarize and present data showing that the cortical circuitry engaged in nociceptive processing is much more complex than previously recognized. Electrophysiological evidence supports the engagement of a distinct nociceptive-processing network within SI (i.e., areas 3a, 3b, 1 and 2), SII, and other areas along the lateral sulcus. Deafferentation caused by spinal cord injury profoundly alters the relationships between fMRI and electrophysiological signals. This finding has significant implications for using fMRI to study chronic pain conditions involving deafferentation in humans.

Keywords: Cortex; Functional MRI; Functional connectivity; Nociception; Non-human primate.


Figures

Fig. 1
Fig. 1
Comparison of nociceptive-heat and tactile fMRI activations within SI cortex in two representative monkeys. A, E Color-coded activation probability maps illustrate the frequency of detected activations (in each run) in response to 47.5 °C nociceptive-heat stimulation of digits within each imaging session. Activation in each run was thresholded at P < 0.0001 (uncorrected). B, F Composite digit tactile activation maps in the same animals. Letters indicate the stimulated digits associated with the activation. C, G Digit representation maps as determined electrophysiologically by microelectrode mapping. Receptive field properties of neurons at each penetration (colored dots) are color-coded for different digits. Dotted lines indicate the estimated inter-areal borders. D, H Overlays of nociceptive heat and tactile fMRI activation patterns and electrophysiological maps in each animal. Color-coded scale bars indicate the number of activated runs of the total of scanned runs (far right). a anterior, p posterior, m middle, l lateral. Scale bars 1 mm. Modified from Chen LM, et al., Pain 2011 [23].
Fig. 2
Fig. 2
fMRI activation in lateral sulcus areas of SII, posterior insula (pIns), area 7b (ar-7b), and retro-insula (Ri) in response to nociceptive-heat stimulation (left column) and corresponding VGlut2-stained tissue sections. Modified from Chen LM, et al., Pain 2012 [33].
Fig. 3
Fig. 3
Resting-state fMRI connectivity within SI cortex of squirrel monkeys. One case is shown in AB and DF, and population data in C and GI. A Electrophysiological map of digit region. Colored dots see legend, digits 1–4, palm. Dotted lines estimated borders between areas 3a, 3b, and 1, and between hand/face. White arrows central and lateral sulci. Blue boxes areas 3a, 3b, and 3b face seed regions. White arrowheads vessel markers used for alignment with image in F (pink arrowheads). B BOLD activation in response to vibrotactile stimulation of D2 tip. Activated voxels occur in areas 3a, 3b, and 1. Correlation maps were thresholded at r > 0.7 with a peak correlation value of 0.9. C Box plot of correlation coefficient values between areas 3b and 1 (3b–ar1), 3b and 3a (3b–3a), and 3a and 1 (3a–ar1), with control locations (3b–cntr, 1–cntr, and 3a–cntr). D–F BOLD correlation maps in the resting state. Seed voxels (solid blue boxes in D and E) were placed in the digit regions in areas 3b (C), 3a (D), and the face regions in 3b (F) for voxel-wise correlation analysis. G–I Cross-animal (or population) correlation maps of seeds in areas 3b (G), 3a (H), and face (I) regions. Correlations are a summary of 18 runs (i.e., each map is based on 18 seeds, seeds overlay D2, D3, or D4 digit tip) conducted in 10 animals. To average across animals, seed voxels were used to align all the cross-animal images. Correlation maps are centered on the seed region. Because the seed location is relative to the imaging field of the view across animals, there are some deviations in spatial location between the average correlation map and individual cases. Adapted from Wang Z, Chen LM, et al., Neuron 2013 [57].
Fig. 4
Fig. 4
Proposed inter-areal circuitry within SI cortex.
Fig. 5
Fig. 5
Schematic summary of inter-regional relationships among pain networks of squirrel monkeys. A, B Nociceptive processing regions on a flattened view of the entire neocortex (A), and on a lateral view of the intact monkey brain (B). Modified from Kaskan PM, et al., Front Neurosci 2007 with permission [66]. S1 the primary somatosensory cortex, S2 the secondary somatosensory cortex, 7b Brodmann area 7b, pIns posterior insula cortex, Ri retro-insula, PCC posterior cingulate cortex, ACC anterior cingulate cortex.
Fig. 6
Fig. 6
Comparisons of fMRI, optical imaging, and electrophysiological maps of digit activation in contralateral and ipsilateral areas 3b and 1 in one monkey after a dorsal column lesion. A Overlay of pre-lesion fMRI and post-lesion electrophysiological maps of digits. Colored outlines location and size of fMRI activations; colored patches location and size of neuronal responses. B Spatial comparison of post-lesion fMRI and post-lesion electrophysiological digit maps. C Spatial comparison of post-lesion optical imaging (OI) and post-lesion electrophysiological digit maps. D Overlay of optical imaging and electrophysiological maps of digits D1–D4 in the ipsilateral areas 3b and 1 of the same animal. CS central sulcus. Dotted black lines estimated inter-areal borders. Scale bars 1 mm. a anterior, p posterior, l lateral, m medial. Modified from Chen LM, et al. J Neurosci 2012 [68].
Fig. 7
Fig. 7
Group quantification of spiking (A) and LFP (B) responses in area 3b as a function of stimulus frequency, and summary of percentage of spike-LFP dissociation in control and input-deprived deafferented cases (C). A The mean response efficacy (RE, solid lines) to different stimulus frequencies declined progressively in deafferented area 3b (red), and was significantly lower than in normal cases (blue) (*P < 0.05, except for 2-Hz stimulus). The firing rates in normal cortex were also significantly higher than in deafferented cortex. B The mean power of evoked LFPs in area 3b also decreased with increasing stimulus frequency. The LFP signal was persistently and robustly modulated by tactile stimulation under all conditions, and there was no difference between signals in normal versus deafferented cortex (*P > 0.05). C Summary of spike-LFP dissociation as a function of stimulus frequency in area 3b of normal and input-deprived subjects. With increasing stimulation frequency, the LFP response was more often dissociated from spiking activity in the input-deprived cases (*P < 0.05). Modified from Wang Z, et al., Exp Neurol 2013 [69].

Similar articles

Cited by

References

    1. Bushnell MC, Duncan GH, Hofbauer RK, Ha B, Chen JI, Carrier B. Pain perception: is there a role for primary somatosensory cortex? Proc Natl Acad Sci U S A. 1999;96:7705–7709. doi: 10.1073/pnas.96.14.7705. - DOI - PMC - PubMed
    1. Chen LM, Friedman RM, Roe AW. Area-specific representation of mechanical nociceptive stimuli within SI cortex of squirrel monkeys. Pain. 2009;141:258–268. doi: 10.1016/j.pain.2008.11.018. - DOI - PMC - PubMed
    1. Overduin SA, Servos P. Distributed digit somatotopy in primary somatosensory cortex. Neuroimage. 2004;23:462–472. doi: 10.1016/j.neuroimage.2004.06.024. - DOI - PubMed
    1. Ploner M, Schmitz F, Freund HJ, Schnitzler A. Differential organization of touch and pain in human primary somatosensory cortex. J Neurophysiol. 2000;83:1770–1776. doi: 10.1152/jn.2000.83.3.1770. - DOI - PubMed
    1. Brooks JC, Zambreanu L, Godinez A, Craig AD, Tracey I. Somatotopic organisation of the human insula to painful heat studied with high resolution functional imaging. Neuroimage. 2005;27:201–209. doi: 10.1016/j.neuroimage.2005.03.041. - DOI - PubMed