Case Reports
. 2018 Apr;55(4):3033-3048.
doi: 10.1007/s12035-017-0506-6. Epub 2017 May 2.

iPS Cell Cultures from a Gerstmann-Sträussler-Scheinker Patient with the Y218N PRNP Mutation Recapitulate tau Pathology

Affiliations
Case Reports

iPS Cell Cultures from a Gerstmann-Sträussler-Scheinker Patient with the Y218N PRNP Mutation Recapitulate tau Pathology

Andreu Matamoros-Angles et al. Mol Neurobiol. 2018 Apr.

Abstract

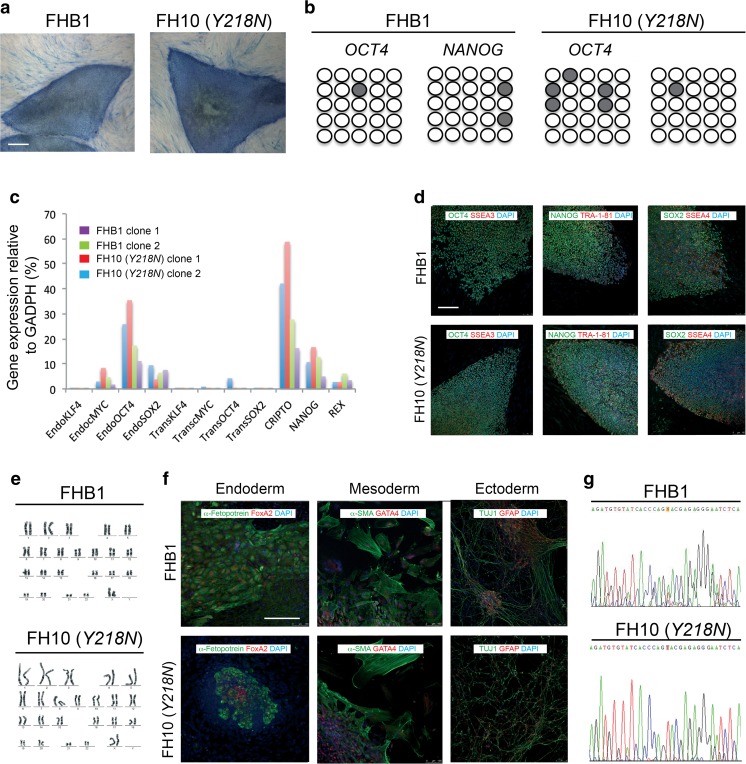
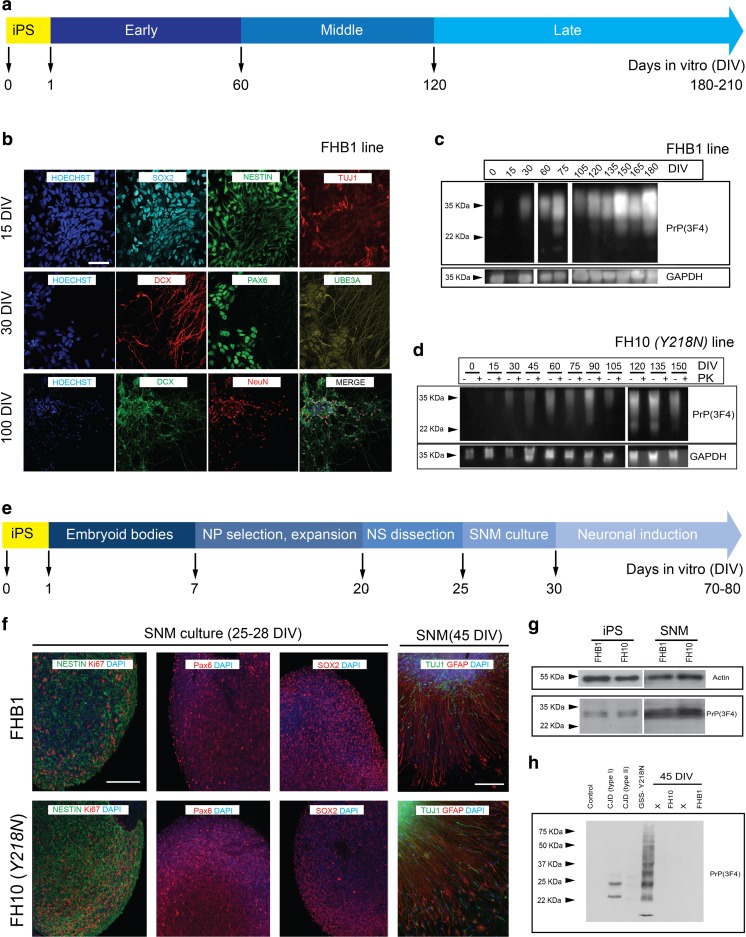
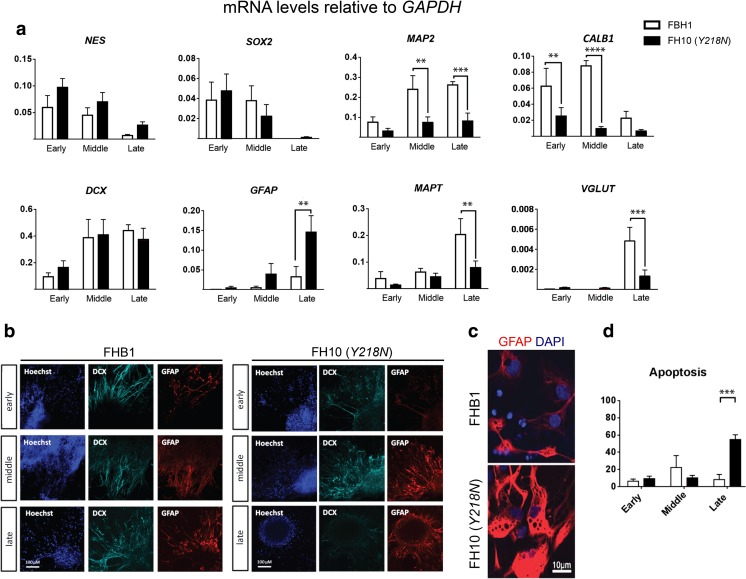
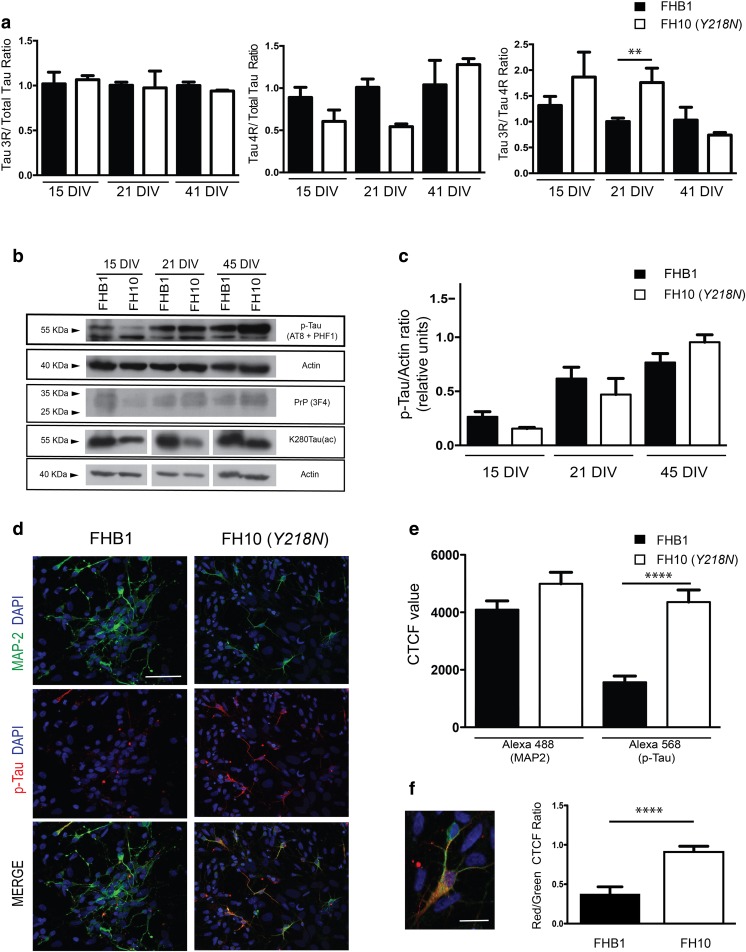
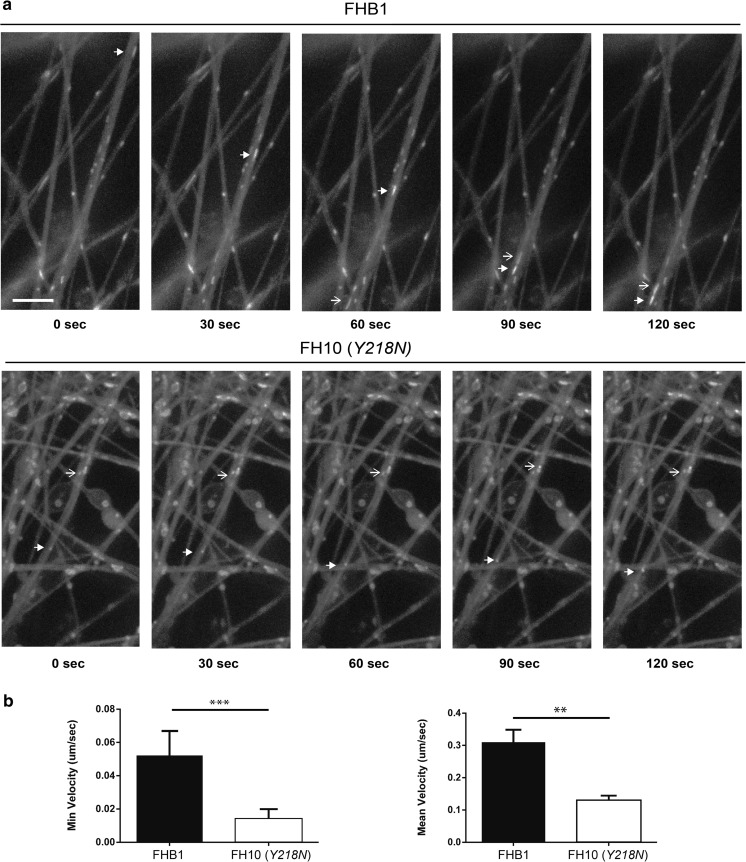
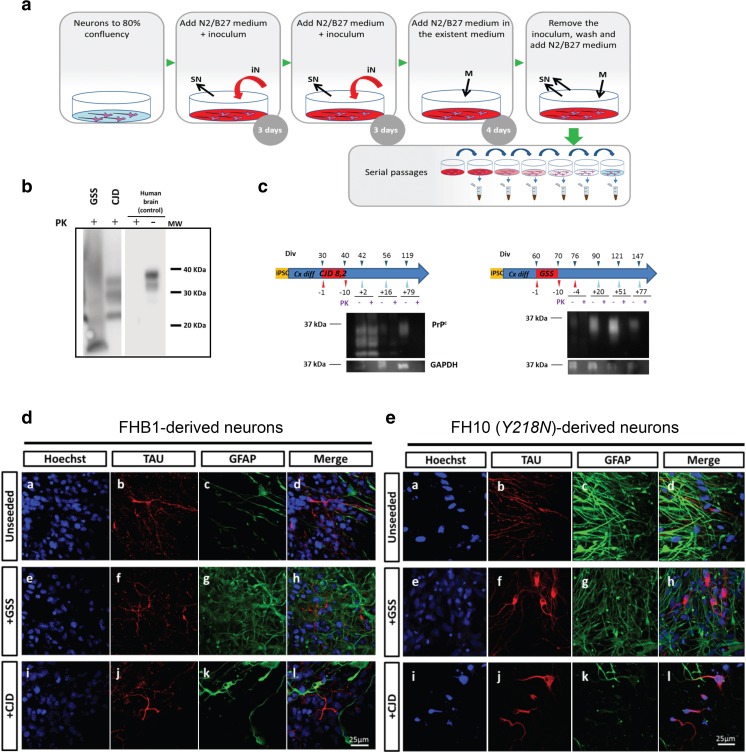
Gerstmann-Sträussler-Scheinker (GSS) syndrome is a fatal autosomal dominant neurodegenerative prionopathy clinically characterized by ataxia, spastic paraparesis, extrapyramidal signs and dementia. In some GSS familiar cases carrying point mutations in the PRNP gene, patients also showed comorbid tauopathy leading to mixed pathologies. In this study we developed an induced pluripotent stem (iPS) cell model derived from fibroblasts of a GSS patient harboring the Y218N PRNP mutation, as well as an age-matched healthy control. This particular PRNP mutation is unique with very few described cases. One of the cases presented neurofibrillary degeneration with relevant Tau hyperphosphorylation. Y218N iPS-derived cultures showed relevant astrogliosis, increased phospho-Tau, altered microtubule-associated transport and cell death. However, they failed to generate proteinase K-resistant prion. In this study we set out to test, for the first time, whether iPS cell-derived neurons could be used to investigate the appearance of disease-related phenotypes (i.e, tauopathy) identified in the GSS patient.

Keywords: Cellular prion protein; Gerstmann-Sträussler-Scheinker; Induced pluripotent stem cells; Tau.


Figures

Fig. 1
Fig. 1
Generation and characterization of iPS cells. (a) Control (cell line FHB1) and GSS-Y218N-iPS cell (cell line FH10) stained for AP activity. (b) Bisulphite genomic sequencing of the OCT4 and NANOG promoters showing demethylation in FHB1 and FH10 (Y218N) cell lines. (c) RT-qPCR analyses of the expression levels of retroviral-derived reprogramming factors (transgenic) and endogenous expression levels (endogenous) of the indicated genes in FHB1 (two clones) and Y218N-iPS cells (cell line FH10, 2 clones). (d) Low fluorescence photomicrographs of representative colonies of FHB1 and FH10 (Y218N) stained positive for the pluripotency-associated markers OCT4, NANOG and SOX2 (green), SSEA3, TRA-1-81 and SSEA4 (red). (e) Normal karyotypes of FHB1 and FH10 (Y218N) at passage 20. (f) Immunofluorescence analyses of FHB1 and FH10 (Y218N) iPS cells differentiated in vitro show the potential to generate cell derivatives of all three primary germ cell layers including ectoderm (stained for TUJ1, green), endoderm (stained for α-fetoprotein, green, and FOXA2, red) and mesoderm (stained for smooth muscle actin, SMA, red). (g) Direct sequence of genomic DNA from Control (cell line FHB1) and GSS patient (FH10 (Y218N)) identifying the PRNP Y218N mutation. Scale bars in a, d and f = 50 μm
Fig. 2
Fig. 2
Neural differentiation of FHB1 and FH10 ( Y218N ) iPS cells. IPS cells from control (FHB1) and Y218N (FH10) GSS patient were differentiated using two procedures (a and e) (see Methods for details). (b) Low power photomicrographs of representative colonies of FHB1 and FH10 (Y218N) stained positive for SOX2, Nestin, DCX, TUJ1, PAX6, UBE3A antigens at different stages of maturation. (c) Western blot characterization of PrPC expression in differentiating iPS cell cultures. (d) Example of the Western blot experiments illustrating the absence of PK-resistant PrPC in FH10 (Y218N) cultures. (e) Low power photomicrographs of representative colonies of FHB1 and FH10 (Y218N) stained positive for Nestin, Ki67, SOX2, TUJ1, PAX6 and GFAP antigens. (g) Western blot characterization of PrPC expression in iPS cells (passage 20) and SNMs (passage 3). (h) Western blots illustrating the absence of PK-resistant prion in FHB1 and FH10 (Y218N) in brain extracts from the GSS patient and two CJD (Type I and II) samples. Scale bars in b and f = 50 μm
Fig. 3
Fig. 3
Transcriptional profile of maturating iPS cell cultures. (a) Quantitative RT-PCR transcriptional profile of control and mutant cell cultures at the three maturation stages. Bars represent the mean ± S.E.M. of 2–4 time points for each stage from at least 2 independent differentiations. Data are presented as mean ± standard error of the mean (S.E.M.). Differences between groups were considered statistically significant **** P < 0.001, *** P < 0.01 and ** P < 0.05. Bonferroni post hoc test. (b) Representative immunofluorescence microphotographs of PrPC, DCX and GFAP expression at the three differentiation stages. (c) Higher power image of GFAP positive cells at mid differentiation stage. (d). Quantification of apoptotic nuclei (% over total Hoechst). *** P < 0.01, Bonferroni post hoc test. Scale bars in b = 100 μm and c = 10 μm
Fig. 4
Fig. 4
Delayed MAPT maturation and increased p-Tau in Y218N -derived neurons. (a) Histograms illustrating RT-qPCR results (mean ± S.E.M.) of Tau 3R/Total tau; Tau 4R/Total and Tau 3R/4R ratios in FHB1 and FH10 (Y218N) iPS cell cultures during differentiation at 15, 21 and 41 days in vitro. Asterisks in the right graph indicate P < 0.05, Bonferroni post hoc test; Mean Diff. -0.756; 95% confidence interval = −1.372 to - 0.1415). (b) Time course of p-Tau, PrPC and K280Tau-(ac) expression in FHB1 and FH10 (Y218N) at 15, 21 and 45 DIV. Actin was used as control loading protein. (c) Graph of the densitometric values of p-Tau levels of (b). Plots show mean ± S.E.M. of three different experiments. Note the increase in p-Tau between Y218N and control cells. (d) High power photomicrographs illustrating MAP2 (green), p-Tau (red) in FHB1 and FH10 (Y218N) neural cultures. A high magnification of a labelled cell is showed in (f). (e-f) Quantification of CTCF values derived from experiments in (d). Plots show mean ± S.E.M. of four different experiments. Asterisks in (e) indicate statistical differences between groups and controls. **** P < 0.001; Mann-Whitney U test. Scale bars in d = 50 μm and f = 10 μm
Fig. 5
Fig. 5
FH10 (Y218N) cultures showed impaired mitochondria displacement. (a) Time-lapse fluorescence photomicrographs illustrating mitochondria movement in FHB1- (upper panels) and FH10 (Y218N)- (lower panels) derived neurons. The movement of two mitochondria (arrow and open arrow in (a) can be seen in the time lapse panels. (b) Plots illustrating the Minimum and Mean velocity values of tracked mitochondria in both types of cultures (see Methods for details). Notice the strong decreases in velocity in FH10 (Y218N)-derived cultures. Plots show mean ± S.E.M. of three different differentiation experiments. ***P < 0.01, ** P < 0.05. Mann Whitney U test. Scale bar: a = 2.5 μm
Fig. 6
Fig. 6
Infectivity assay with brain inoculates. (a) Schematic representation of the inoculation protocol: infective brain homogenates were added at day 0 and day 3 and removed at day 10; cells were subsequently passaged several times to remove the inocula. (b) Inocula from the sources (10% of brain homogenates, see Methods for details) were processed to show PK-resistant PrP signal. GSS: human brain diagnosed of Y218N. CJD: human brain diagnosed of a sporadic CJD MM1. CJD samples were digested with 10–50 μg/ml of proteinase K (PK) and subjected to a standard biochemical analysis. GSS sample was treated as an atypical prion sample (see Methods). The samples were analyzed using the monoclonal antibody 3F4. MW: Molecular marker. (c) Representative examples of Western blot detection of PK-resistant PrP forms following inoculation with CJD and GSS brain samples. Note that PK-resistant PrP was only detected (when present) for the first 2 weeks after the infection. (d) Morphological analyses 2 months later revealed little effect of these inoculates in control neurons while mutant Y218N cultures (e) showed fewer neurons with marked cytoplasmic redistribution of Tau signal (b, f, j) and enhanced immunoreactivity for GFAP. Scale bars: 25 μm

References

    1. Ironside JW. Prion diseases in man. J Pathol. 1998;186(3):227–234. doi: 10.1002/(SICI)1096-9896(1998110)186:3<227::AID-PATH174>3.0.CO;2-3. - DOI - PubMed
    1. Schmidt C, Haik S, Satoh K, Rabano A, Martinez-Martin P, Roeber S, Brandel JP, Calero-Lara M, de Pedro-Cuesta J, Laplanche JL, Hauw JJ, Kretzschmar H, Zerr I. Rapidly progressive Alzheimer's disease: A multicenter update. J Alzheimers Dis. 2012;30(4):751–756. - PubMed
    1. Hodges JR, Davies R, Xuereb J, Kril J, Halliday G. Survival in frontotemporal dementia. Neurology. 2003;61(3):349–354. doi: 10.1212/01.WNL.0000078928.20107.52. - DOI - PubMed
    1. Roberson ED, Hesse JH, Rose KD, Slama H, Johnson JK, Yaffe K, Forman MS, Miller CA, Trojanowski JQ, Kramer JH, Miller BL. Frontotemporal dementia progresses to death faster than Alzheimer disease. Neurology. 2005;65(5):719–725. doi: 10.1212/01.wnl.0000173837.82820.9f. - DOI - PubMed
    1. Greenfield JG, Graham DI, Lantos PL. Greenfield's neuropathology. 7. New York: Arnold, London; 2002.

Publication types

MeSH terms