Comparative Study
. 2017 May 3:8:14811.
doi: 10.1038/ncomms14811.

The comparative immunology of wild and laboratory mice, Mus musculus domesticus

Affiliations
Comparative Study

The comparative immunology of wild and laboratory mice, Mus musculus domesticus

Stephen Abolins et al. Nat Commun. .

Abstract

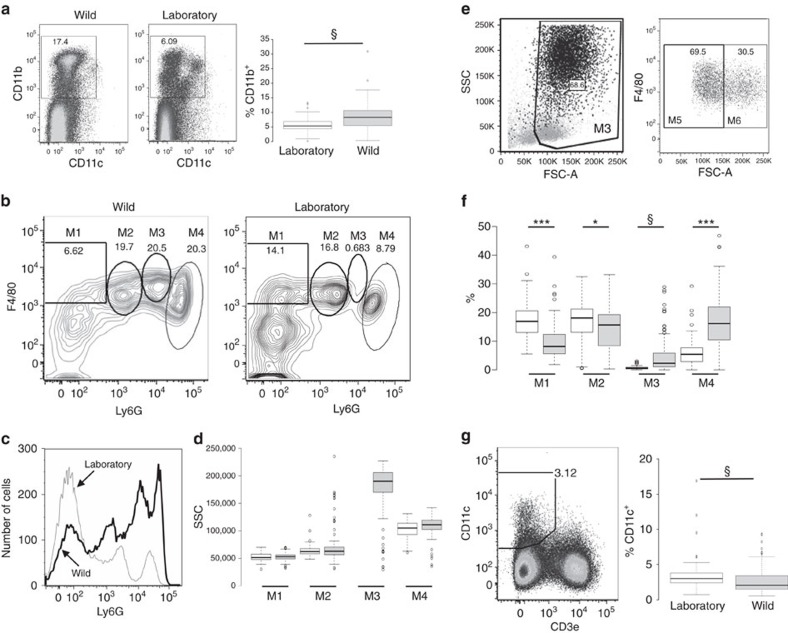
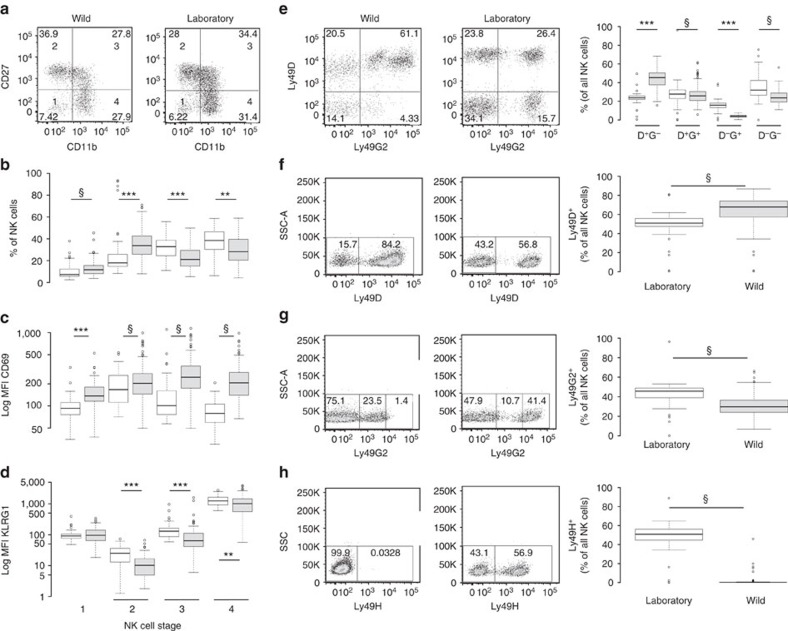
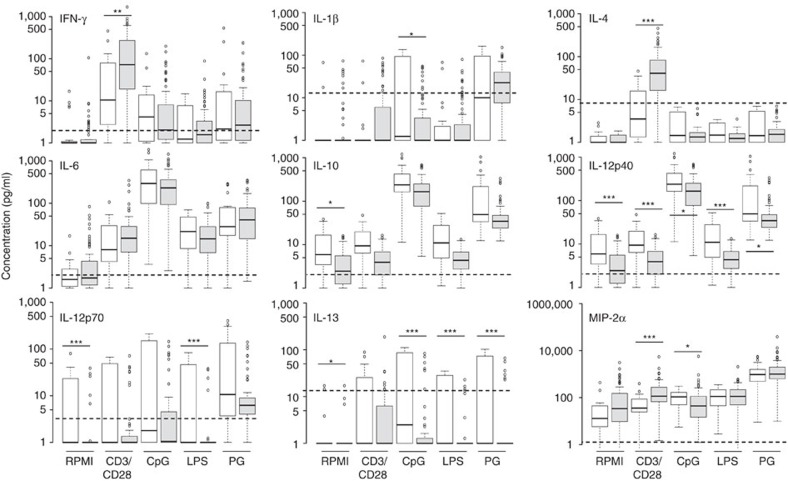
The laboratory mouse is the workhorse of immunology, used as a model of mammalian immune function, but how well immune responses of laboratory mice reflect those of free-living animals is unknown. Here we comprehensively characterize serological, cellular and functional immune parameters of wild mice and compare them with laboratory mice, finding that wild mouse cellular immune systems are, comparatively, in a highly activated (primed) state. Associations between immune parameters and infection suggest that high level pathogen exposure drives this activation. Moreover, wild mice have a population of highly activated myeloid cells not present in laboratory mice. By contrast, in vitro cytokine responses to pathogen-associated ligands are generally lower in cells from wild mice, probably reflecting the importance of maintaining immune homeostasis in the face of intense antigenic challenge in the wild. These data provide a comprehensive basis for validating (or not) laboratory mice as a useful and relevant immunological model system.


Conflict of interest statement

The authors declare no competing financial interests.

Figures

Figure 1
Figure 1. Wild mice sampled for immune characterization.
(a) The wild mouse sampling sites, the site codes (and showing Bristol, Stroud and London; Supplementary Table 1) and the number of mice sampled at each site. (b) A neighbour-joining tree of the wild mice (HW) (●) and laboratory strains of mice (○). The scale is the number of nucleotide differences among individuals. Bootstrapping values are displayed for branches that have >80% support after 1,000 runs. L88 and L90 are two C57BL/6 mice that we genotyped (Supplementary Data 3) and compared to published data for this strain.
Figure 2
Figure 2. Immunoglobulins and serum proteins.
Immunoglobulin G, E and A, and SAP, haptoglobin, and AAT serum proteins concentrations of wild (shaded) and laboratory (unshaded) mice are shown on a log10 scale. The box centres are medians, and box limits the 25th and 75th percentiles, the whiskers 1.5 times the interquartile range, and outliers are represented by dots. Asterisks denote significant differences as ***P<0.001 (Mann–Whitney U test; Table 1), and § denotes that there are additional sex effects detailed in Table 1. Sample sizes are shown in Table 1 and Supplementary Data 1.
Figure 3
Figure 3. Splenic T-cell populations.
The flow cytometry gating strategy and proportions of subsets of CD3+ T cells in wild (shaded) and laboratory (unshaded) mice for (a) CD4+ cells, (b) CD4+ Treg cells, (c) CD8+ cells and their maturation state and (d) terminally differentiated CD8+ cells. CD4+ and CD8+ effector/effector memory cells are defined as CD62L CD44hi and central memory cells are CD62L+ CD44hi. The box centres are medians, and box limits the 25th and 75th percentiles, the whiskers 1.5 times the interquartile range and outliers are represented by dots. Asterisks denote significant differences as *P<0.05, **P<0.01, ***P<0.001 (Mann–Whitney U test; Supplementary Table 2), and § denotes that there are additional sex effects detailed in Supplementary Table 2. The gating strategy for CD3+ lymphocytes is shown in Supplementary Fig. 1. Sample sizes are shown in Supplementary Table 2 and Supplementary Data 1.
Figure 4
Figure 4. Splenic B-cell populations.
(a) The flow cytometry gating strategy to characterize CD19+ B cells as either naïve (N), memory (M) or germinal centre (G) B cells in wild and laboratory mice, and (b) the proportions of these three subpopulations, (c) their expression of MHC class II and (d) binding of PNA, with the latter shown on a log10 scale. Mice are wild (shaded) and laboratory (unshaded). The box centres are medians, and box limits the 25th and 75th percentiles, the whiskers 1.5 times the interquartile range and outliers are represented by dots. Asterisks denote significant differences as **P<0.01, ***P<0.001 (Mann–Whitney U test; Supplementary Table 2), and § denotes that there are additional sex effects detailed in Supplementary Table 2. Sample sizes are shown in Supplementary Table 2 and Supplementary Data 1. The gating strategy for CD19+ lymphocytes is shown in Supplementary Fig. 1.
Figure 5
Figure 5. Myeloid cells.
(a) The flow cytometry gating strategy to identify CD11b+ CD11c myeloid cells and the proportion of myeloid cells among splenic leukocytes in wild (shaded) and laboratory (unshaded) mice, (b) gating myeloid cells on F4/80 and Ly6G expression to define M1 (tissue resident macrophages), M2 (monocytes), M3 (hypergranulocytic myeloid cells, HGMC) and M4 (polymorphonuclear leukocytes, PMN) subsets, (c) Ly6G expression confirming the presence of three cell populations in laboratory mice and four populations in wild mice, (d) side scatter characteristics of the M1–M4 populations in wild (shaded, n≥115) and laboratory (unshaded n≥57) mice; note that too few cells were present in the M3 gate in laboratory mice to accurately determine a side scatter statistic, (e) scatter characteristics of M3 (left) and M4 (right) cells, revealing a low forward scatter neutrophil population (M5) and a high forward scatter myeloid derived suppressor cell population (M6) among the M4 cells, (f) proportions of M1, M2, M3 and M4 subpopulations among the myeloid cell population in wild (shaded) and laboratory (unshaded) mice, and (g) gating of CD11c+ dendritic cells and their proportions among splenocytes in wild and laboratory mice. For the box plots, box centres are medians, and box limits the 25th and 75th percentiles, the whiskers 1.5 times the interquartile range and outliers are represented by dots. Asterisks denote significant differences as *P<0.05, ***P<0.001 (Mann–Whitney U test; Supplementary Table 2), and § denotes that there are additional sex effects detailed in Supplementary Table 2. Sample sizes are shown in Supplementary Table 2 and Supplementary Data 1.
Figure 6
Figure 6. Splenic NK cells and Ly49 expression.
(a) The flow cytometry gating strategy using expression of CD27 and CD11b to classify NKp46+ CD3 splenic NK cells of wild and laboratory mice into stages 1–4 of maturity, (b) the proportions of NK cells at each such stage, in wild (shaded) and laboratory (unshaded) mice, and expression of (c) CD69 and (d) KLRG1 by each subset (Table 2). Also shown are (eh) the gating strategies for Ly49 receptors and the proportions of NK cells expressing, (e) different combinations of Ly49D and Ly49G2, (f) Ly49D, (g) Ly49G2 (Ly49G2+ cells gated into Ly49G2, Ly49G2low and Ly49G2high cells) and (h) Ly49H. Wild mice are shown as shaded box plots, laboratory mice as unshaded. The box centres are medians, and box limits the 25th and 75th percentiles, the whiskers 1.5 times the interquartile range and outliers are represented by dots and some axes are on a log10 scale. Asterisks denote significant differences as **P<0.01, ***P<0.001 (Mann–Whitney U test; Table 2), and § denotes that there are additional sex effects detailed in Table 2. The gating strategy for NKp46+ CD3 lymphocytes is shown in Supplementary Fig. 1. Sample sizes are shown in Table 2 and Supplementary Data 1.
Figure 7
Figure 7. Cytokine production by splenocytes after in vitro stimulation.
The concentrations of nine cytokines (IFN-γ, IL-1β, IL-4, IL-6, IL-10, IL-12p40, IL-12p70, IL-13, MIP-2α) produced by splenic lymphocytes stimulated with anti-CD3/anti-CD28, CpG, LPS or PG compared with the RPMI control in wild (shaded) and laboratory (unshaded) mice, shown on a log10 scale. The box centres are medians, and box limits the 25th and 75th percentiles, the whiskers 1.5 times the interquartile range, and outliers are represented by dots. The dotted horizontal lines show the median lower limit of quantification defined from standard curves across all analysed plates for each cytokine. Asterisks denote significant differences as *P<0.05, **P<0.01, ***P<0.001 (Mann–Whitney U test; Supplementary Table 5). Sample sizes are shown in Supplementary Data 1 and Supplementary Table 5.

References

    1. Roberts A., Pardo-Manuel de Villena F., Wang W., McMillan L. & Threadgill D. W. The polymorphism architecture of mouse genetic resources elucidated using genome-wide resequencing data: implications for QTL discovery and systems genetics. Mamm. Genome. 18, 473–481 (2007). - PMC - PubMed
    1. Yang H., Bell T. A., Churchill G. A. & Pardo-Manuel de Villena F. On the subspecific origin of the laboratory mouse. Nat. Genet. 39, 1100–1107 (2007). - PubMed
    1. Yang H. et al.. Subspecific origin and haplotype diversity in the laboratory mouse. Nat. Genet. 43, 648–655 (2011). - PMC - PubMed
    1. Wade C. M. et al.. The mosaic structure of variation in the laboratory mouse genome. Nature 420, 574–578 (2002). - PubMed
    1. Sellers R. S., Clifford C. B., Treuting P. M. & Brayton C. Immunological variation between inbred laboratory mouse strains: points to consider in phenotyping genetically immunomodified mice. Vet. Pathol. 49, 32–43 (2012). - PubMed

Publication types

MeSH terms

LinkOut - more resources