. 2017 May 3:8:15115.
doi: 10.1038/ncomms15115.

Pointwise error estimates in localization microscopy

Affiliations

Pointwise error estimates in localization microscopy

Martin Lindén et al. Nat Commun. .

Abstract

Pointwise localization of individual fluorophores is a critical step in super-resolution localization microscopy and single particle tracking. Although the methods are limited by the localization errors of individual fluorophores, the pointwise localization precision has so far been estimated using theoretical best case approximations that disregard, for example, motion blur, defocus effects and variations in fluorescence intensity. Here, we show that pointwise localization precision can be accurately estimated directly from imaging data using the Bayesian posterior density constrained by simple microscope properties. We further demonstrate that the estimated localization precision can be used to improve downstream quantitative analysis, such as estimation of diffusion constants and detection of changes in molecular motion patterns. Finally, the quality of actual point localizations in live cell super-resolution microscopy can be improved beyond the information theoretic lower bound for localization errors in individual images, by modelling the movement of fluorophores and accounting for their pointwise localization uncertainty.


Conflict of interest statement

The authors declare no competing financial interests.

Figures

Figure 1
Figure 1. Factors that influence localization precision.
Simulated images of a diffusing fluorophore with diffusion constant 1 μm2 s−1, 1 photon per pixel background, EMCCD noise and varying localization uncertainty due to varying (a) spot amplitude N, (b,c) average defocus z and exposure time tE. Image size 20-by-20 pixels, pixel size 80 nm, colorbar indicates photons per pixel.
Figure 2
Figure 2. True and estimated precision at short exposure times.
(a) True and estimated RMSEs for MLE localizations in different imaging conditions. Precisions are estimated using the CRLB and Laplace estimators, and error bars (mostly smaller than the symbols) indicate bootstrap s.e.m. Dashed and dotted lines indicate 0% and ±10% bias, respectively. (b) Conditional RMSE (cRMSE) normalized by estimated RMSE. Symbols, boxes and lines show the median, 25% and 75% quantiles, and the whole span for all localization conditions. (c) Distribution (probability density function, pdf) of fitted spot widths σ for the MLE and MAP fits, and spot width prior. The theoretical minimum width σ0 is indicated by a vertical line. (d,e) Same as in a,b, but for MAP localizations. (f) Probability plots of localization errors normalized by Laplace RMSE estimates for MLE and MAP fits. Only spots with estimated RMSE smaller than 3 pixels are included, and a standard normal distribution, N(0,1), is included as reference.
Figure 3
Figure 3. True and estimated precision at longer exposure times.
Results for 0.6<formula image
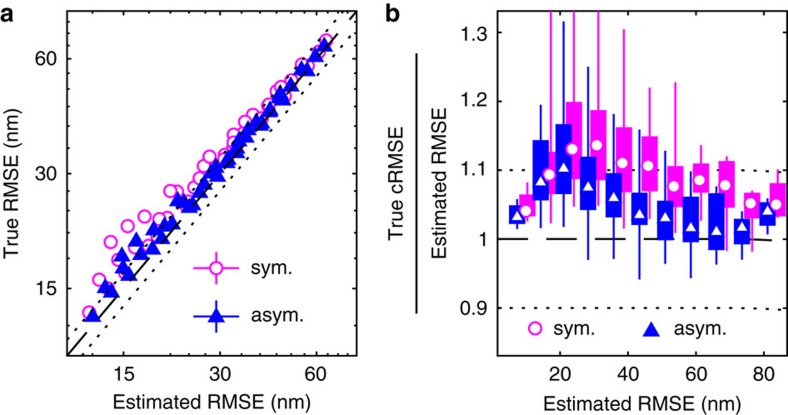
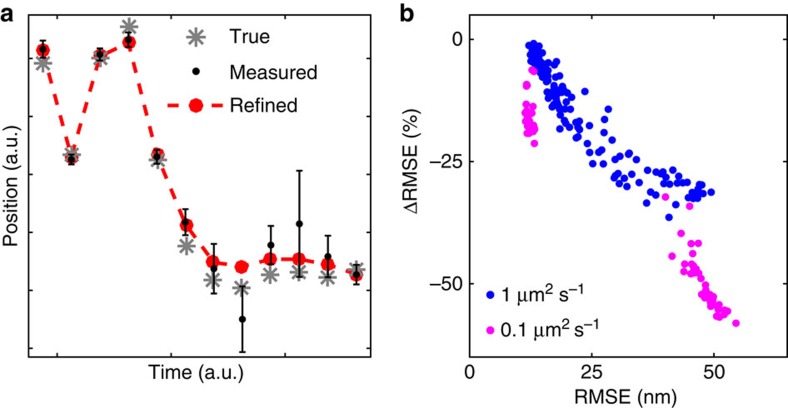
<0.9, using symmetric and asymmetric Gaussian spot models for MAP localization and Laplace precision estimates. Dashed and dotted lines indicate 0% and ±10% bias, respectively. (a) True and estimated RMSEs for each imaging condition with error bars (mostly smaller than symbols) showing bootstrap s.e.m. (b) Conditional RMSE (cRMSE) normalized by estimated RMSE. Symbols, boxes, and lines show the median, 25% and 75% quantiles, and the whole span for all localization conditions.
Figure 4
Figure 4. Validating estimators of localization precision using real data.
(a) Intensity in different frames for two different beads (red, blue) and the background (black). Grey areas indicate periods of strong excitation intensity. (bd) Image examples, 9-by-9 pixels, 80 nm per pixel, colorbar indicates photons per pixel. (b) Background in high intensity frame, and a bead in a (c) high intensity and (d) a low intensity frame. (e) True and estimated RMSEs for individual beads, using MLE localization and CRLB precision estimates, MLE localization and Laplace precision estimates, and MAP localization and Laplace precision estimates. Error bars indicate bootstrap s.e.m. (mostly smaller than the symbols).
Figure 5
Figure 5. Estimating diffusion constants with and without precision estimates.
Mean value and 1% quantiles of covariance-based diffusion constant estimates Dcov. from simulated 10-step trajectories plotted against the signal-to-noise ratio (SNR). The true value is 1 μm2 s−1.
Figure 6
Figure 6. Detecting binding events in and out of focus.
(a) Input z coordinates and RMSEs, and (b) representative spot images along simulated trajectories, from time points indicated by + in a. Grey areas indicate binding events. (c) Average state occupancy for the different HMMs. (d) Distribution of estimated diffusion constants for the two states (probability density function, pdf), with true values indicated by dashed lines. (e) Corrected diffusion constant estimates. (f) Spot images (rendered as in a) and (g) HMM occupancies for trajectories simulated without defocus effects. Spot images are 18-by-18 pixels, with 80 nm pixel size, and the colour bar indicating number of photons per pixel.
Figure 7
Figure 7. Position refinement.
Improved localization precision by modelling particle motion with the Berglund HMM. (a) Illustration of true, measured (±s.d.) and HMM-refined positions. (b) Relative change of RMSE HMM refinement, for every frame in Fig. 6a, coloured according to the true hidden state.

Similar articles

Cited by

References

    1. Sage D. et al.. Quantitative evaluation of software packages for single-molecule localization microscopy. Nat. Methods 12, 717–724 (2015). - PubMed
    1. Thompson R. E., Larson D. R. & Webb W. W. Precise nanometer localization analysis for individual fluorescent probes. Biophys. J. 82, 2775–2783 (2002). - PMC - PubMed
    1. Ober R. J., Ram S. & Ward E. S. Localization accuracy in single-molecule microscopy. Biophys. J. 86, 1185–1200 (2004). - PMC - PubMed
    1. Mortensen K. I., Churchman L. S., Spudich J. A. & Flyvbjerg H. Optimized localization analysis for single-molecule tracking and super-resolution microscopy. Nat. Methods 7, 377–381 (2010). - PMC - PubMed
    1. Rieger B. & Stallinga S. The lateral and axial localization uncertainty in super-resolution light microscopy. ChemPhysChem. 15, 664–670 (2014). - PubMed

Publication types

LinkOut - more resources