

Clinical and genetic predictors of renal dysfunctions in sickle cell anaemia in Cameroon
- PMID: 28466968
- PMCID: PMC5660286
- DOI: 10.1111/bjh.14724
Clinical and genetic predictors of renal dysfunctions in sickle cell anaemia in Cameroon
Abstract
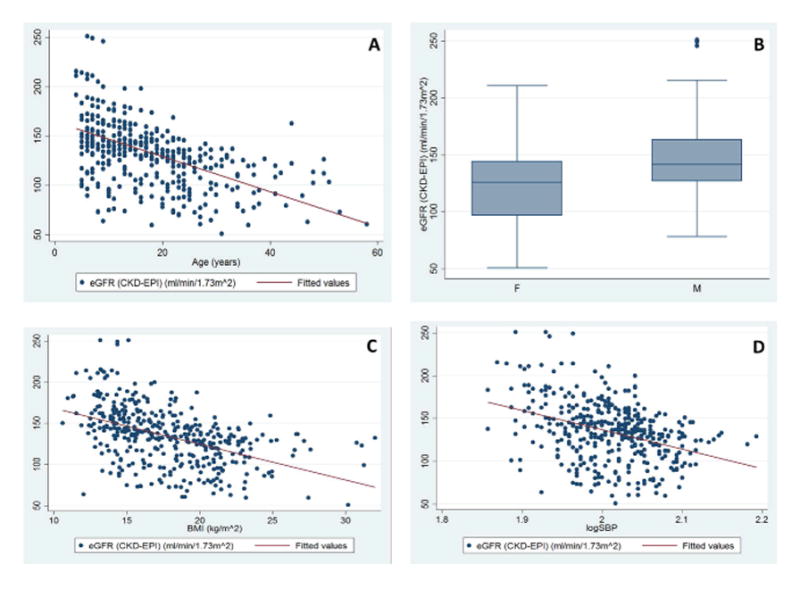
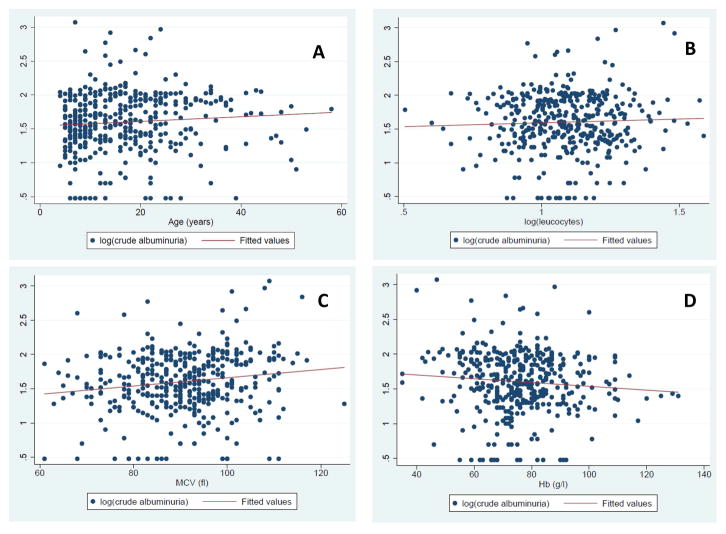
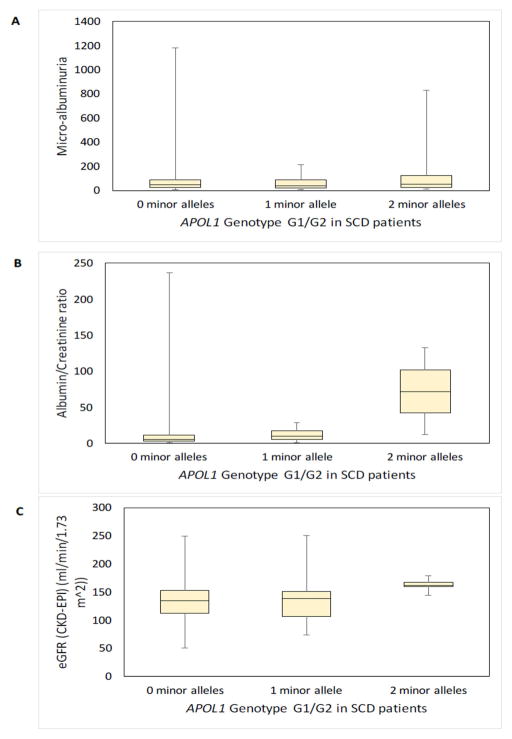
Micro-albuminuria and glomerular hyperfiltration are primary indicators of renal dysfunctions in Sickle Cell Disease (SCD), with more severe manifestations previously associated with variants in APOL1 and HMOX1 among African Americans. We have investigated 413 SCD patients from Cameroon. Anthropometric variables, haematological indices, crude albuminuria, albumin-to-creatinine ratio (ACR) and estimated glomerular filtration rate (eGFR) were measured. Patients were genotyped for 3·7 kb alpha-globin gene (HBA1/HBA2) deletion, and for variants in APOL1 (G1/G2; rs60910145, rs73885319, rs71785313) and HMOX1 (rs3074372, rs743811). The median age was 15 years; the majority presented with micro-albuminuria (60·9%; n = 248), and approximately half with glomerular hyperfiltration (49·5%; n = 200). Age, male sex, haemoglobin level, leucocyte count, mean corpuscular volume, blood pressure, body mass index and creatinine levels significantly affected albuminuria and/or eGFR. Co-inheritance of alpha-thalassaemia was protective against macro-albuminuria (P = 0·03). APOL1 G1/G2 risk variants were significantly associated with the ACR (P = 0·01) and borderline with eGFR (P = 0·07). HMOX1 - rs743811 was borderline associated with micro-albuminuria (P = 0·07) and macro-albuminuria (P = 0·06). The results revealed a high proportion of micro-albuminuria and glomerular hyperfiltration among Cameroonian SCD patients, and support the possible use of targeted genetic biomarkers for risks assessment.
Keywords: APOL1; HMOX1; albuminuria; glomerular filtration rate; sickle cell disease.
© 2017 John Wiley & Sons Ltd.
Conflict of interest statement
The authors report no conflicts of interest. The authors alone are responsible for the content and writing of this article.
Figures
Similar articles
-
Roles of APOL1 G1 and G2 variants in sickle cell disease patients: kidney is the main target.Br J Haematol. 2017 Oct;179(2):323-335. doi: 10.1111/bjh.14842. Epub 2017 Jul 12. Br J Haematol. 2017. PMID: 28699644 Clinical Trial.
-
Clinical and genetic factors are associated with kidney complications in African children with sickle cell anaemia.Br J Haematol. 2022 Jan;196(1):204-214. doi: 10.1111/bjh.17832. Epub 2021 Sep 20. Br J Haematol. 2022. PMID: 34545573
-
Relevance of repeated analyses of albuminuria and glomerular filtration rate in African children with sickle cell anaemia.Br J Haematol. 2024 Sep;205(3):1137-1146. doi: 10.1111/bjh.19603. Epub 2024 Jun 27. Br J Haematol. 2024. PMID: 38934404
-
The nephropathy of sickle cell trait and sickle cell disease.Nat Rev Nephrol. 2022 Jun;18(6):361-377. doi: 10.1038/s41581-022-00540-9. Epub 2022 Feb 21. Nat Rev Nephrol. 2022. PMID: 35190716 Free PMC article. Review.
-
Sickle Cell Disease and CKD: An Update.Am J Nephrol. 2024;55(1):56-71. doi: 10.1159/000534865. Epub 2023 Oct 27. Am J Nephrol. 2024. PMID: 37899028 Free PMC article. Review.
Cited by
-
Biomarkers of sickle cell nephropathy in Senegal.PLoS One. 2022 Nov 21;17(11):e0273745. doi: 10.1371/journal.pone.0273745. eCollection 2022. PLoS One. 2022. PMID: 36409722 Free PMC article.
-
Genetic risk of APOL1 and kidney disease in children and young adults of African ancestry.Curr Opin Pediatr. 2018 Apr;30(2):252-259. doi: 10.1097/MOP.0000000000000603. Curr Opin Pediatr. 2018. PMID: 29406442 Free PMC article. Review.
-
Longitudinal study of glomerular hyperfiltration and normalization of estimated glomerular filtration in adults with sickle cell disease.Br J Haematol. 2021 Oct;195(1):123-132. doi: 10.1111/bjh.17723. Epub 2021 Aug 16. Br J Haematol. 2021. PMID: 34402052 Free PMC article.
-
Sickle Cell Disease.N Engl J Med. 2017 Jul 20;377(3):302-303. doi: 10.1056/NEJMc1706325. N Engl J Med. 2017. PMID: 28723335 Free PMC article. No abstract available.
-
Genetic modifiers of long-term survival in sickle cell anemia.Clin Transl Med. 2020 Aug;10(4):e152. doi: 10.1002/ctm2.152. Clin Transl Med. 2020. PMID: 32898326 Free PMC article.
References
-
- Abo-Zenah H, Moharram M, El Nahas AM. Cardiorenal risk prevalence in sickle cell hemoglobinopathy. Nephron Clinical Practice. 2009;112:c98–c106. - PubMed
-
- Aloni MN, Ngiyulu RM, Nsibu CN, Ekulu PM, Makulo JR, Gini-Ehungu J-L, Nseka NM, Lepira FB. Congolese children with sickle cell trait may exhibit glomerular hyperfiltration: A case control study. Journal of Clinical Laboratory Analysis. 2017:e22143. doi: 10.1002/jcla.22143. (electronic publication ahead of print) - DOI - PMC - PubMed
-
- Alvarez O, Montane B, Lopez G, Wilkinson J, Miller T. Early blood transfusions protect against microalbuminuria in children with sickle cell disease. Pediatric Blood & Cancer. 2006;47:71–76. - PubMed
-
- Arlet JB, Ribeil JA, Chatellier G, Eladari D, De Seigneux S, Souberbielle JC, Friedlander G, de Montalembert M, Pouchot J, Prie D, Courbebaisse M. Determination of the best method to estimate glomerular filtration rate from serum creatinine in adult patients with sickle cell disease: a prospective observational cohort study. BMC Nephrology. 2012;13:83. - PMC - PubMed
Publication types
MeSH terms
Substances
Grants and funding
LinkOut - more resources
Full Text Sources
Other Literature Sources
Medical
Research Materials
Miscellaneous
