. 2017 Jul 4;8(27):43602-43616.
doi: 10.18632/oncotarget.17115.

Sphingosine kinase 2 inhibition synergises with bortezomib to target myeloma by enhancing endoplasmic reticulum stress

Affiliations

Sphingosine kinase 2 inhibition synergises with bortezomib to target myeloma by enhancing endoplasmic reticulum stress

Craig T Wallington-Beddoe et al. Oncotarget. .

Abstract

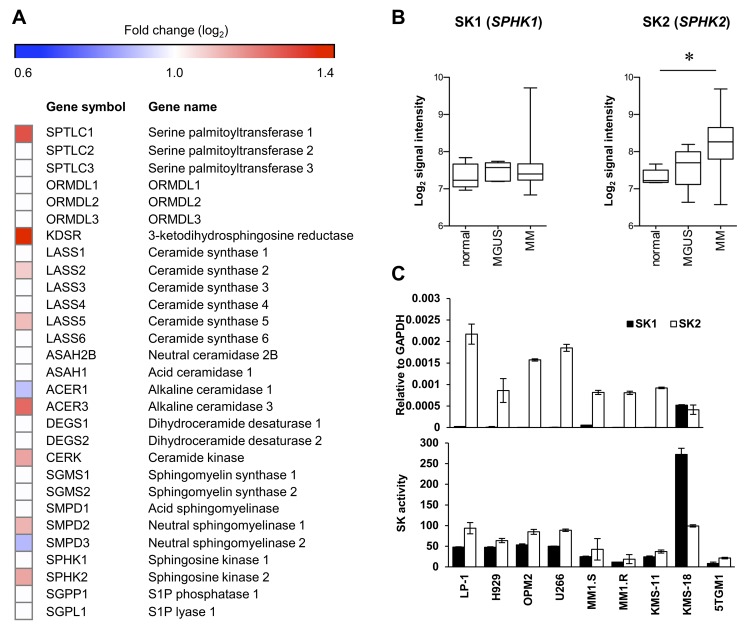
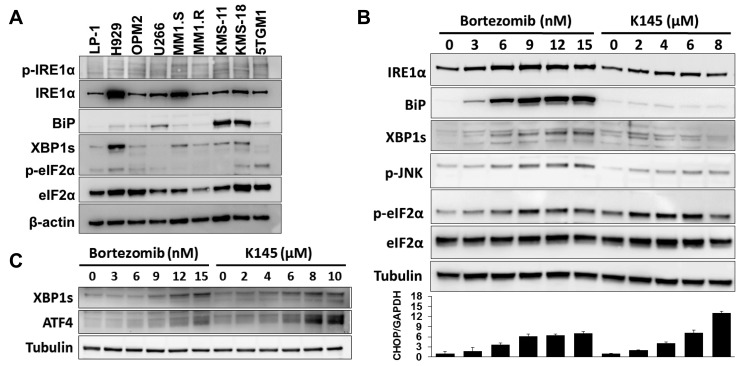
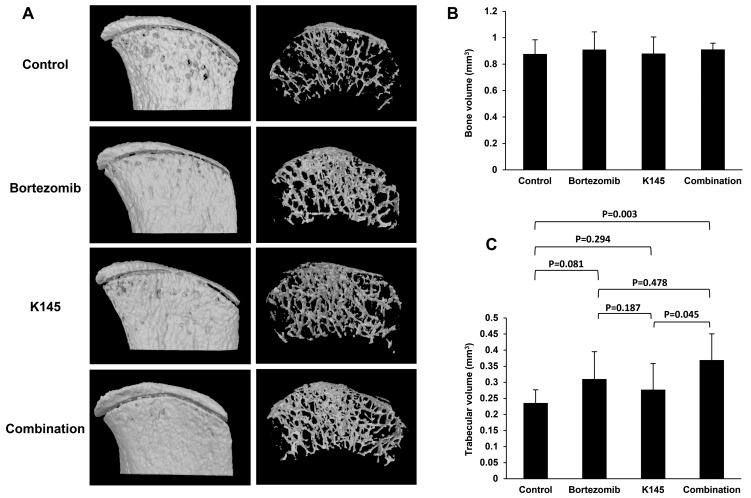
The proteasome inhibitor bortezomib has proven to be invaluable in the treatment of myeloma. By exploiting the inherent high immunoglobulin protein production of malignant plasma cells, bortezomib induces endoplasmic reticulum (ER) stress and the unfolded protein response (UPR), resulting in myeloma cell death. In most cases, however, the disease remains incurable highlighting the need for new therapeutic targets. Sphingosine kinase 2 (SK2) has been proposed as one such therapeutic target for myeloma. Our observations that bortezomib and SK2 inhibitors independently elicited induction of ER stress and the UPR prompted us to examine potential synergy between these agents in myeloma. Targeting SK2 synergistically contributed to ER stress and UPR activation induced by bortezomib, as evidenced by activation of the IRE1 pathway and stress kinases JNK and p38MAPK, thereby resulting in potent synergistic myeloma apoptosis in vitro. The combination of bortezomib and SK2 inhibition also exhibited strong in vivo synergy and favourable effects on bone disease. Therefore, our studies suggest that perturbations of sphingolipid signalling can synergistically enhance the effects seen with proteasome inhibition, highlighting the potential for the combination of these two modes of increasing ER stress to be formally evaluated in clinical trials for the treatment of myeloma patients.

Keywords: endoplasmic reticulum; myeloma; proteasome inhibitor; sphingosine kinase.


Conflict of interest statement

CONFLICTS OF INTEREST

The authors have no conflicts-of-interest to disclose.

Figures

Figure 1
Figure 1. SK2 has higher expression than SK1 in myeloma
A. Expression (log2) of sphingolipid enzymes in the publically available gene expression dataset E-MTAB-363 [14] of purified CD138+ bone marrow plasma cells from normal healthy (n = 5), MGUS (n = 5) and myeloma (n = 155) patients. The heatmap shows log2-fold changes where strong evidence existed (P < 0.01, Kruskal-Wallis test) for different median gene expression between normal and myeloma patients. All genes analysed are listed, but genes lacking strong evidence for differential expression (P > 0.01) are indicated with white boxes. B. Analysis of E-MTAB-363 demonstrates no change in SK1 (SPHK1) as disease progresses whereas SK2 (SPHK2) increases significantly between normal and MM (*P = 0.0004, Kruskal-Wallis test). Signal intensity represents log2 gene expression. C. SK1 and SK2 gene expression was analysed by RT-qPCR in the indicated human myeloma cell lines (upper) showing greater SK2 expression in all but one cell line examined. Enzyme activity assay for SK1 and SK2 using human myeloma cell lines (lower) reveals SK2 is more active than SK1 in most cell lines. Data are mean±SD of triplicate measurements and are representative of three independent experiments.
Figure 2
Figure 2. K145 induces myeloma cell death
A. The indicated human myeloma cell lines were cultured with increasing concentrations of K145 for 24 h and cell viability measured by flow cytometry using Annexin-V and PI staining with dual negative cells considered viable. B. LP-1 cells were treated for 16 h with the indicated concentrations of K145 and caspase-3 cleavage determined by intracellular flow cytometry. C. LP-1 (upper) and H929 (lower) cells were cultured with 10 μM or 4 μM, respectively, of K145 or vehicle, with or without pre-incubation with 100 μM Z-VAD-FMK and viability assessed after 16 h by flow cytometry. D. Sphingolipidomic analysis showing reduced S1P and increased long chain ceramide species in LP-1 cells treated with 8 μM K145 for 6 h. Data are mean±SD of duplicate measurements and are representative of three independent experiments. * P < 0.05.
Figure 3
Figure 3. SK2 inhibition synergises with bortezomib
A. LP-1 cells were cultured with the indicated concentrations of K145 with and without 6 nM bortezomib for 24 h and cell viability measured by flow cytometry using Annexin-V/PI staining. Predicted additive effects, calculated by the fractional product method [19], are shown by the dashed lines whilst actual observed combinational effects by the red lines. B. LP-1 cells were cultured with the indicated concentrations of bortezomib with and without 4 μM K145 for 24 h and cell viability measured by flow cytometry using Annexin-V/PI staining. C. 5TGM1 cells were cultured with the indicated concentrations of K145 with and without 4 nM bortezomib for 24 h and cell viability measured by flow cytometry using Annexin-V/PI staining. D. LP-1 cells were cultured with the indicated concentrations of ABC294640 with and without 6 nM bortezomib for 24 h and cell viability measured by flow cytometry using Annexin-V/PI staining. Predicted additive and observed combinational effects are shown by the dashed and red lines, respectively. Mean±SD of duplicate measurements shown. Data are representative of three independent experiments.
Figure 4
Figure 4. Genetic knockdown of SK2 recapitulates SK2 inhibition using K145
A. LP-1 cells were strongly RFP positive after 72 h of culture with 0.5 μg/mL doxycycline (dox) consistent with stable integration of the tetracycline inducible SK2 shRNA into the cell genome. SK2 gene expression and activity were reduced by 65% and 75%, respectively, in LP-1 cells exposed to the indicated concentrations of dox for 72 h. Mean±SD of triplicate measurements are shown. B. LP-1 SK2 shRNA inducible cells were treated with 0.5 μg/mL dox for 72 h and 4 nM bortezomib added for the final 24 h of culture. Cell proliferation was measured by WST-1 assay. Reduced SK2 expression and activity results in a 52% reduction in proliferation which was further enhanced by the addition of bortezomib. Mean±SD of quadruplicate measurements shown. Data are representative of at least three independent experiments. * P < 0.05.
Figure 5
Figure 5. Bortezomib and K145 individually induce ER stress
A. ER stress and UPR proteins were assessed in a range of human myeloma cell lines and the 5TGM1 murine myeloma cell line. β-actin was used as a loading control. B. LP-1 cells were exposed to increasing concentrations of either bortezomib or K145 for 16 h and examined by Western blot for ER stress and UPR proteins. α-tubulin was used as a loading control. The viabilities for bortezomib conditions were 92%, 90%, 86%, 67%, 58% and 51%, whilst those for K145 were 91%, 88%, 84%, 78% and 68%, respectively. RT-qPCR analysis for CHOP was performed in parallel and presented as a bar chart below the Western blots. Mean±SD of triplicate measurements shown. Data are representative of three independent experiments. C. LP-1 cells were exposed to increasing concentrations of either bortezomib or K145 for 4 h and examined by Western blot for ER stress and UPR proteins. α-tubulin was used as a loading control. The viabilities for all conditions were greater than 85%.
Figure 6
Figure 6. Dual bortezomib and K145 treatment induces synergistic ER stress
A. LP-1 cells were cultured with vehicle and sub-cytotoxic concentrations of bortezomib (5 nM), K145 (7 μM) or both for 4 h and examined for levels of ER stress and UPR activation by Western blot. B. LP-1 cells were cultured with vehicle and sub-cytotoxic concentrations of bortezomib (3 nM), K145 (4 μM) or both for 16 h and examined for levels of ER stress and UPR activation by Western blot. Co-administration of bortezomib and K145 to LP-1 cells increases expression of spliced XBP1 mRNA and produces a marked increase in CHOP gene expression by RT-qPCR at 16 h shown as bar charts below the Western blots. Mean±SD of triplicate determinations are shown with expression levels relative to control cultures and normalised to GAPDH. C. LP-1 cells were cultured with the indicated concentrations of bortezomib and K145 for 16 h. Levels of IRE1α and stress kinase activation were assessed by Western blot. α-tubulin was used as a loading control. D. Proposed schematic of how bortezomib and K145 combine to induce synergistic ER stress and UPR activation that results in pro-apoptotic IRE1α signalling.
Figure 7
Figure 7. Dual bortezomib and K145 therapy shows in vivo efficacy in the aggressive C57BL/KaLwRij murine myeloma model
A. Representative bioluminescence images of mice in each treatment group after luciferin injection at day 14 (pre-treatment), day 21 (after one week of treatment) and day 28 (after two weeks of treatment). B. Quantitation of myeloma disease burden in each treatment group at day 28. Disease burden at each timepoint was modelled using a multiple linear regression that takes into consideration varying baseline (day 14) disease levels between animals. Mean disease burden ± 95% confidence interval for the mean are shown. 13 (7 male, 6 female), 13 (7 male, 6 female), 13 (7 male, 6 female) and 15 (9 male, 6 female) mice were analysed from the control, bortezomib, K145 and combination treatment groups, respectively. C. Mice were treated for three weeks (days 14 to 35) indicated by the shaded region and then monitored for clinical deterioration and culled as required. Kaplan-Meier survival functions for each treatment group are shown (P = 0.0085, log-rank test).
Figure 8
Figure 8. Dual bortezomib and K145 therapy has favourable effects on myeloma bone disease
A. Representative micro CT scans of right-sided iliac crests from female mice in each treatment group. External bone surface (left) is shown to visualise lytic lesions whilst the interior of the bone (right) enables assessment of trabecular integrity. B. Quantitation of total bone volume between groups. C. Quantitation of trabecular volume between treatment groups. Mice receiving the combination of bortezomib and K145 had an average total trabecular volume of 0.37±0.08 mm3 versus 0.23±0.04 mm3 in vehicle-treated animals (P = 0.003) and 0.28±0.08 mm3 in K145-treated animals (P = 0.045). However, there was only a trend towards greater trabecular volume compared to bortezomib treated mice, 0.37±0.08 mm3 versus 0.31±0.09 mm3 in bortezomib-treated animals (P = 0.478). Six female mice were analysed per group with mean±SD shown.

Similar articles

Cited by

References

    1. Rollig C, Knop S, Bornhauser M. Multiple myeloma. Lancet. 2015;385:2197–208. - PubMed
    1. Kyle RA, Rajkumar SV. An overview of the progress in the treatment of multiple myeloma. Expert Rev Hematol. 2014;7:5–7. - PubMed
    1. Lu S, Wang J. The resistance mechanisms of proteasome inhibitor bortezomib. Biomark Res. 2013;1:13. - PMC - PubMed
    1. Vincenz L, Jager R, O’Dwyer M, Samali A. Endoplasmic reticulum stress and the unfolded protein response: targeting the Achilles heel of multiple myeloma. Mol Cancer Ther. 2013;12:831–43. - PubMed
    1. Aronson LI, Davies FE, Dang ER. protein ovERload. Targeting protein degradation to treat myeloma. Haematologica. 2012;97:1119–30. - PMC - PubMed

MeSH terms