. 2017 May 11;545(7653):181-186.
doi: 10.1038/nature22324. Epub 2017 May 3.

Maintenance of persistent activity in a frontal thalamocortical loop

Affiliations

Maintenance of persistent activity in a frontal thalamocortical loop

Zengcai V Guo et al. Nature. .

Abstract

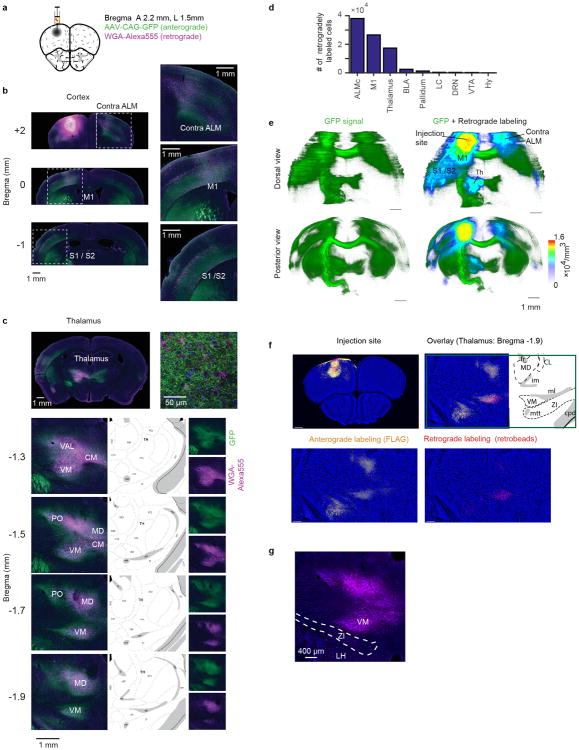
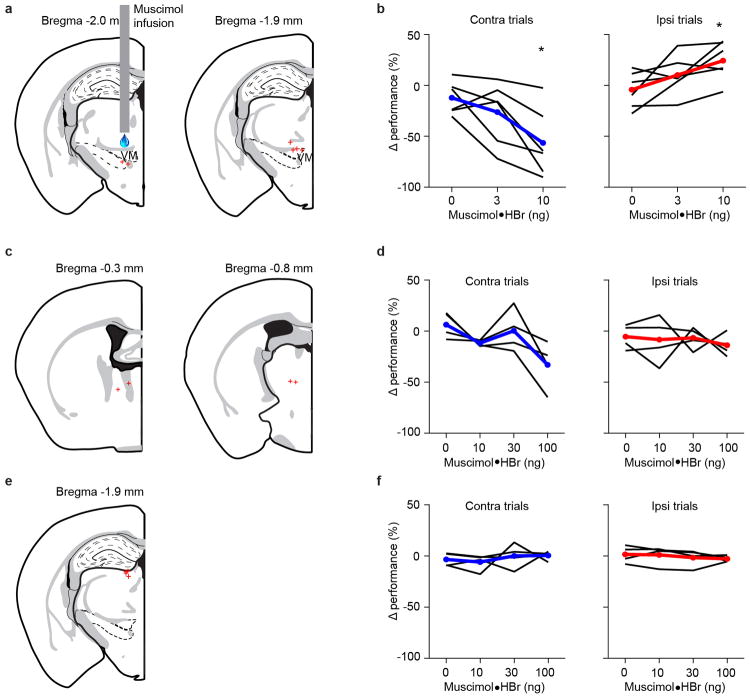
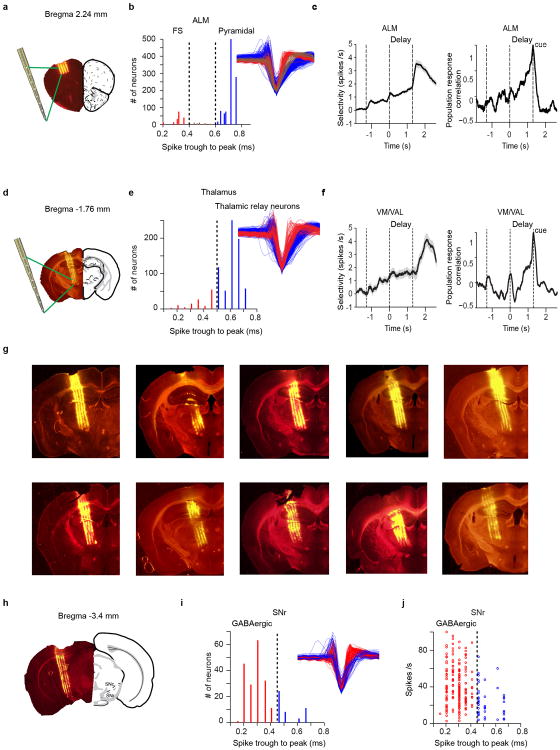
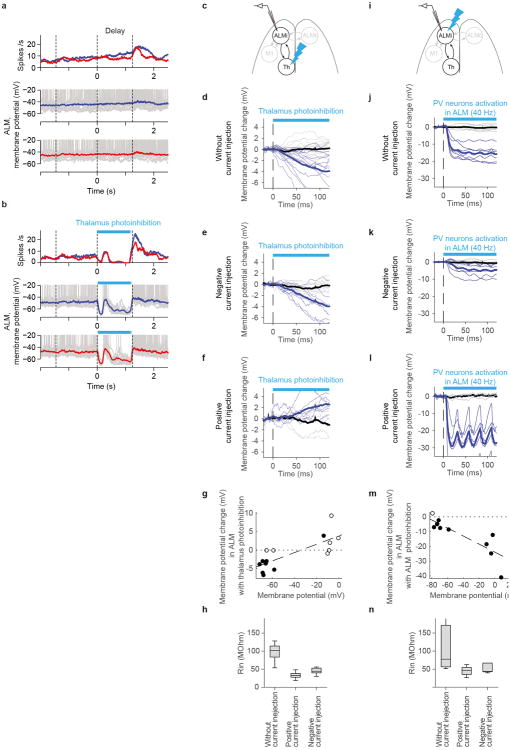
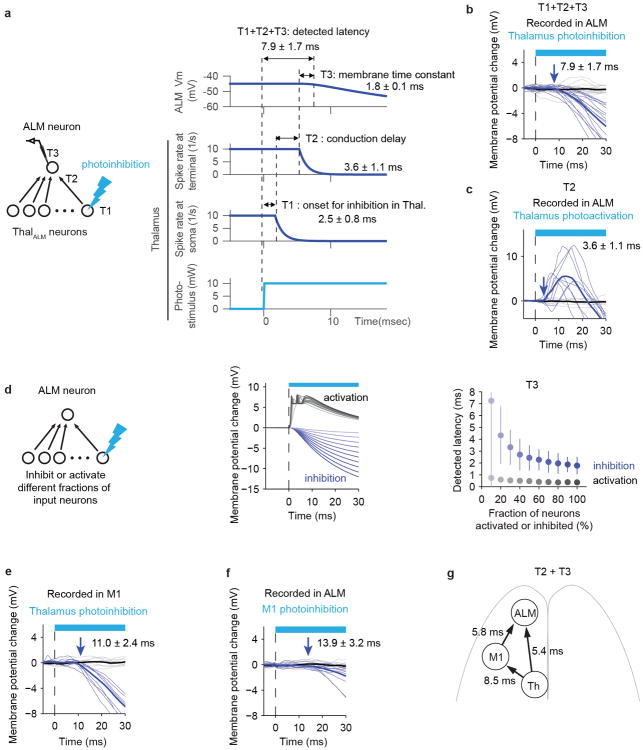
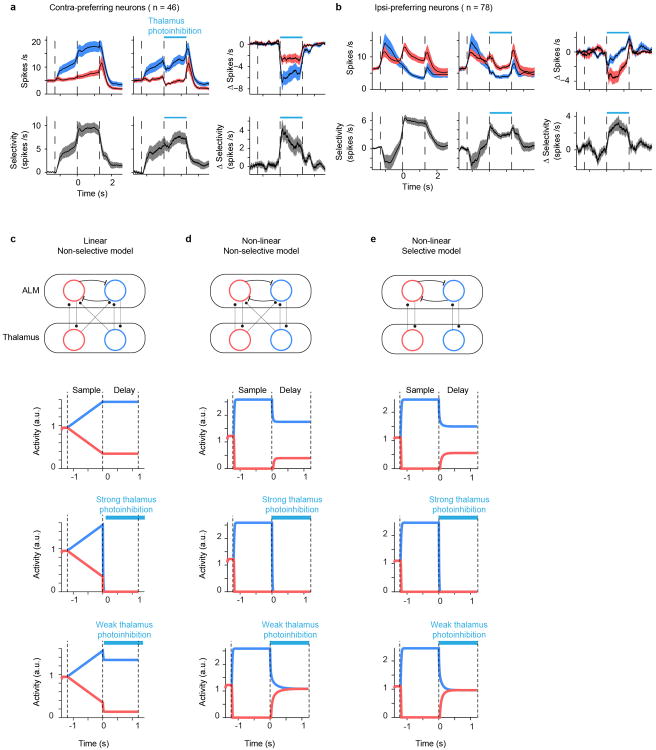
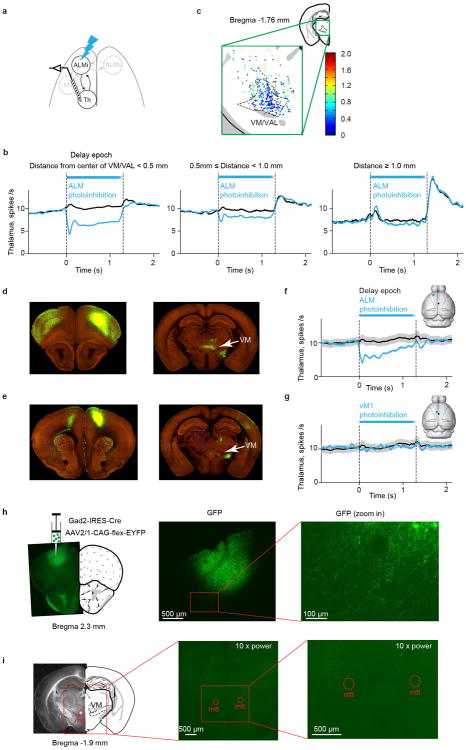
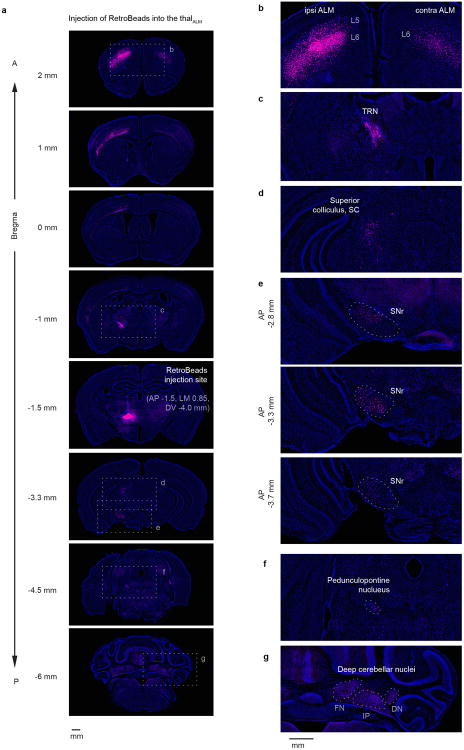
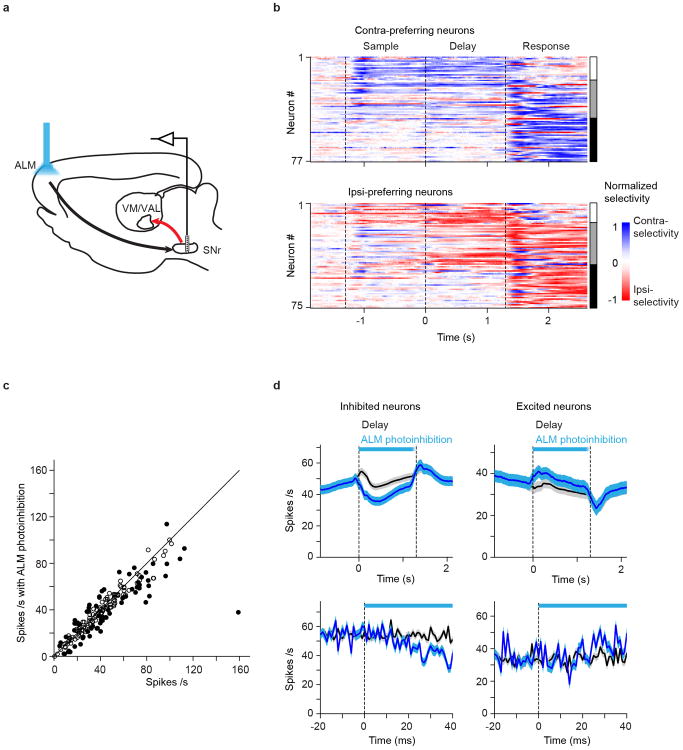
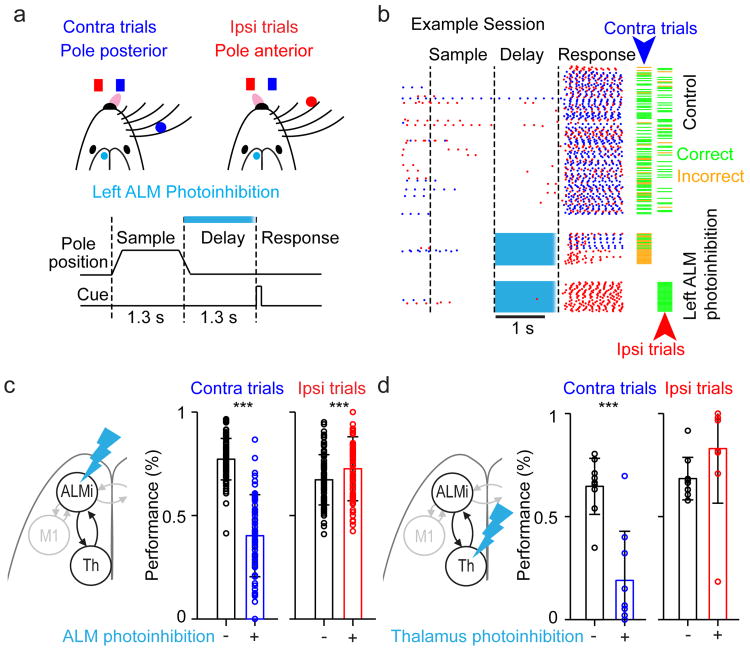
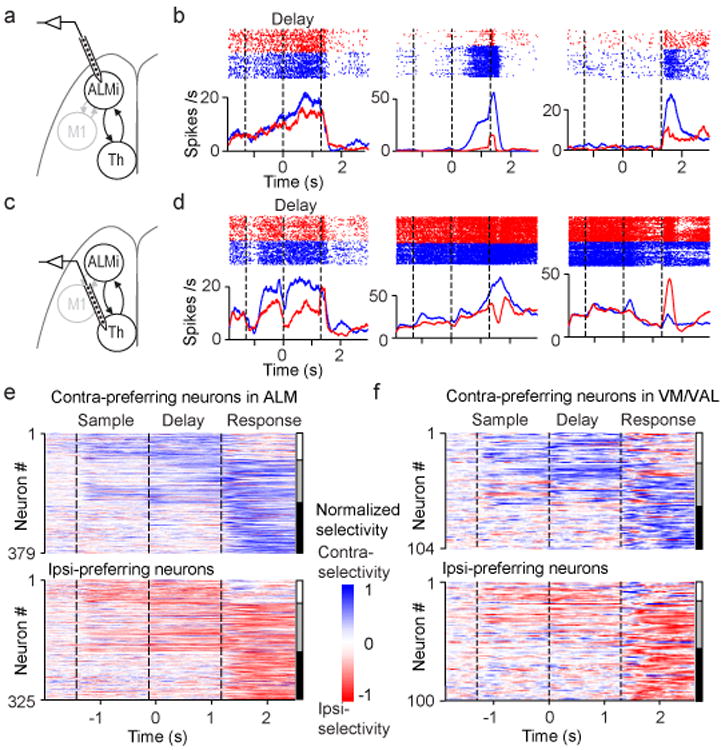
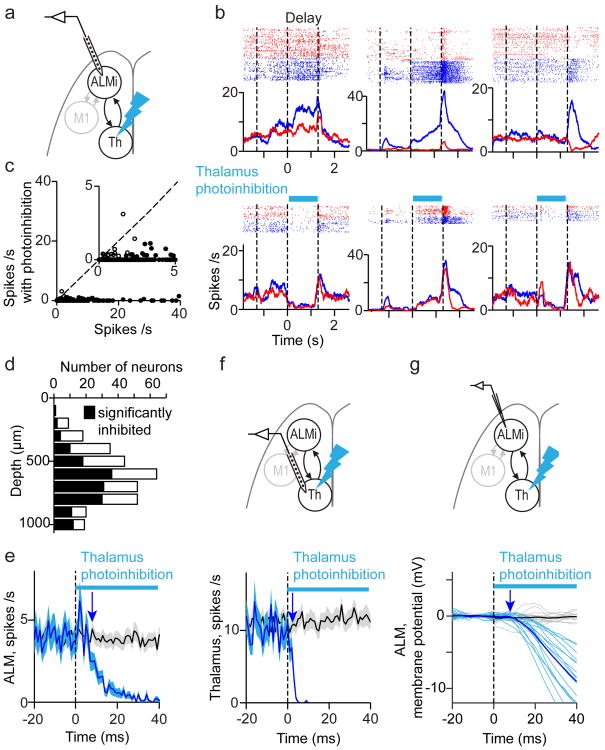
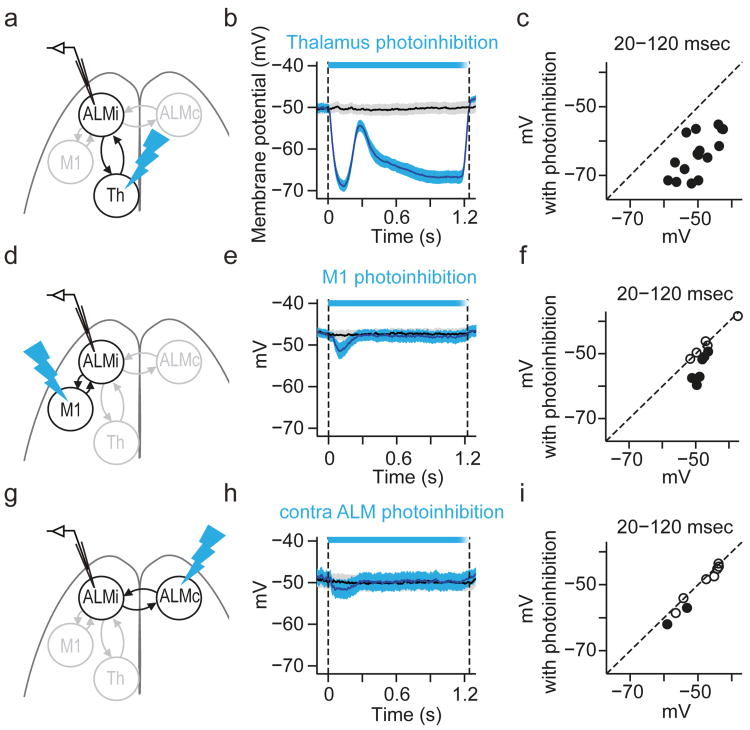
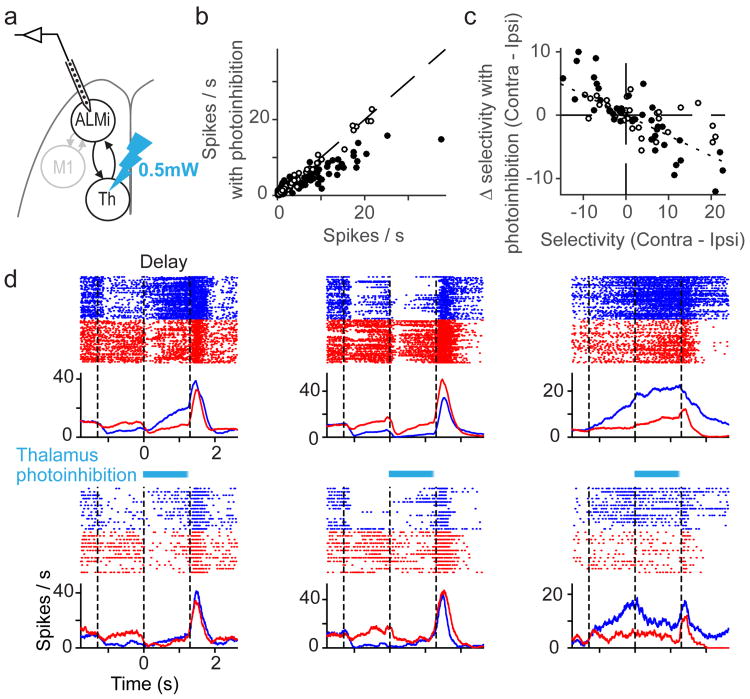
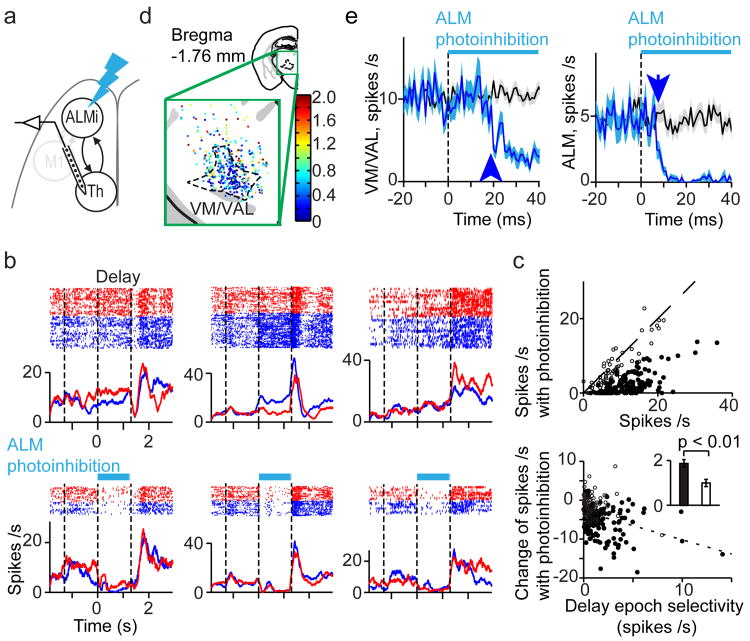
Persistent neural activity maintains information that connects past and future events. Models of persistent activity often invoke reverberations within local cortical circuits, but long-range circuits could also contribute. Neurons in the mouse anterior lateral motor cortex (ALM) have been shown to have selective persistent activity that instructs future actions. The ALM is connected bidirectionally with parts of the thalamus, including the ventral medial and ventral anterior-lateral nuclei. We recorded spikes from the ALM and thalamus during tactile discrimination with a delayed directional response. Here we show that, similar to ALM neurons, thalamic neurons exhibited selective persistent delay activity that predicted movement direction. Unilateral photoinhibition of delay activity in the ALM or thalamus produced contralesional neglect. Photoinhibition of the thalamus caused a short-latency and near-complete collapse of ALM activity. Similarly, photoinhibition of the ALM diminished thalamic activity. Our results show that the thalamus is a circuit hub in motor preparation and suggest that persistent activity requires reciprocal excitation across multiple brain areas.


Figures

Extended Data Figure 1
Extended Data Figure 1. ALM makes reciprocal connections with multiple cortical and thalamic areas
a. Co-injection of adeno-associated virus (AAV2/1-CAG-GFP) for anterograde labeling, and Wheat Germ Agglutinin (WGA)-Alexa Fluor® 555 (WGA-Alexa555) for retrograde labeling. b. Labeling in the cortex. Retrograde and anterograde labeling was observed in contralateral ALM, ipsilateral M1 and ipsilateral somatosensory cortex (S1/ S2). Dashed boxes indicate the locations of the magnified images in the right panels. Green, anterograde label (GFP); magenta, retrograde label (WGA-Alexa555); blue, Nissl stain. c. Labeling in the thalamus (same color scheme as in b). Anterograde labeling was found in ipsilateral thalamus (with a weak contralateral projection), whereas retrograde labeling was observed only in ipsilateral thalamus (top left). Representative confocal image of the thalamus (top right). Four coronal sections of ipsilateral thalamus are shown on the bottom left. The corresponding areas from the Allen Reference Atlas (http://mouse.brain-map.org/static/atlas) are shown on bottom middle. Anterograde and retrograde labeling are shown separately on bottom right. VM, ventral medial nucleus of the thalamus; VAL, ventral anterior-lateral nucleus of the thalamus; CM, centromedian nucleus of the thalamus; MD, medial dorsal nucleus of the thalamus; IMD, Intermediodorsal nucleus of the thalamus; PO, posterior nucleus of the thalamus; RT; thalamic reticular nucleus, ZI, zona incerta; fr, fasciculus retroflexus; im, internal medullary lamina of the thalamus; em, external medullary lamina of the thalamus; ml, medial lemniscus; mtt, mammillothalamic tract (Allen Reference Atlas). d. Number of neurons labeled by retrograde injection into left ALM in cortical and subcortical areas. From left to right: 38062 (Contra ALM), 26599 (M1), 17375 (thalamus), 2532 (BLA: Basolateral Amygdala), 1312 (Pallidum and BF: basal forebrain), 427 (LC: Locus coeruleus), 377 (DRN: Dorsal Raphe Nucleus), 263 (VTA: ventral tegmental area), and 59 (HY: hypothalamus). The boundaries of cortical areas are poorly defined, we therefore limit the neuron counting to the regions manipulated in the photoinhibition experiments in Fig. 4 (Methods). Since labeling was more focused in subcortical areas we counted all neurons in these areas. Among ALM-projecting subcortical structures only the thalamus shows strong anterograde labeling from ALM (c and e). e. Dorsal and posterior view of a brain reconstructed in 3D. (Left) Anterograde GFP signal. (Right) Anterograde GFP signal (green) overlaid with heatmap representing density of retrogradely labeled neurons (heatmap). For individual retrogradely labeled neurons, number of other surrounding retrogradely labeled neurons within ± 100 μm cube were counted to estimate cell density. Note several cortical areas (contra ALM, and ipsilateral cortical areas including ipsi M1) and ipsi-thalamus show both high anterograde and retrograde labeling. f. Additional experiments using co-injection of adeno-associated virus (AAV2/1-CAG-FLAG) for anterograde labeling, and RetroBeads for retrograde labeling (Methods). RetroBeads provide spatially more restricted injection sites. (Left) Injection site in ALM. Retrograde labeling (red) is spatially restricted to the injection site in the center of ALM (with some spreading to layer 1 and the pia). The three other panels show the signal in the thalamus. g. Neurons labeled by retrograde tracer injection into ALM were very rare in ZI (total count, 31+/-2 per brain). None of the labeled neurons were positive for somatostatin (a marker for cortex projecting GABAergic ZI neurons, data not shown). This excludes the possibility that ZI GABAergic neurons directly inhibit ALM during optogenetic manipulation of thalamus.
Extended Data Figure 2
Extended Data Figure 2. Optical fiber locations and thalamus photoinhibition
a. Left, schematic of thalamus photoinhibition through an optical fiber. Right, optical fiber locations were overlaid on a coronal section of the Allen Reference Atlas (n = 7 mice). b. Schematic of thalamus recording during photoinhibition using an optrode. c. Top, peri-stimulus time histogram (PSTH) of putative thalamic neurons recorded by an optrode during control (black) and photoinhibition (blue) conditions in Gad2-IRES-Cre mice. Virus expressing ChR2 in a cre-dependent manner was injected in the VM/VAL projection zone of TRN. The magnitude of photoinhibition depends on the overlap of light intensity and axonal ChR2 expression. The fiber optic was 1 mm dorsal of VM/VAL, which likely explains that photoinhibition was stronger 1 mm from the fiber than closer to the fiber output. Averaging window, 100 ms. Bottom, normalized spike rate (mean spike rate during photoinhibition divided by mean spike rate during control) versus distance from optical fiber. Error bar indicates standard deviation. n = 26, 41, 17 cells; distances 0.6, 0.8, 1.0 mm respectively. Laser power at the tip of optical fiber, 10 mW. d. Top, PSTH of thalamic neurons recorded by an optrode during control (black) and photoinhibition (blue) conditions in VGAT-ChR2-EYFP mice. Averaging window, 100 ms. Bottom, normalized spike rate (mean spike rate during photoinhibition divided by mean spike rate during control) versus distance from optical fiber. Error bar indicates standard deviation. n = 34, 42, 38 cells; distances 0.6, 0.8, 1.0 mm respectively. Silencing extended beyond the VM/VAL and included other thalamic nuclei that project to ALM and nearby cortical areas. Silencing using VGAT-ChR2-EYFP was more potent than with Gad2-IRES-Cre mice (c). Laser power at the tip of optical fiber, 10 mW. e. PSTH of ALM neurons during control (black) and thalamus photoinhibition (blue) conditions. Laser power at the tip of optical fiber 10mW, n = 314 cells. Averaging window 100 ms.
Extended Data Figure 3
Extended Data Figure 3. Effects of thalamic muscimol infusions on behavior
a. Muscimol infusion locations (red crosses) near VM/VAL. Sites from left (n = 3) and right (n = 3) hemispheres were mapped onto the left hemisphere. b. Small muscimol infusion (1.5-5 ng) near VM/VAL produced ipsilateral bias. Left, performance change in contra-trials after muscimol infusion. Right, performance change in ipsi-trials after muscimol infusion. Each line represents an infusion site (n = 6, same mice as in a). *, P < 0.05. c. Muscimol infusion locations in the anterior part of the thalamus (red crosses). Sites from left (n = 2) and right (n = 2) hemispheres were mapped onto the left hemisphere. d. Muscimol infusions in the anterior part of the thalamus (∼ 0.3 – 0.8 mm anterior to VM/VAL; same mice as in c). Note that much higher muscimol concentrations (10 times of those used near VM/VAL), did not affect behavior. e. Muscimol infusion locations in the dorsal part of the thalamus (red crosses). Sites from left (n = 2) and right (n = 2) hemispheres were mapped onto the left hemisphere. f. Muscimol infusions in the dorsal part of the thalamus (∼ 0.2 - 0.5 mm dorsal to medial dorsal thalamus, same mice as in e). Note that much higher muscimol concentrations (10 times of those used near VM/VAL), did not affect behavior.
Extended Data Figure 4
Extended Data Figure 4. Recording sites and neuron types recorded in ALM, thalamus and SNr
a. Example electrode tracks in ALM labeled with DiI. b. Single unit classification in ALM. Left, putative fast-spiking (FS) interneurons (red, n = 166) and putative pyramidal neurons (blue, n = 1006) were separated based on the histogram of spike widths (Methods). A small subset of neurons with intermediate spike durations were not classified (brown, n = 42). Right, mean spike waveform of each unit. c. Left, average population selectivity in spike rate of ALM neurons. To compute population selectivity, we first determined each neuron's preferred trial type using spike counts from half of the trials; selectivity was calculated as the spike rate difference between the preferred and non-preferred trial types for the other half of trials. SEM was estimated by bootstrapping over neurons. Averaging window, 200 ms. Right, population response correlation of ALM neurons. The smoothed response was mean subtracted and normalized to the variance during the entire trial epoch. Pearson's correlation at a particular time was calculated between the population response vector at that time point and the population response vector at the onset of the response cue. d. Example electrode tracks in VM/VAL. e. Single unit classification of neurons in thalamus. Left, putative thalamic neurons (blue, n = 672) were selected based on the histogram of spike widths (Methods). Right, mean spike waveform of each unit. f. Average population selectivity in spike rate (left) and population correlation (right) of VM/VAL neurons. g. Additional electrode tracks in the thalamus (n = 10 mice). Electrode tracks were used to determine if recorded neurons were in VM/VAL. h. Example electrode tracks in SNr. i. Single unit classification in SNr. Left, putative GABAergic neurons (red, n = 181) were selected based on the histogram of spike widths and their high spike rates (Methods). Right, mean spike waveform of each unit. j. Spike rate of single units in SNr. Putative GABAergic neurons have a mean spike rate of 40.9 ± 21.5 (mean ± SD, n = 181). The other neurons have a mean spike rate of 23.4 ± 17.0 (mean ± SD, n = 46).
Extended Data Figure 5
Extended Data Figure 5. Hyperpolarization of ALM neurons during thalamus photoinhibition is caused by loss of excitation
a-b. Example ALM neuron during thalamus photoinhibition. Top, peri-stimulus time histogram (PSTH) during control (a) and photoinhibition trials (b). Correct contra- (blue) and ipsi- (red) trials only for control trials. All trials were included for photoinhibiting trials. Bottom, membrane potential during each trial type (10 trails each). Red and blue lines indicate the trial averaged membrane potential. Dashed lines separate behavioral epochs. c-h. The time course of membrane potential changes in ALM putative pyramidal neurons after thalamus photoinhibition (non-behaving animals). (c) Recording in ALM during thalamus photoinhibition (relevant to panels below). Note: in this experiment thalamic photoinhibition was weak because this was based on cre-dependent ChR2 AAV injected near the VM/VAL projection zone of TRN in Gad2-IRES-Cre mice. Photoinhibition is much more potent in VGAT-ChR2 mice because the vast majority of TRN and SNr neurons are ChR2 positive. (d) Membrane potential changes after light onset were averaged during control (black) and photoinhibition (light blue) conditions (n = 14 cells). Thin lines, traces of individual neurons. Consistent with data of behaving VGAT-ChR2 animals (Fig. 3g), we observed weaker but significant hyperpolarization after light onset.(e) The time course of membrane potential change in ALM neurons during hyperpolarization with negative current injection (n = 9 cells). Because the membrane potential is near the reversal potential for inhibitory currents, but far from excitatory currents, the driving force for inhibition was reduced, and apparent excitatory signals were amplified. (f) The time course of membrane potential change in ALM for neurons during depolarization with positive current injection (n = 6 cells). Because the membrane potential is near the reversal potential for excitatory currents but far from inhibitory currents, driving force for excitation is reduced, and apparent inhibitory signal is amplified under this condition. (g) Relationship between membrane potential in non-photoinhibition condition vs. membrane potential changes with photoinhibition (ΔmV). Membrane potential and ΔmV were calculated between 100 ∼ 120 ms after the onset of light. Black circles: cells with significant change of membrane potential. Dotted line with broad dash indicates linear regression. Because input resistances during positive and negative current injections were similar (p = 0.05, ranksum test) (h), we plotted data from positive and negative current injections (i.e. excluding data without current injection because the input resistances were significantly higher). Slope of linear regression is larger than 0 (p < 0.0001, bootstrap), implying that hyperpolarization was larger during negative current injections. Hyperpolarization is therefore caused mainly by loss of excitation. Note that conductance changes affect amplitude of ΔmV but not the direction of change compared to the baseline. Moreover, we used low levels of photoinhibition (around 5mV) so that changes in the leak conductance should be minor compared to changes in synaptic conductance. None of the measurements were corrected for junction potential. i-n. The time course of membrane potential change in ALM neurons during photoactivation of local parvalbumin (PV) positive neurons expressing ChR2. This experiment shows that silencing by increases in inhibition can be distinguished from loss of excitation with our method. Figures numbering as in c-h. (i) Recording in ALM during photoinhibition in PV-ires-cre mice crossed with Ai32 (Cre dependent ChR2 line) (relevant to panels below). We observed strong hyperpolarization of ALM neurons (n = 7 cells) (j). Furthermore, when we performed current injections under this condition, we found enhanced hyperpolarization during positive current injection and reduction of hyperpolarization during negative current injection (n = 5, 6 cells, respectively) (k and l). This is consistent with hyperpolarization caused by increases in inhibition. (m) Slope of linear regression is smaller than 0 (p < 0.0001, bootstrap), which indicates hyperpolarization was amplified more during positive current injection. This implies that hyperpolarization is mainly due to increased inhibition. Because input resistances during positive and negative current injections were similar (p = 0.662, ranksum test) (n), we combined data from positive and negative current injections (i.e. excluding without current injection data because the input resistance was significantly different). Note that the effect of current injection is opposite from that of thalamus inactivation (cf g).
Extended Data Figure 6
Extended Data Figure 6. Onset of membrane potential changes after thalamic and cortical photoinhibition
a. Contributions to the time of detected membrane potential change in ALM after photoinhibition of the thalamus. The time between photostimulus onset and silencing in thalamus is T1 = 2.5 ± 0.8 ms (Fig. 3f). The propagation delay from thalamus to the thalamic terminals in ALM is T2 = 3.6 ms (conduction delay; see panel c). An additional T3 = 1.8 ms are required to hyperpolarize the membrane potential of ALM neurons, because of the synaptic and membrane time constants. The sum of these components (T1 + T2 +T3) explains the measured latency (7.9 ± 1.7 ms). T2 + T3 is defined as the latency difference. b. The time course of membrane potential change in ALM neurons after thalamus photoinhibition. Membrane potential changes after light onset were averaged during control (black) and photoinhibition (light blue) conditions (n = 16 cells). Thin lines, individual neurons. Other panels in this figure (c, e, f) follow the same format. Duplicate of Fig. 3g for comparison. The time between photoinhibition onset and hyperpolarization onset was 7.9 ± 1.7 ms. c. The time course of membrane potential change in ALM neurons after thalamus photoactivation in non-behaving naïve Olig3-cre × Ai32 animals. Olig3-cre labels thalamus specifically without labeling in cortex. The time between photostimulation onset and depolarization onset was 3.6 ± 1.1 ms (n = 9 cells). Since we used high intensity of laser power (10 mW), we assume spikes were generated in the thalamus within one millisecond. This time provides an estimate for the conduction delay of thalamocortical neurons (T2). d. Model-based estimation of the time required to depolarize or hyperpolarize ALM neurons, corresponding to T3 in panel (a). We modeled an ALM neuron with input from 200 thalamic neurons (Left). We measured the onset of membrane potential changes in the ALM neuron when different fractions of the input neurons were photoactivated (black) or photoinhibited (blue). Conduction delay was set to 0 to isolate the effect of membrane and synaptic time constants. Traces or plots with different color indicate data with different fractions of activated/inhibited neurons: 10-100% (from lighter to darker). Middle, mean membrane potential traces, Right, latency (Mean ± SEM, n=300 per condition). Spikes are trimmed off to show Vm traces (Middle). Even when 100% of the input neurons were inhibited, we expect to observe latency of 1.8 ± 0.7 ms (Mean ± SEM). The detected onset of the postsynaptic effects of photoinhibition is sensitive to the fraction of neurons manipulated. See Supplementary information for details. e. The time course of membrane potential change in M1 putative pyramidal neurons after thalamus photoinhibition during the delay epoch in behaving animals. The time between photoinhibition onset and hyperpolarization onset was 11.0 ± 2.4 ms (n = 9 cells). As it takes 2.5 ± 0.8 ms to reduce spike rates in thalALM after photostimulation onset, we estimate that it takes 8.5 ms for ThalALM to affect M1 activity. f. The time course of membrane potential change in ALM neurons after M1 photoinhibition during delay epoch in behaving animals. The time between photoinhibition onset and hyperpolarization onset was 13.9 ± 3.2 ms (n = 11 cells). As it takes 8.1 ± 1.2 ms to silence cortex (Fig. 6e), this implies it takes approximately 5.8 ms for changes in M1 activity to affect ALM activity. g. Summary of measured latencies. Time required to inhibit input structures is subtracted to show T2+T3.
Extended Data Figure 7
Extended Data Figure 7. Effects of weak thalamus inhibition on ALM selectivity and models of thalamo-ALM interactions
a. (Left, top) Average population PSTH, and (Left, bottom) population selectivity of contra-preferring ALM neurons. Here, contra-preferring neurons are defined as neurons with significantly higher spike rates during delay phase of contra-trials compared to ipsi-trials (t-test, P < 0.05). We included neurons with spike rates higher than 2 spikes per s during both control and inactivation conditions. Selectivity was calculated as the spike rate difference between the contra- and ipsi-trial types. Averaging window, 200 ms. (Middle, top) Average population PSTH, and (Middle, bottom) selectivity of contra-preferring ALM neurons during weak thalamic photoinhibition. (Right, top) Average spike rate changes, and (Right bottom) average selectivity changes caused by weak thalamic photoinhibition. SEM was estimated by bootstrapping over neurons. Blue, mean±SEM of contra-trials, Red, mean±SEM of ipsi-trials. b. The same plot as in (a) for ipsi-preferring neurons. c-e. We analyzed model networks to better understand the possible interactions between ALM and thalamus. The models consist of two neurons (left and right preferring neurons, blue and red, respectively at top panels) in both thalamus and ALM. Thalamus to ALM connections were either non-selective (c, d) or selective (e). Activity of the right (blue) and left (red) preferring neurons during a lick right trial are plotted (2nd-4th panels from the top). Selective sensory input enters ALM during the sample phase, and selective activity is maintained during the delay phase without sustained input (2nd panels from the top). The models were tested in response to non-selective thalamic photoinhibition that was either strong (3rd panels from the top) or weak (4th panels from the top). During strong thalamus photoinhibition, activities of the right and left preferring neurons were reduced to zero in all models (consistent with Fig. 3). During weak thalamus photoinhibition, selectivity was reduced to zero without large changes in mean spike rate in both non-linear models (d, e) (consistent with Fig. 5), but not in a linear model (c). See Supplementary information for details.
Extended Data Figure 8
Extended Data Figure 8. Modulation of thalamic activity by ALM photoinhibition is localized
a. Schematic of VM/VAL recording during ALM photoinhibition. b. Peri-stimulus time histogram of thalamic neurons averaged during control (black) and photoinhibition (light blue) conditions. Neurons were grouped based on their distance to the center of VM/VAL. Distance < 0.5 mm, n = 250; 0.5 ≤ distance < 1.0 mm, n = 160; distance ≥ 1.0 mm, n = 46. Averaging window 100 ms. Thalamic activity was inhibited mainly in VM/VAL. c. Locations of recorded neurons in thalamus. All recorded neurons were projected to the example coronal session. Neurons were color coded based on their firing rate during ALM photoinhibition normalized by the control firing rate without photoinhibition (the “first 100 ms” of photoinhibition, see Methods). Neurons near VM/VAL were more suppressed. Same data as Fig. 6d. d. Panels d-g compare the effects of photoinhibitin on ALM vs. vM1 on VAL/VM activity. Labeling corticothalamic projections by injecting EGFP-expressing AAV into ALM in a Rbp4-cre_KL100 mouse (AP3.08, ML 1.5, DV 0.4 mm, injection volume 235 nl, Rbp4-cre line labels cells in layer 5 and 6. Data from mouse connectivity map of Allen Brain Atlas: id 263242463, http://connectivity.brain-map.org/). Extensive labeling is seen in VM/VAL (see also Extended Data Fig. 1 and 9). e. Labeling corticothalamic projections by injecting EGFP-expressing AAV into vM1 in a Rbp4-cre_KL100 mouse (AP1, ML 0.75, DV 0.3 and 0.75 mm, injection volume 308 nl. Data from mouse connectivity map of Allen Brain Atlas: id 168162771, http://connectivity.brain-map.org/). The labeling in VM is much less extensive than in (d). f. Schematic showing ALM photoinhibition. Peri-stimulus time histogram of VM/VAL neurons averaged during control (black) and ALM photoinhibition (light blue) conditions. Photoinhibition conditions were interleaved. SEM was estimated by bootstrapping over neurons (n = 46 cells from 3 mice.). SEM for photoinhibition conditions are not displayed for clarity. Averaging window 100 ms. g. Schematic showing vM1 photoinhibition. Peri-stimulus time histogram of VM/VAL neurons averaged during control (black) and vM1 photoinhibition (light blue) conditions. Photoinhibition conditions were interleaved. Photoinhibiting vM1 produced less reduction of VM/VAL activity. SEM was estimated by bootstrapping over neurons (n = 46 cells from 3 mice). SEM for photoinhibition conditions are not displayed for clarity. Averaging window 100 ms. h. Panels h-i show the absence of long range GABAergic projections from ALM in the thalamus. GABAergic neurons labeled with GFP in ALM. Left, adeno-associated virus (AAV2/1-CAG-felx-EGFP) was injected into ALM in a Gad2-IRES-Cre mouse. Middle: confocal images showing GABAergic neurons expressing EGFP. Same neurons as in the left panel. Right, magnified view of the boxed region in the middle panel, showing labeled axons of GABAergic neurons. i. Absence of GABAergic axons in VM (ventral medial nucleus of the thalamus). Left, VM and the mammilothalamic tract (mtt). Middle, confocal image of the region in the left panel. Laser power was 10 times higher compared to (h). In addition, images were contrast enhanced, as reflected by the higher background fluorescence. Right, magnified view of the indicated region in the middle panel. No labeled axonal processes were detected in thalamus.
Extended Data Figure 9
Extended Data Figure 9. Thalamic regions that are connected reciprocally with ALM (thalALM) receive input from multiple brain areas
RetroBeads were injected into thalALM (AP -1.5, ML 0.85, DV -4.0 mm from Bregma, mainly in VM). Magenta, retrograde labeling; blue, Nissl staining. a. Coronal sections. Dashed boxes indicate location of magnified images on right panels (b-g). b. Labeling in ALM. Overall labeling was much stronger in ipsilateral ALM. Labeling in ALM was observed on both sides in L6, whereas labeling in L5 was seen only in ipsilateral ALM. L6 neurons are corticothalamic neurons, whereas the L5 neurons correspond to pyramidal tract neurons that send a branch to thalamus. In addition to ALM, labeling was observed in M1, S2 and weakly in other cortical areas (see a). c. Labeling in the ipsilateral thalamic reticular nucleus, TRN. d. Labeling in the ipsilateral superior colliculus, SC. e. Labeling in the ipsilateral substantia nigra pars reticulate (SNr), in three coronal sections. Labeling was observed throughout SNr from the caudal to the rostral end, consistent with a previous report. f. Labeling in the ipsilateral pedunculopontine nucleus (PPN). g. Labeling in the contralateral deep cerebellar nuclei. FN, fastigial nucleus; IP, interposed nucleus; DN, dentate nucleus.
Extended Data Figure 10
Extended Data Figure 10. Effect of ALM photoinhibition on SNr activity
a. Schematic of SNr recording during ALM photoinhibition. Since the SNr → thalamus projection is inhibitory (red arrow), SNr could contribute to VM/VAL inhibition if ALM photoinhibition activates SNr. We used multi-shank silicon probes (spanning 600 μm, medial to lateral) to survey a large part of SNr (medial, lateral, rostral and caudal). b. SNr population selectivity. Selectivity is the difference in spike rate between the preferred and non-preferred trial type, normalized to the peak selectivity. Only putative GABAergic neurons with significant trial selectivity are shown (n = 152/181, t-test, P < 0.05). The grey scale bar on the right indicates selectivity type: Neurons showing preparatory activity only (white); both preparatory activity and peri-movement activity (grey); peri-movement activity only (black). Averaging window, 200ms. SNr selectivity is similar to ALM and VM/VAL (Fig. 2). c. Scatter plot of SNr GABAergic neurons (n = 181; spikes measured for 100 ms, starting 20 ms after photostimulus onset; Methods). Filled circles, neurons that were significantly modulated by ALM photoinhibition (P< 0.05, t-test). Photoinhibition of ALM changed only a relatively small fraction of SNr neurons (48/181 significantly inhibited; 23/181 significantly activated, P < 0.05, t-test,). Moreover, neurons that decreased their activity were more numerous than neurons that increased their activity (bootstrapping over neurons, P < 0.01, Methods). Overall, inhibiting ALM reduced SNr activity by 3.6 spikes per second (8.3% of control activity measured for 100 ms, starting 20 ms after photostimulus onset). This reduction of neural activity in SNr is expected to increase thalALM activity. d. The time course of SNr GABAergic neurons during ALM photoinhibition. Left, significantly inhibited neurons (n = 48). Right, significantly excited neurons (n = 23). SEM was estimated by bootstrapping over neurons. Top, averaging window 100 ms. Bottom, bin size 1 ms. These data indicate that ALM to SNr pathways do not contribute to the early phase of VM/VAL inhibition after ALM photoinhibition. SNr neurons were affected by ALM photoinhibition with a relatively long latency difference (15.2 ± 4.6 ms, mean ± SEM, P < 0.05, t-test), longer than for reducing thalALM activity (10.9 ± 2.9 ms; Fig. 6e).
Figure 1
Figure 1. ALM and thalamus are required for motor preparation
a. Top, mouse reporting the location of a pole by directional licking. Contra / ipsi refer to the photoinhibited left hemisphere (cyan circle). Bottom, task structure (relevant to b-d). b. Example behavioral session. Blue, contra licks; red, ipsi licks. Right, trial outcome; green dash, correct; orange dash, incorrect. c. ALM photoinhibition. Left, schematic of photoinhibition. Right, behavioral performance. Circles,behavioral sessions (n = 84; 11 mice; error bars, standard deviation). ***, P < 0.001, paired t-test. d. Thalamus photoinhibition (n = 9; 4 mice).
Figure 2
Figure 2. ALM and thalamus show similar neural dynamics
a. Silicon probe recordings in ALM (relevant to b, e). b. Three example ALM neurons. Top, spike raster. Bottom, peri-stimulus time histogram. Blue, correct contra trials; red, correct ipsi trials. Dashed lines separate behavioral epochs. c. Silicon probe recordings in VM/VAL (relevant to d, f). d. Three example VM/VAL neurons. Same format as b. e. ALM population selectivity (n = 704). Vertical bars on the right; white, neurons with preparatory activity only; grey, both preparatory activity and peri-movement activity; black, peri-movement activity. f. VM/VALpopulation selectivity (n = 204). Same format as e.
Figure 3
Figure 3. Thalamus drives ALM
a. Recording in ALM during thalamus photoinhibition (panels b-e). b. Three example neurons. Same format as Fig. 2b. c. Spike rates during 20-120 ms after photostimulus onset. Filled circles, neurons that were significantly modulated by thalamus photoinhibition (P < 0.05, t-test). Dotted line, unity line. Inset, blow-up of the scatter plot. d. Number of modulated ALM neurons across cortical depth. e. Average time-course of ALM neurons during thalamus photoinhibition. Black, control PSTH; blue, photoinhibition (n = 314). Shading, SEM. Arrow, onset of ALM inhibition. f. Top, recording in thalamus during thalamus photoinhibition. Bottom, average time-course of thalamic neurons (n = 148). Same format as e. g. Top, whole-cell recording in ALM during thalamus photoinhibition. Bottom, thick lines, time-course of mean membrane potential (Black, control; blue, photoinhibition) (n = 16 cells). Thin lines, individual neurons.
Figure 4
Figure 4. Comparison of thalamic and cortical input
a. Whole-cell recording in ALM during thalamus photoinhibition (panels b-c). b. Time-course of mean membrane potential in ALM neurons during thalamus photoinhibition (n = 16 cells). Shading, SEM. Panels e and h follow the same format. Two hundred milliseconds after photostimulation onset, the membrane potential transiently recovered, likely caused by a concomitant rebound in thalALM activity (Extended Data Fig. 2). c. Mean membrane potential during 20-120 ms after photostimulus onset. Filled circles, neurons that were significantly modulated by photoinhibition (P < 0.05, t-test). Dotted line, the unity line. Panels f and i follow the same format. d-g. Whole-cell recording in ALM during M1 photoinhibition (n = 11 cells). g-i. Whole-cell recording in ALM during contralateral ALM photoinhibition (n = 9 cells).
Figure 5
Figure 5. Thalamic activity maintains selectivity in ALM
a. Recording in ALM during weak thalamic photoinhibition (panels b-d). b. Spike rates were measured for 1300 ms during photoinhibition and control conditions. Filled circles, neurons that were significantly modulated by thalamus photoinhibition (P < 0.05, t-test, n = 160). c. Relationship between selectivity of individual neurons and changes in selectivity due to photoinhibition of thalamus. Dotted line, linear regression (slope = -0.33, Pearson correlation coefficient = -0.75). Filled circles, the same as in b. d. Three example neurons. Same format as Fig. 2b.
Figure 6
Figure 6. ALM drivesthalamus
a. Recording in VM/VAL during ALM photoinhibition (panels b-e). b. Three example neurons. Same format as Fig. 2b. c. Top, spike rates during 20-120 ms after photostimulus onset. Filled circles, neurons that were significantly modulated by ALM photoinhibition (P < 0.05, t-test). Dotted line, unity line. Bottom, relationship between change of spike rates due to photoinhibition and delay epoch selectivity. Filled circles, same as in the top. Dotted line, linear regression (slope = -0.73, Pearson correlation coefficient = -0.33). Inset, delay epoch selectivity of significantly (black bar) and non-significantly (white bar) modulated neurons (P = 0.002, t-test). d. Locations of recorded neurons in thalamus. Neurons were color coded based on their spike rate during ALM photoinhibition normalized by the spike rate without ALM photoinhibition (Methods). e. Left, time course of VM/VAL activity during ALM photoinhibition (n = 201 neurons). Right, time course of activity in ALM pyramidal neurons during ALM photoinhibition (n = 256 neurons). Same format as Fig. 3e.

Comment in

  • Working memory: Persistence is key.
    Bray N. Bray N. Nat Rev Neurosci. 2017 Jul;18(7):385. doi: 10.1038/nrn.2017.70. Epub 2017 May 25. Nat Rev Neurosci. 2017. PMID: 28541347 No abstract available.

References

    1. Tanji J, Evarts EV. Anticipatory activity of motor cortex neurons in relation to direction of an intended movement. J Neurophysiol. 1976;39:1062–1068. - PubMed
    1. Churchland MM, Cunningham JP, Kaufman MT, Ryu SI, Shenoy KV. Cortical preparatory activity: representation of movement or first cog in a dynamical machine? Neuron. 2010;68:387–400. - PMC - PubMed
    1. Guo ZV, et al. Flow of cortical activity underlying a tactile decision in mice. Neuron. 2014;81:179–194. - PMC - PubMed
    1. Erlich JC, Bialek M, Brody CD. A cortical substrate for memory-guided orienting in the rat. Neuron. 2011;72:330–343. - PMC - PubMed
    1. Murakami M, Vicente MI, Costa GM, Mainen ZF. Neural antecedents of self-initiated actions in secondary motor cortex. Nature neuroscience. 2014;17:1574–1582. - PubMed

Publication types