. 2017 May 11;545(7653):238-242.
doi: 10.1038/nature22313. Epub 2017 May 3.

Non-equivalence of Wnt and R-spondin ligands during Lgr5+ intestinal stem-cell self-renewal

Affiliations

Non-equivalence of Wnt and R-spondin ligands during Lgr5+ intestinal stem-cell self-renewal

Kelley S Yan et al. Nature. .

Abstract

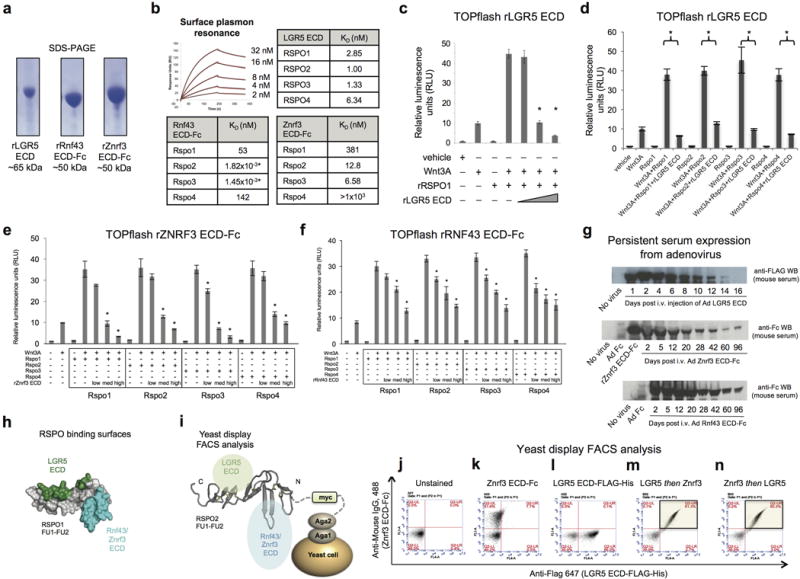
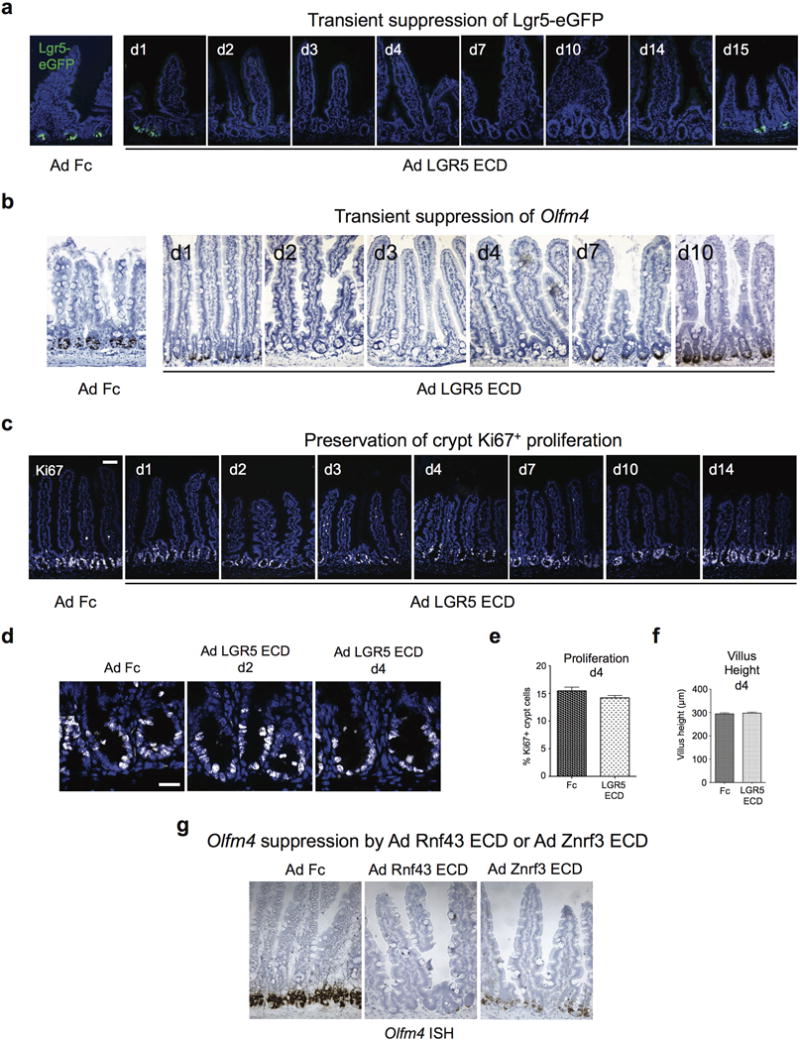
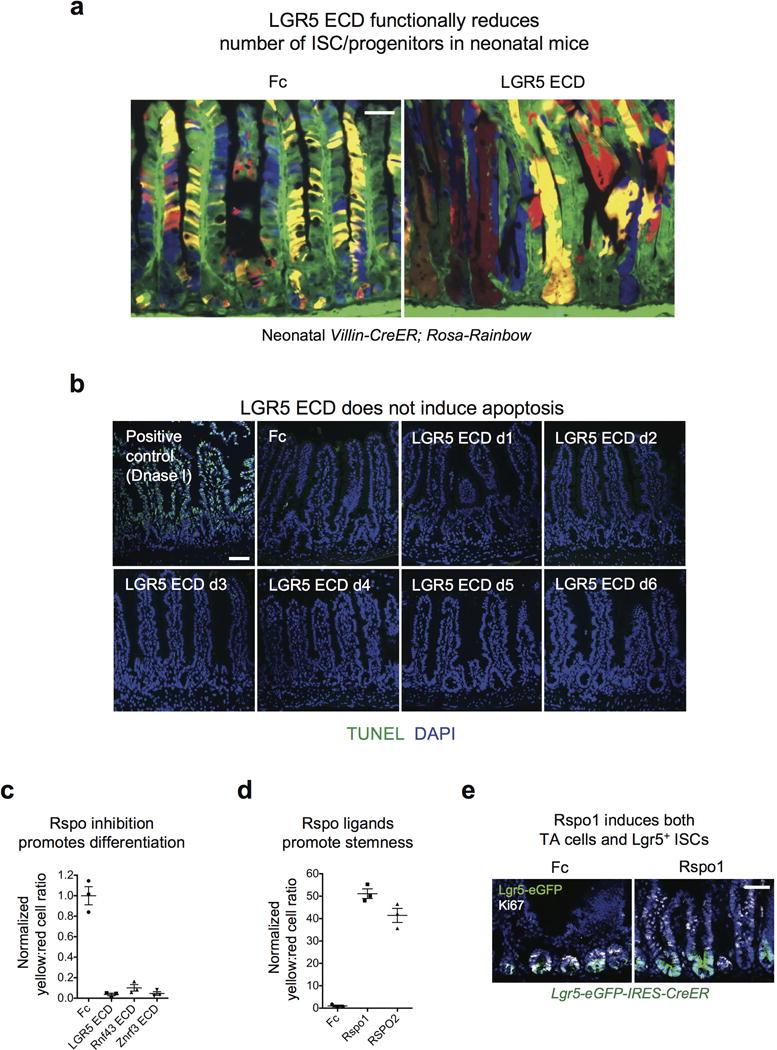
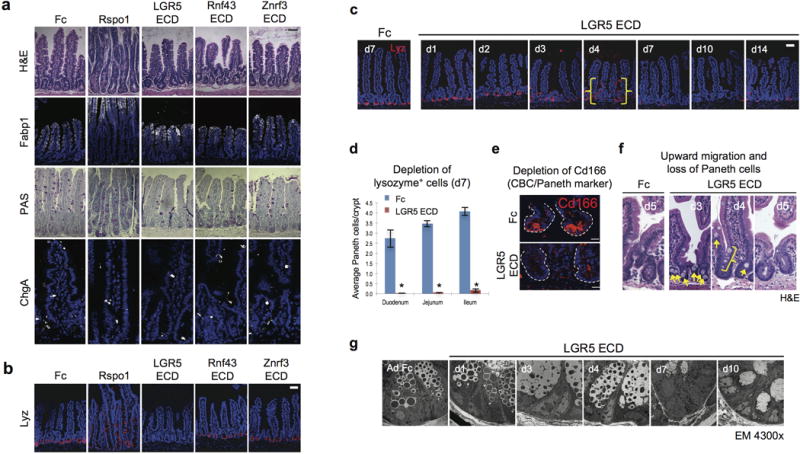
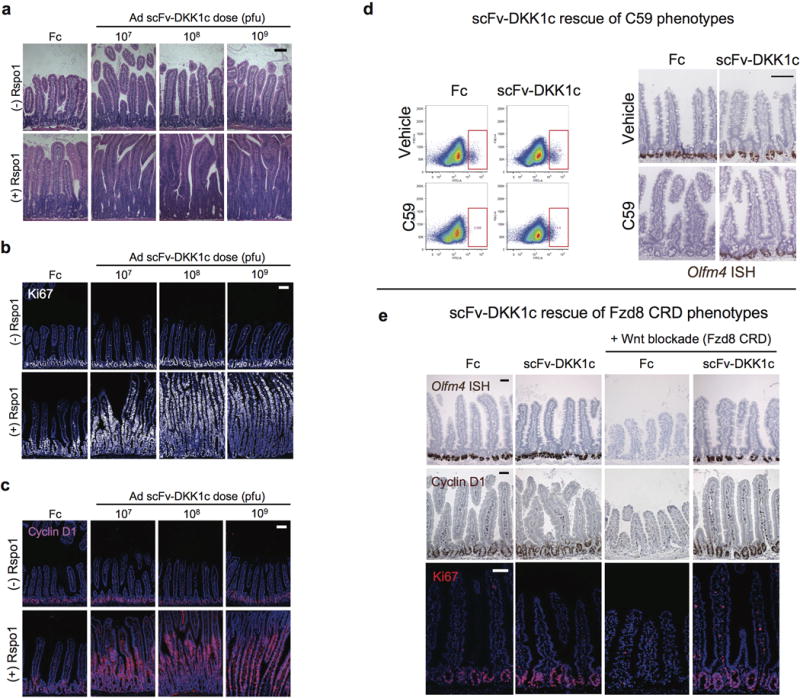
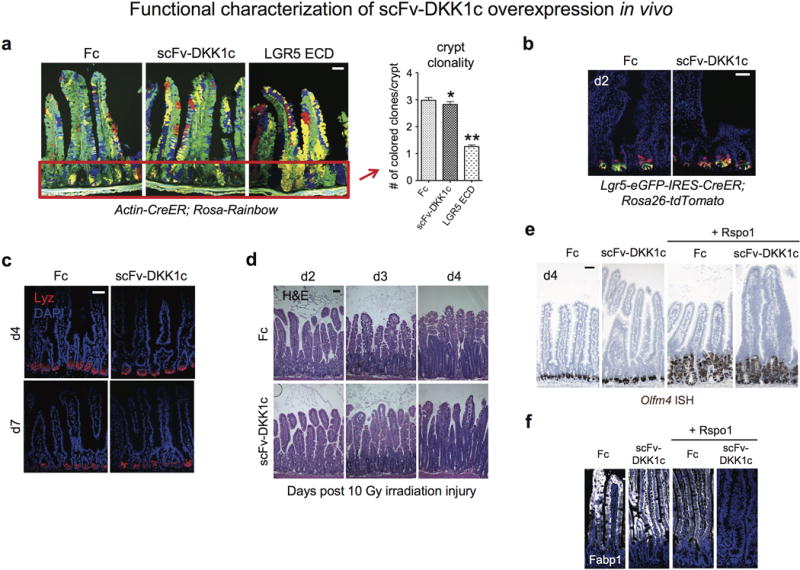
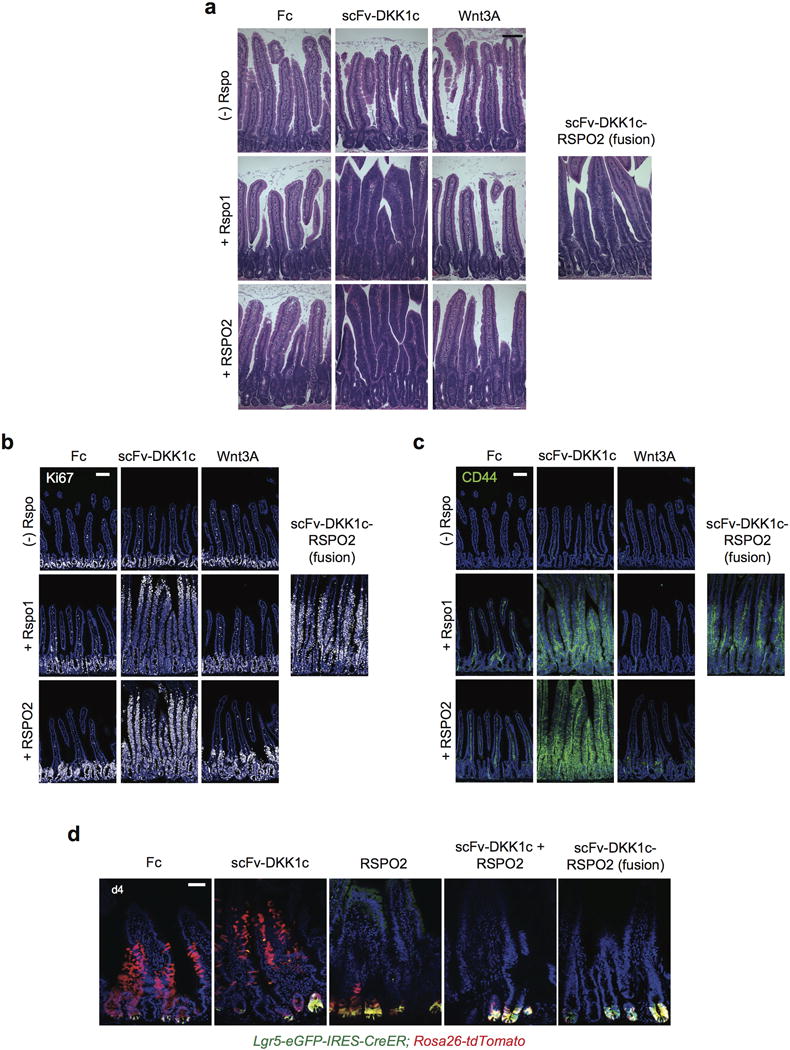
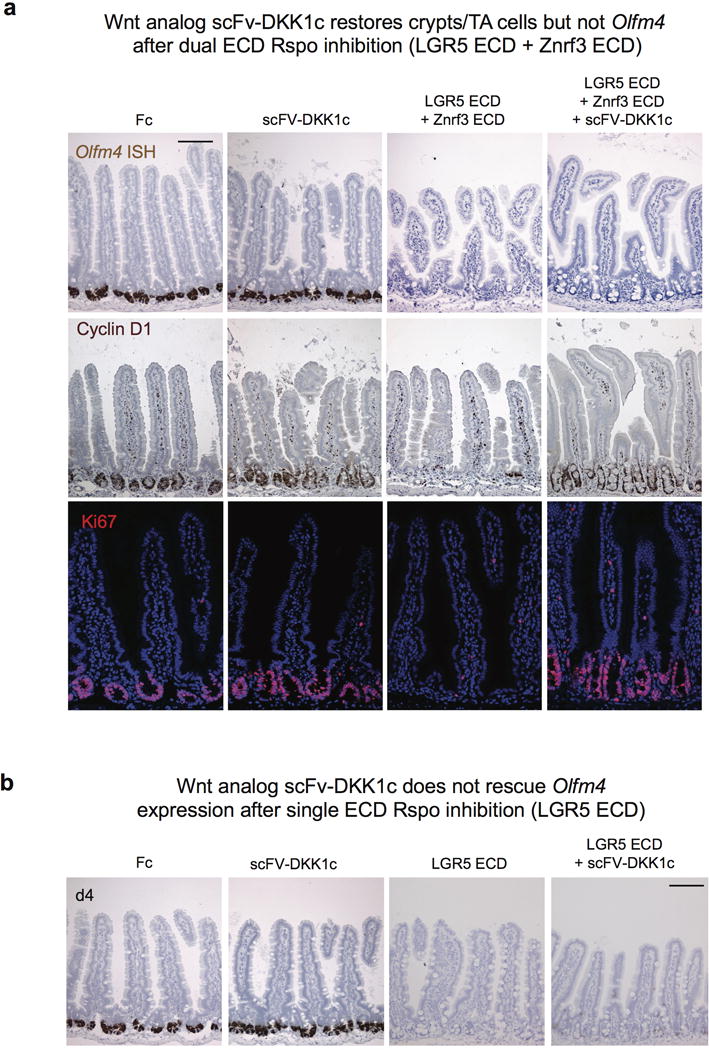
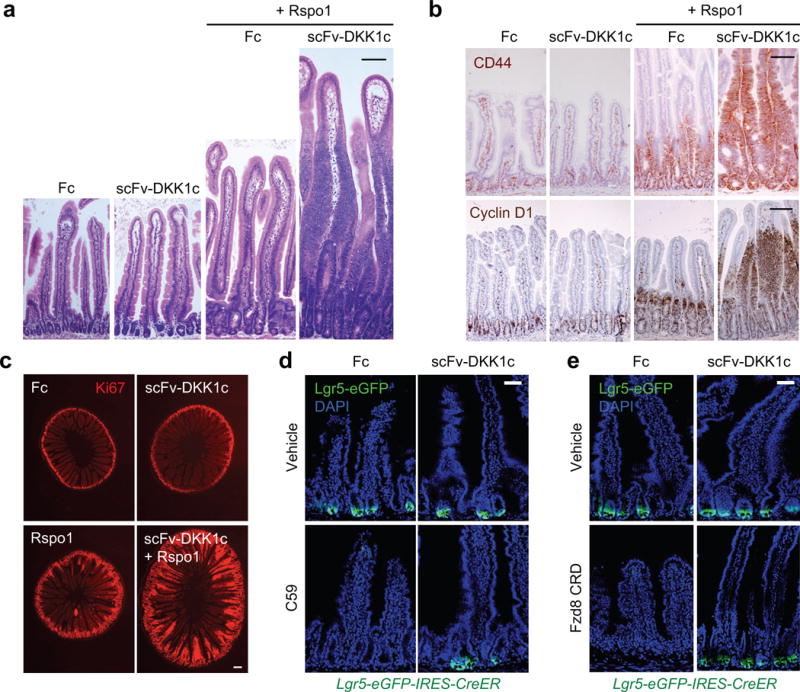
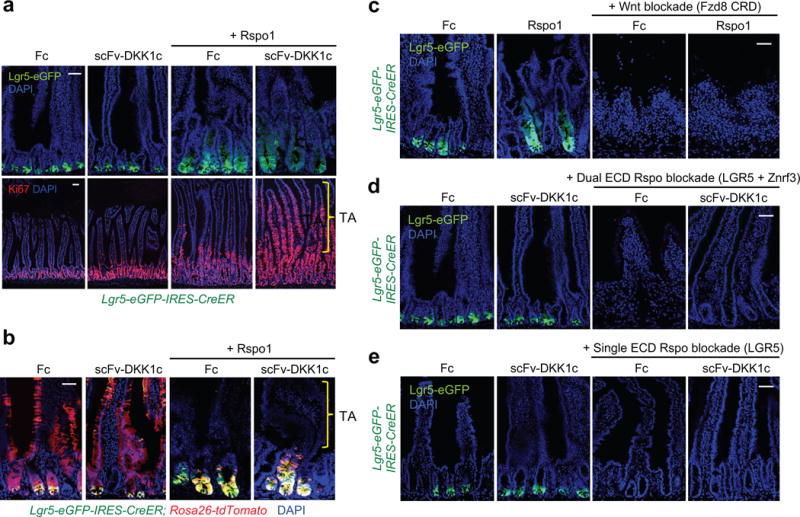
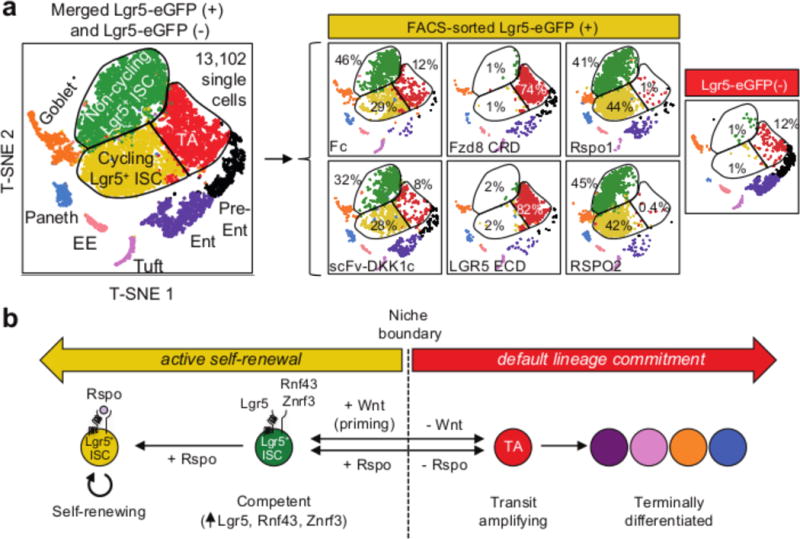
The canonical Wnt/β-catenin signalling pathway governs diverse developmental, homeostatic and pathological processes. Palmitoylated Wnt ligands engage cell-surface frizzled (FZD) receptors and LRP5 and LRP6 co-receptors, enabling β-catenin nuclear translocation and TCF/LEF-dependent gene transactivation. Mutations in Wnt downstream signalling components have revealed diverse functions thought to be carried out by Wnt ligands themselves. However, redundancy between the 19 mammalian Wnt proteins and 10 FZD receptors and Wnt hydrophobicity have made it difficult to attribute these functions directly to Wnt ligands. For example, individual mutations in Wnt ligands have not revealed homeostatic phenotypes in the intestinal epithelium-an archetypal canonical, Wnt pathway-dependent, rapidly self-renewing tissue, the regeneration of which is fueled by proliferative crypt Lgr5+ intestinal stem cells (ISCs). R-spondin ligands (RSPO1-RSPO4) engage distinct LGR4-LGR6, RNF43 and ZNRF3 receptor classes, markedly potentiate canonical Wnt/β-catenin signalling, and induce intestinal organoid growth in vitro and Lgr5+ ISCs in vivo. However, the interchangeability, functional cooperation and relative contributions of Wnt versus RSPO ligands to in vivo canonical Wnt signalling and ISC biology remain unknown. Here we identify the functional roles of Wnt and RSPO ligands in the intestinal crypt stem-cell niche. We show that the default fate of Lgr5+ ISCs is to differentiate, unless both RSPO and Wnt ligands are present. However, gain-of-function studies using RSPO ligands and a new non-lipidated Wnt analogue reveal that these ligands have qualitatively distinct, non-interchangeable roles in ISCs. Wnt proteins are unable to induce Lgr5+ ISC self-renewal, but instead confer a basal competency by maintaining RSPO receptor expression that enables RSPO ligands to actively drive and specify the extent of stem-cell expansion. This functionally non-equivalent yet cooperative interaction between Wnt and RSPO ligands establishes a molecular precedent for regulation of mammalian stem cells by distinct priming and self-renewal factors, with broad implications for precise control of tissue regeneration.


Conflict of interest statement

The authors declare competing financial interests. C.Y J., K C.G and C.J.K. are equity shareholders in Surrozen, Inc., which is developing bioengineered Wnt surrogates. G.X.Y.Z., J.M.T., P.B., S.B.Z., H.O., and T.S.M. are equity shareholders in 10x Genomics, Inc., which is developing genomics and single cell transcriptomics technologies.

Figures

Extended Data Fig. 1
Extended Data Fig. 1. Characterization of recombinant ectodomain proteins and adenoviruses for Rspo inhibition
a, Recombinant LGR5 ECD, Rnf43 ECD-Fc and Znrf3 ECD-Fc proteins purified by Ni-NTA affinity chromatography, Coomassie-stained SDS-PAGE. b, Top, Surface plasmon resonance analysis of LGR5 ECD binding to immobilized recombinant human RSPO1-4. Traces for RSPO1 are shown. Bottom, Binding of Rnf43 ECD-Fc or Znrf3 ECD-Fc to murine Rspo1-4. c,d, Recombinant LGR5 ECD inhibits recombinant human RSPO1 or recombinant murine Rspo1-4 in TOPflash Wnt reporter gene assay. Error bars represent S.E.M., *p<0.05. e, Recombinant Znrf3 ECD (murine Znrf3 ECD-Fc fusion) inhibits recombinant murine Rspo1-4 in TOPflash Wnt reporter assay. f, Recombinant Rnf43 ECD (murine Rnf43 ECD-Fc fusion) inhibits recombinant murine Rspo1-4 in TOPflash Wnt reporter assay. Error bars represent S.E.M. Low, med and high refer to 50:1, 250:1, 1000:1 molar ratios of the respective recombinant ECD to the appropriate Rspo protein. *p < 0.05 versus the appropriate no ECD condition. g, Time course of serum expression following single i.v. injection of adenoviruses into C57Bl/6 mice. Top, Anti-FLAG Western blot was performed on serum at the indicated times post- infection with Ad LGR5 ECD (FLAG-tagged). Middle, Time course of serum expression of Znrf3 ECD-Fc fusion following single i.v. injection of Ad Znrf3 ECD. Anti-IgG2α Fc Western blot. Bottom, Time course of serum expression of Rnf43 ECD-Fc fusion following single i.v. injection of Ad Rnf43 ECD into C57Bl/6 mice. Anti-IgG2α Fc Western blot. h, LGR5 ECD and Znrf3 ECD bind simultaneously and non-exclusively to RSPO. Structure of RSPO1 (residues 40–132) highlighting distinct LGR5 ECD and Znrf3/Rnf43 ECD binding interfaces. i, Schematic of yeast display FACS experiment in which human RSPO2 is displayed on the extracellular surface via Aga2-myc fusion. j–l, Unstained control for RSPO2 Furin1-Furin2 domain-expressing yeast (j) or stained individually with 500 nM LGR5 ECD-FLAG-His or Znrf3-Fc ECD (k,l). m,n, Yeast were also stained sequentially with 500 nM LGR5 ECD-FLAG-His, washed, and then stained with a mixture of 500 nM Znrf3 ECD-Fc + 500 nM LGR5 ECD-FLAG-His to prevent competition or dissociation of LGR5 ECD-FLAG-His. Znrf3 ECD-Fc was detected with Alexa Fluor 488-conjugated anti-mouse IgG. LGR5 ECD-FLAG-His was detected with Alexa Fluor 647-conjugated anti-FLAG (m). The order of this experiment was then reversed (Znrf3 ECD-Fc first, then Znrf3 ECD-Fc + LGR5 ECD-FLAG-His) (n). The ability of the Znrf3 and LGR5 ECDs to simultaneously bind to RSPO2 is shown by FACS staining in the upper right quadrant (light green shading) (m,n).
Extended Data Fig. 2
Extended Data Fig. 2. Time course of Ad LGR5 ECD-induced ablation of Lgr5+ ISCs
a, Lgr5-eGFP+ ISC signal is transiently lost from days 2–14 after single i.v. injection of Ad LGR5 ECD, correlating with duration of transgenic overexpression of LGR5 ECD in sera of mice. Note that LGR5 ECD does not ablate the crypt compartment despite loss of Lgr5-eGFP+ ISC signal. b, Crypt-based Olfm4 expression is transiently lost from days 2–7 after single i.v. injection of Ad LGR5 ECD. Olfm4 mRNA in situ hybridization. c, LGR5 ECD does not ablate crypt Ki67+ proliferation after Ad LGR5 ECD despite loss of Lgr5+ ISC signal. Bar = 50 mm. d, Higher magnification crypt images of Ki67+ cells after LGR5 ECD treatment. Bar = 20 mm. e, Quantitation of d. Error bars represent S.E.M., p=0.1215. f, Villus heights are not altered by LGR5 ECD. Error bars represent S.E.M., p=0.2971. g, Strong suppression of Olfm4 in situ hybridization is observed on day 3 following treatment of mice with either Ad Rnf43 ECD or Ad Znrf3 ECD. Jejunum is shown.
Extended Data Fig. 3
Extended Data Fig. 3. LGR5 ECD reduces ISC/progenitors but not via apoptosis
a, LGR5 ECD functionally reduces number of ISC/progenitors in neonatal mice. Multi-color clonal labeling of intestinal epithelial cells in jejunum of neonatal Villin-CreER; Rosa26-Rainbow mice, 8 days post-tamoxifen induction resulting in stochastic clonal labeling to one of four fluorescent colors and 7 days post-infection with Ad LGR5 ECD compared to control Ad Fc. Ad LGR5 ECD induced premature crypt monoclonality, reflecting a functional decrease in the number of clones functioning to repopulate the epithelium under conditions of Rspo inhibition, consistent with a marked reduction in ISC/progenitor number. Bars = 50 mm. b, LGR5 ECD does not induce apoptosis. TUNEL staining of jejunum at the indicated days after single i.v. injection of Ad LGR5 ECD into mice reveals absence of crypt apoptosis. Positive control TUNEL staining after DNase I treatment of sections is also shown. Bar = 50 mm. c, FACS quantitation of yellow:red (Lgr5+ ISC:differentiated) cell ratio from Fig. 2a. Error bars represent S.E.M. d, FACS quantitation of yellow:red (Lgr5+ ISC:differentiated) cell ratio from Fig. 2d, d4 post-treatment. Error bars represent S.E.M. e, Ad Rspo1 expands both Lgr5+ ISCs and Lgr5 Ki67+ proliferative crypt cells consistent with ISC and TA expansion. Bar = 50 mm.
Extended Data Fig. 4
Extended Data Fig. 4. Multi-lineage differentiation upon LGR5, Rnf43 or Znrf3 ECD treatment
a, Enterocyte, goblet and enteroendocrine differentiation are preserved upon LGR5, Rnf43 or Znrf3 ECD treatment. Adult mice received single i.v. injection of the indicated adenoviruses encoding soluble ECDs of LGR5, Rnf43 (Fc fusion) or Znrf3 (Fc fusion), or Rspo1 (Fc fusion) and the jejunum was analyzed at d7 after injection by H&E or histology with anti-Fabp1 (enterocyte), PAS (goblet) or anti-ChgA (enteroendocrine). Multi-lineage differentiation was maintained. b, LGR5 ECD but not Rnf43 ECD or Znrf3 ECD induces Paneth cell loss (d7 post-infection). Bars = 50 mm. c, LGR5 ECD induces transient Paneth cell loss. Time course of lysozyme expression in jejunum following single i.v. injection of Ad LGR5 ECD into mice. Bar = 50 mm. Note ballooning degeneration and upward migration of lysozyme+ Paneth cells at d3–4 (yellow brackets), followed by near-total Paneth cell loss at d7–10 and return of Paneth cells at d14 post-injection. The Paneth cell loss (after d3) occurs after the loss of Lgr5-eGFP signal (d2, Extended Data Fig. 2) and Paneth cell return correlates with the time course of disappearance of adenoviral LGR5 ECD serum expression (Extended Data Fig. 1g). d, Quantitation of Paneth cell loss in small intestine, d7, n=3 animals/condition, Error bars represent S.E.M., *= P<0.05. e, Ad LGR5 ECD induces loss of anti-Cd166 immunofluorescence (CBC/Paneth marker), jejunum, d7 after adenovirus treatment. f, H&E reveals ballooning degeneration and upward migration of lysozyme+ Paneth cells after Ad LGR5 ECD treatment (yellow brackets and arrows), consistent with an intermediate cell phenotype. g, Electron microscopy analysis of intestinal crypts after Ad LGR5 ECD i.v. injection reveals ballooning degeneration at d3–4 followed by Paneth cell loss by d7.
Extended Data Fig. 5
Extended Data Fig. 5. Wnt analog scFv-DKK1c functions via Fzd receptors to support Lgr5+ ISCs and can substitute for endogenous Wnts
a–c, Dose-dependent effects of Ad scFv-DKK1c +/− Ad Rspo1 on the intestinal epithelium. H&E of jejunum on d4 post-adenovirus treatment (a). Mice were treated with adenovirus titers of 10 to 10 pfu. Ki67+ proliferation of jejunum on d4 after adenovirus injection (b). Dose-dependent effects of scFv-DKK1c on Wnt target gene cyclin D1 (c). Jejunum, IF, d4 post-adenovirus. Bars = 100 mm. d, Wnt analog scFv-DKK1c functionally substitutes for endogenous Wnts in vivo to rescue Lgr5+ ISC from C59-mediated loss. Loss of Lgr5-eGFP reporter signal (red box) by FACS analysis (left) and Olfm4 expression (right) from jejunum of mice treated with the small molecule Porcn inhibitor C59. Adenoviral overexpression of scFv-DKK1c prevents C59-mediated ablation of the reporter signal. Mice were treated with C59 for a total of 4 days that began 2 days following adenovirus injection. Bar = 100 mm. e, Wnt analog scFv-DKK1c rescues in vivo phenotypes elicited by the Wnt antagonist Fzd8 CRD. Ad Fzd8 CRD-mediated loss of Olfm4 (top), Wnt target gene CD44 (middle) and Ki67+ crypt proliferation (bottom) are rescued by concomitant adenoviral overexpression of scFv-DKK1c. Jejunum, d4 following treatment with adenovirus. Bars = 50 mm.
Extended Data Fig. 6
Extended Data Fig. 6. Functional characterization of scFv-DKK1c overexpression in vivo
a, Crypt clonality in Actin-CreER; Rosa-Rainbow mice on d8 post-tamoxifen to clonally label cells and d7 post adenovirus injection. Recombinant adenovirus encoding either Fc, scFv-DKK1c or LGR5 ECD was adminstered as a single i.v. injection into mice. IF (left), Red box indicates an example of crypt areas used for quantitation. Bar = 50 mm. Quantitation of crypt clonality (right). Crypt clonality is not altered by scFv-DKK1c versus Fc control (*P=0.2854), whereas LGR5 ECD treatment quickly establishes crypt monoclonality (i.e. single color), ** P<0.0001. Error bars represent S.E.M. b, Lineage tracing kinetics of scFv-DKK1c treatment, d2 post simultaneous tamoxifen and adenovirus treatment. Bar = 50 mm. c, Paneth cell homeostasis is not perturbed by scFv-DKK1c overexpression. d4 and d7 post-adenovirus treatment, jejunum. Bars = 50 mm. d, Wnt analog scFv-DKK1c does not accelerate radiation injury-induced epithelial repair. H&E following 10 Gy total body irradiation injury. Jejunum. Mice were pre-treated with adenovirus encoding either Fc or scFv-DKK1c 2 days prior to 10 Gy irradation. Bar = 50 mm. e, Wnt analog scFv-DKK1c does not expand Olfm4+ ISCs. Olfm4 ISH demonstrates lack of Olfm4 expansion upon Ad scFv-DKK1c treatment compared to control and combinatorial treatment with Rspo1 does not expand Olfm4+ CBCs beyond the actions of Rspo1 alone. Jejunum, d4 post-treatment. Bar = 50 mm. f, Proliferative villus cells in Fig. 4a and Extended Data Fig. 6e do not express Fabp1 by IF staining.
Extended Data Fig. 7
Extended Data Fig. 7. Comparative effects of scFv-DKK1c, Wnt3A and scFV-DKK1c-RSPO2 adenoviruses on the intestinal epithelium
a–c, Mice were treated with adenovirus encoding either scFv-DKK1c or Wnt3A with or without Rspo1/2 or scFv-DKK1c-RSPO2 and tissue was harvested on d4 following treatment. The single chain polypeptide scFv-DKK1c-RSPO2 phenocopies combinatorial treatment with scFv-DKK1c + Rspo. The effects of scFv-DKK1c-RSPO2 were present in a proximal-distal gradient and were confined to the proximal small intestine, in contrast to the effects of scFv-Dkk1c + Rspo1 or scFv-DKK1c + RSPO2 which were pervasive throughout the small intestine. a, H&E of jejunum on D4 post-treatment. b, Ki67 IF. c, CD44 IF. a-c, Bars = 100 mm. d, Lgr5-eGFP-IRES-CreER; Rosa26-tdTomato mice were treated simultaneously with tamoxifen and i.v. adenovirus. Tissue was harvested on d4 post-treatment. Notably, neither treatment with combined scFv-DKK1c + RSPO2 nor the single chain polypeptide scFv-DKK1-RSPO2 alters the lineage tracing of Lgr5+ ISCs compared to RSPO2 alone. Bar = 50 mm.
Extended Data Fig. 8
Extended Data Fig. 8. Wnt analog scFv-DKK1c does not substitute for Rspo loss in vivo
a, Wnt analog scFv-DKK1c restores crypts but not Olfm4 after dual ECD Rspo inhibition (LGR5 ECD + Znrf3 ECD). Adenoviral overexpression of scFv-DKK1c does not rescue combined LGR5 ECD and Znrf3 ECD-mediated loss of Olfm4 expression (top), despite reversing loss of the Wnt target gene cyclin D1 (middle) as well as Ki67+ crypt proliferation (bottom). Jejunum, d4 following treatment. Bar = 100 mm. b, Wnt analog scFv-DKK1c does not rescue Olfm4 expression after single ECD Rspo inhibition (LGR5 ECD). Olfm4 ISH, jejunum, d4 following treatment with adenovirus. Bar = 100 mm.
Extended Data Figure 9
Extended Data Figure 9. Single-cell RNA-seq PCA and clustering
a–f, Single-cell RNA-seq QC metrics used to filter out cells before PCA and clustering. a, Distribution of number of genes detected per cell. Cells with more than 400 genes, but less than 4400 genes were selected for PCA analysis (red dashed lines). b, Distribution of number of UMIs detected per cell. Cells with more than 861 UMIs, but less than 13250 UMIs were selected for PCA analysis (red dashed lines). c, Distribution of percentage of mitochondria UMIs per cell. Cells with less than 10% mitochondrial UMIs were selected for PCA analysis (red dashed lines). d, Number of genes and percentage of mitochondria UMIs detected per cell. e, Number of genes and UMIs detected per cell. f, Standard deviation of PC. g–h, 9 distinct clusters were detected among >13,000 single cells analyzed by single cell RNA-seq. g, T-SNE projection of single cells, colored by inferred cell type assignment. h, Normalized expression (centered) of the top variable genes (rows) from each of 9 clusters (columns) is shown in a heatmap. Numbers at the top indicate cluster number in g, with connecting lines indicating the hierarchical relationship between clusters. Gene symbols of markers from each cluster are shown on the right.
Extended Data Fig. 10
Extended Data Fig. 10. Gene expression of additional marker genes in single cell RNA-seq clusters upon Wnt versus Rspo modulation in vivo
a, Reproduction of Fig. 5a for reference. b, T-SNE projection of >13,000 single cells divided over the 7 conditions, with each cell colored based on their normalized expression of the indicated genes. UMI normalization was performed by first dividing UMI counts by the total UMI counts in each cell, followed by multiplication with the median of the total UMI counts across cells and calculation of the natural log of the UMI counts. Finally, each gene was normalized such that the mean signal for each gene is 0, and standard deviation is 1. Note repression of CBC identify genes (Lgr5, Ascl2, Olfm4, Rnf43), and Axin2 by LGR5 ECD and Fzd8 CRD. Further, Mki67 and Tuba1b are expressed in cycling Lgr5+ ISC and TA cells but not non-cycling Lgr5+ ISC at homeostasis (Fc) but are restricted only to TA cells after LGR5 ECD and Fzd8 CRD. c, Similar T-SNE analysis of Fig. 5a for additional loci of interest (Lgr4, Tnfrsf19, Znrf3, Hist1h1b, Fzd2, Fzd7, Lrp5 and Lrp6). d, Normalized expression (centered) of the top variable genes (rows) of each sample (columns) against Fc from Fig. 5a is shown in a heatmap. Sample numbers are shown at the top, with connecting lines indicating the hierarchical relationship between samples (based on the top variable genes identified). Gene symbols of markers from each cluster are shown on the right. “Fc_neg” indicates the Lgr5-eGFP(−) population from an Ad Fc-treated mouse.
Figure 1
Figure 1. Pan-Rspo inhibition by systemic overexpression of LGR5, Rnf43 or Znrf3 ECDs
a, Top: Rspo inhibition by adenoviral expression of LGR5, Rnf43 or Znrf3 ECDs ablates Lgr5-eGFP but preserves crypts in Lgr5-eGFP-IRES-CreER mice. Dual ECD treatment (LGR5 ECD + Rnf43 or LGR5 ECD + Znrf3 ECD), or Wnt inhibition with Dkk1 all induce loss of both Lgr5-eGFP+ cells and crypts. Concomitant Ad Rspo1 treatment rescues dual ECD combinations but not Dkk1. Jejunum. Bottom: H&E. b, Top: LGR5 ECD abrogates transgenic Lgr5-LacZ+ signal. Jejunum. Bottom: LGR5 ECD represses Olfm4, in situ hybridization. c, Ad LGR5 ECD or Rnf43 ECD accelerates crypt monoclonality in adult Villin-CreER; Rosa26-Rainbow jejunum, d8 post-tamoxifen and d7 after Ad LGR5 ECD, Rnf43 ECD or Fc infection. d, Single but not dual ECD Rspo inhibition preserves Ki67+ crypt proliferation (top) and crypts and basal Wnt signaling in Axin2-LacZ Wnt reporter mice (bottom). Jejunum. Bars = 50 μm. Images are representative of n=3 mice per condition, and all experiments were repeated at least twice.
Figure 2
Figure 2. Lineage tracing of Lgr5-eGFP+ ISCs upon systemic Rspo inhibition versus overexpression
a, Ad LGR5, Rnf43 or Znrf3 ECDs ablate Lgr5-eGFP reporter signal and induce precocious Lgr5+ ISC villus lineage tracing Lgr5-eGFP-IRES-CreER; Rosa26-tdTomato mice, d2 after adenovirus and tamoxifen. b, Multi-lineage differentiation in d7 LGR5 ECD-induced tdTomato+ lineage stripes. c, RNA-seq heatmap of reciprocal changes in FACS-sorted Lgr5-eGFP+ cells, d1.5 after Ad Rspo1 or Ad LGR5 ECD, Lgr5-eGFP-IRES-CreER mice. d, Ad Rspo1 or Ad RSPO2 both expand Lgr5+ ISCs, whose lineage traces are profoundly crypt-confined with striking repression of red progeny and villus lineage tracing. In contrast, Ad LGR5 ECD ablates Lgr5-eGFP expression and drives premature Lgr5+ ISC lineage tracing. Lgr5-eGFP-IRES-CreER; Rosa26-tdTomato duodenum, d2–7. Bars = 50 μm. In a–d, tamoxifen was given at day 0. All experiments used n=3 mice per condition and were repeated at least twice, except for c, which used n=2–3 mice per condition and performed once.
Figure 3
Figure 3. Wnt analog scFv-DKK1c synergizes with Rspo to activate intestinal proliferation and substitutes for endogenous Wnts to maintain Lgr5+ ISCs
a, Ad scFv-DKK1c does not perturb intestinal homeostasis by itself but markedly synergizes with Ad Rspo1 to induce villus proliferation. H&E, jejunum, d7 post-adenovirus. Bar = 100 μm. b, Top, CD44 IHC. Bottom, cyclin D1 IHC. D4 after adenovirus, jejunum. Bar = 100 μm. c, Ki67 immunofluorescence, d7 post-adenovirus, jejunum. Bar = 200 μm. d, scFv-DKK1c substitutes for endogenous Wnt in Porcn inhibitor C59-treated Lgr5-eGFP-IRES-CreER mice. Lgr5-eGFP reporter signal. Jejunum, d6 post-adenovirus and d4 of C59 treatment. Bar = 50 μm. e, scFv-DKK1c efficiently rescues Lgr5+ ISC depletion and crypt loss elicited by Ad Fzd8 CRD. Lgr5-eGFP-IRES-CreER mice, d4 post-adenovirus, jejunum. Bar = 50 μm. All experiments used n=3 mice per condition and were repeated at least twice.
Figure 4
Figure 4. Wnt ligands cannot augment Lgr5+ ISC number or substitute for Rspo but are required to prime ISCs for Rspo action
a, scFv-DKK1c does not induce Lgr5+ ISCs by itself or in combination with Rspo despite synergistic induction of villus proliferation. Top, Lgr5-eGFP-IRES-CreER reporter. Bottom, Ki67 IF. D7 post-adenovirus, jejunum. b, Wnt ligand augmentation by Ad scFv-DKK1c does not alter Lgr5+ ISC lineage tracing either by itself or in combination with Rspo1. Jejunum of Lgr5-eGFP-IRES-CreER; tdTomato mice, d4 following simultaneous administration of adenovirus and tamoxifen. c, Rspo1 treatment cannot rescue Lgr5+ ISC loss after Fzd8 ECD-mediated Wnt sequestration. d–e, scFv-DKK1c cannot rescue loss of Lgr5+ ISC or crypts after (d) dual Rspo blockade via LGR5 ECD + Znrf3 ECD or (e) single Rspo blockade via LGR5 ECD. c-e are d4 post-adenovirus, jejunum, Lgr5-eGFP-IRES-CreER mice. Bars = 50 μm. All experiments used n=3 mice per condition and were repeated at least twice.
Figure 5
Figure 5. Single-cell transcriptomics of FACS-sorted Lgr5-eGFP(+) cells following in vivo Wnt versus Rspo modulation
a, (Left) T-SNE projection of 13,102 single cells, colored by inferred cell type, comprised of 11,177 FACS-sorted Lgr5-eGFP(+) and 1,925 Lgr5-eGFP(−) cells. (Right) T-SNE projection of the 13,102 single cells segregated by 6 Lgr5-eGFP(+) cell treatment conditions and Lgr5-eGFP(−) control; % cells in non-cycling Lgr5(+) ISCs, cycling Lgr5(+) ISCs and TA clusters are indicated. b, Proposed model.

Comment in

References

    1. Clevers H, Loh KM, Nusse R. Stem cell signaling. An integral program for tissue renewal and regeneration: Wnt signaling and stem cell control. Science. 2014;346:1248012. doi:346/6205/1248012 [pii] 10.1126/science.1248012 [doi] - PubMed
    1. Willert K, et al. Wnt proteins are lipid-modified and can act as stem cell growth factors. Nature. 2003;423:448–452. - PubMed
    1. Janda CY, Waghray D, Levin AM, Thomas C, Garcia KC. Structural basis of Wnt recognition by Frizzled. Science. 2012;337:59–64. doi:science.1222879 [pii] 10.1126/science.1222879 [doi] - PMC - PubMed
    1. Miyoshi H, Ajima R, Luo CT, Yamaguchi TP, Stappenbeck TS. Wnt5a potentiates TGF-beta signaling to promote colonic crypt regeneration after tissue injury. Science. 2012;338:108–113. doi:science.1223821 [pii] 10.1126/science.1223821 [doi] - PMC - PubMed
    1. Pinto D, Gregorieff A, Begthel H, Clevers H. Canonical Wnt signals are essential for homeostasis of the intestinal epithelium. Genes Dev. 2003;17:1709–1713. - PMC - PubMed

METHODS REFERENCES

    1. Wei K, et al. A liver Hif-2alpha-Irs2 pathway sensitizes hepatic insulin signaling and is modulated by Vegf inhibition. Nat Med. 2013;19:1331–1337. doi:nm.3295 [pii] 10.1038/nm.3295 [doi] - PMC - PubMed
    1. Levin TG, et al. Characterization of the intestinal cancer stem cell marker CD166 in the human and mouse gastrointestinal tract. Gastroenterology. 2010;139:2072–2082 e2075. doi:S0016-5085(10)01303-X [pii] 10.1053/j.gastro.2010.08.053 [doi] - PMC - PubMed
    1. Proffitt KD, et al. Pharmacological inhibition of the Wnt acyltransferase PORCN prevents growth of WNT-driven mammary cancer. Cancer research. 2013;73:502–507. doi: 10.1158/0008-5472.CAN-12-2258. - DOI - PubMed
    1. Chao G, et al. Isolating and engineering human antibodies using yeast surface display. Nature protocols. 2006;1:755–768. doi: 10.1038/nprot.2006.94. - DOI - PubMed
    1. Trapnell C, Pachter L, Salzberg SL. TopHat: discovering splice junctions with RNA-Seq. Bioinformatics. 2009;25:1105–1111. doi: 10.1093/bioinformatics/btp120. - DOI - PMC - PubMed

Publication types

MeSH terms