. 2017 May 11;545(7653):219-223.
doi: 10.1038/nature22073. Epub 2017 May 3.

Thalamic amplification of cortical connectivity sustains attentional control

Affiliations

Thalamic amplification of cortical connectivity sustains attentional control

L Ian Schmitt et al. Nature. .

Abstract

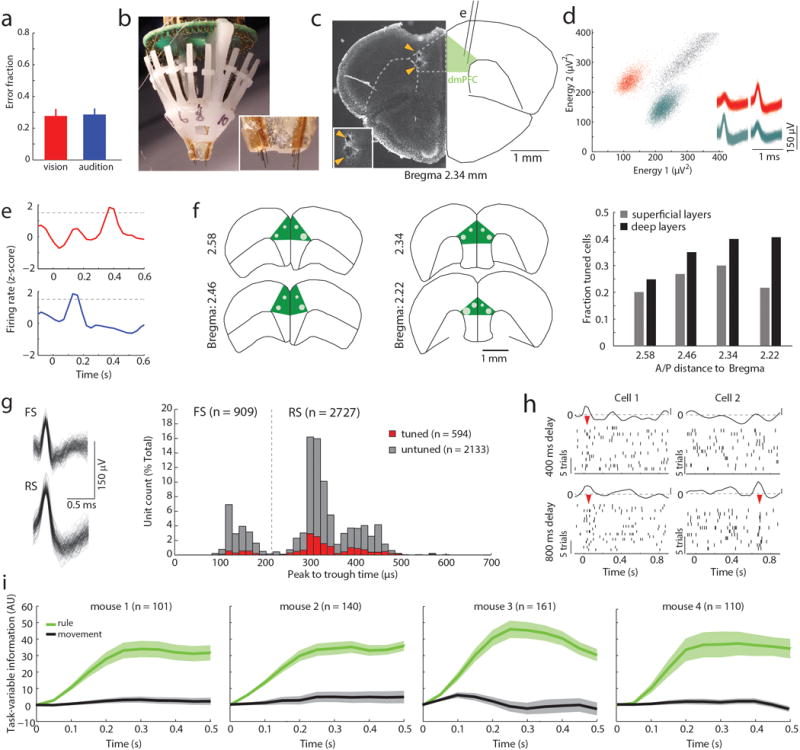
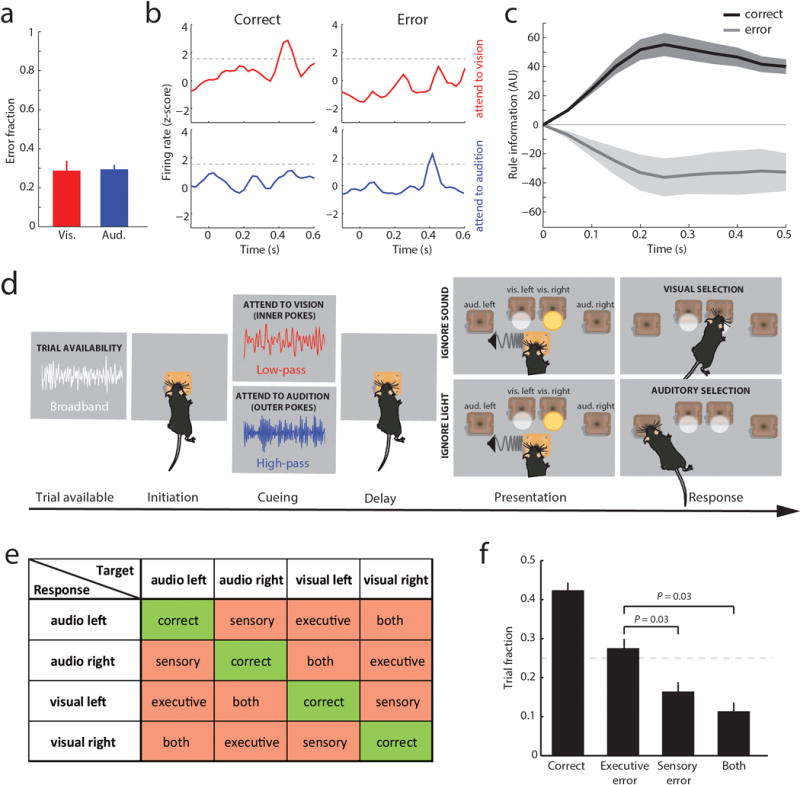
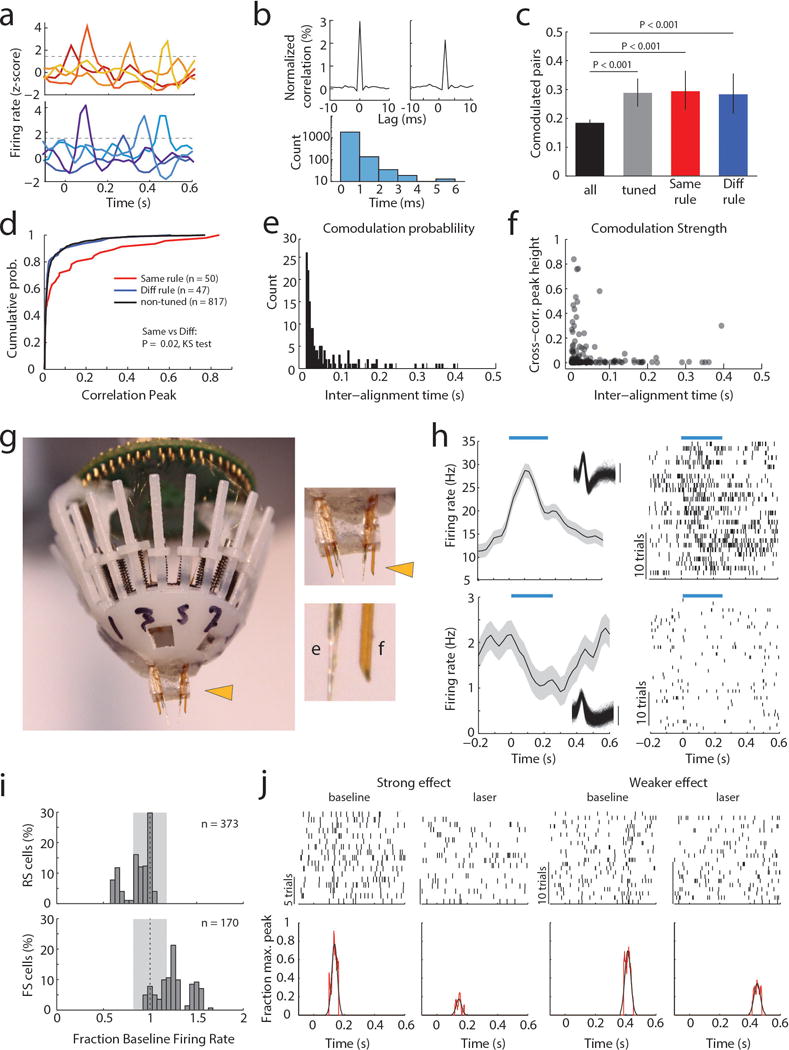
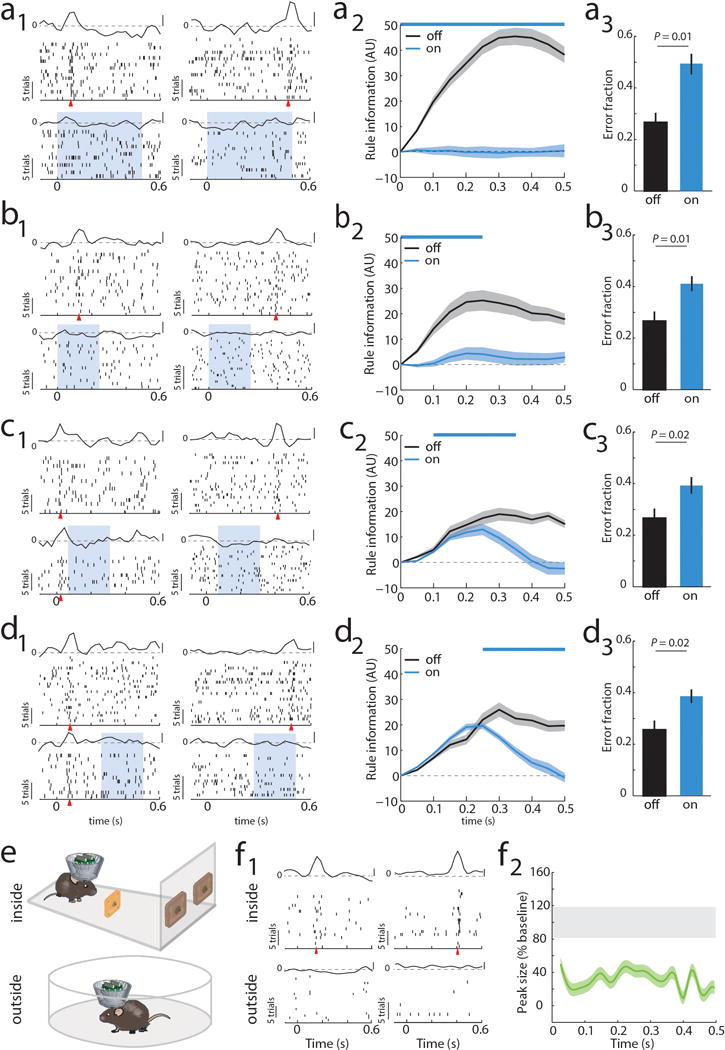
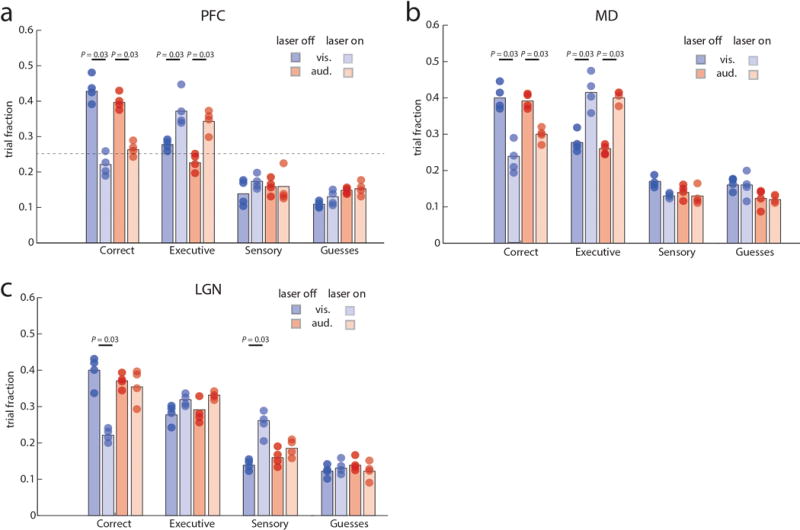
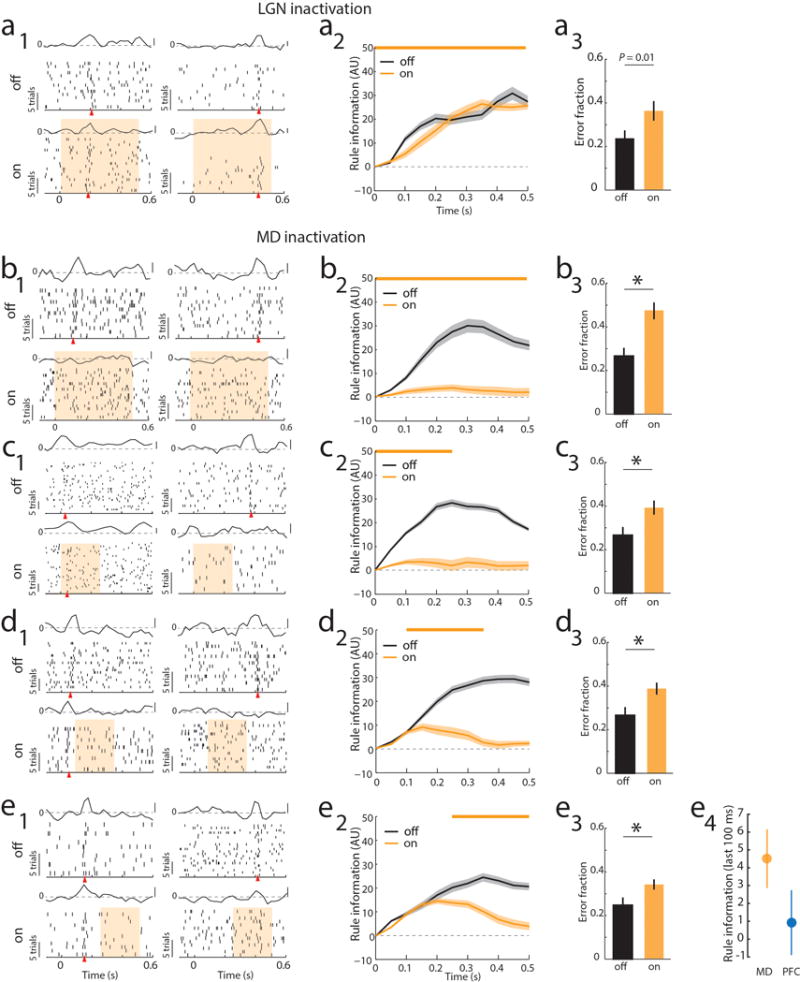
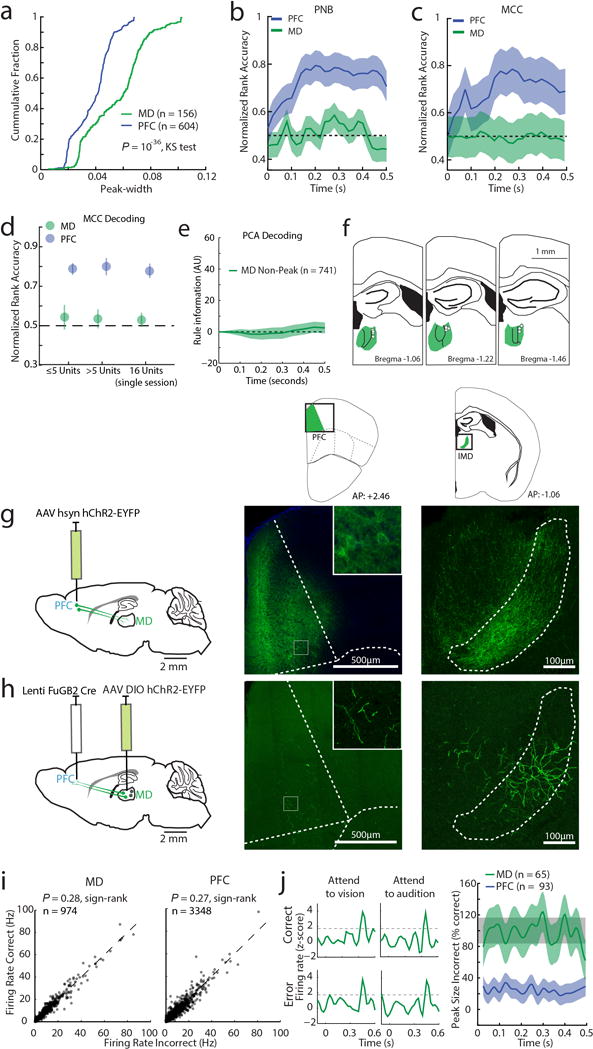
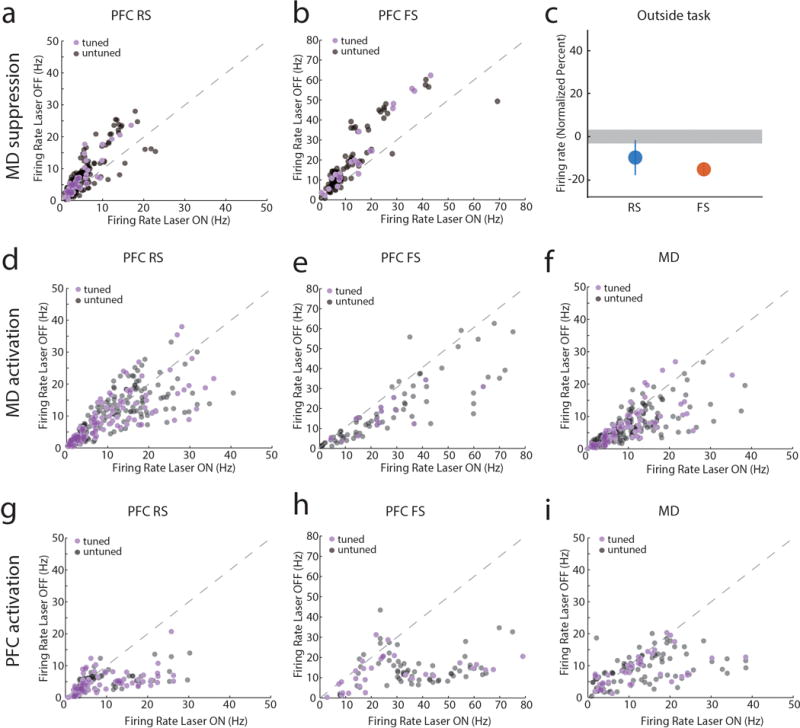
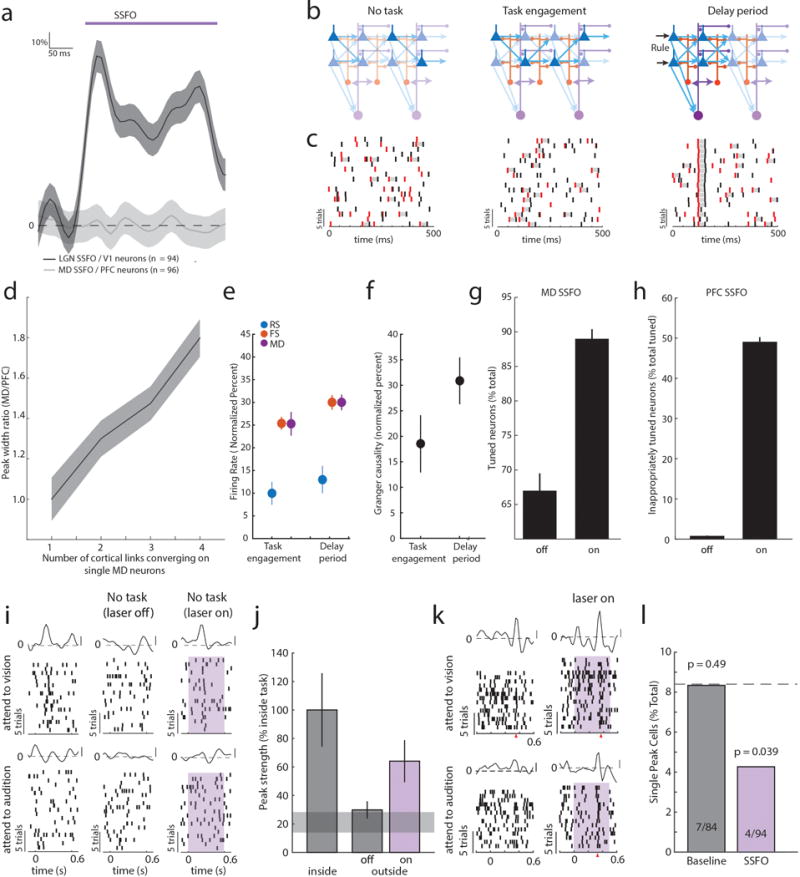
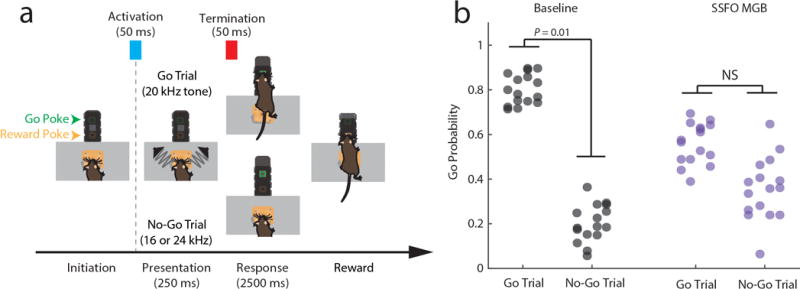
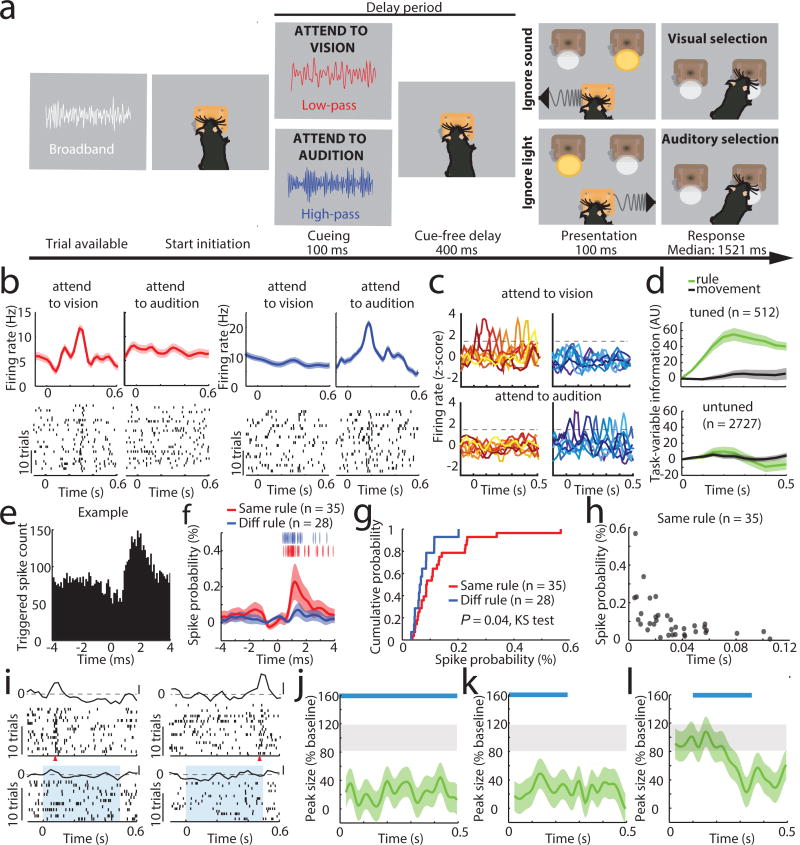
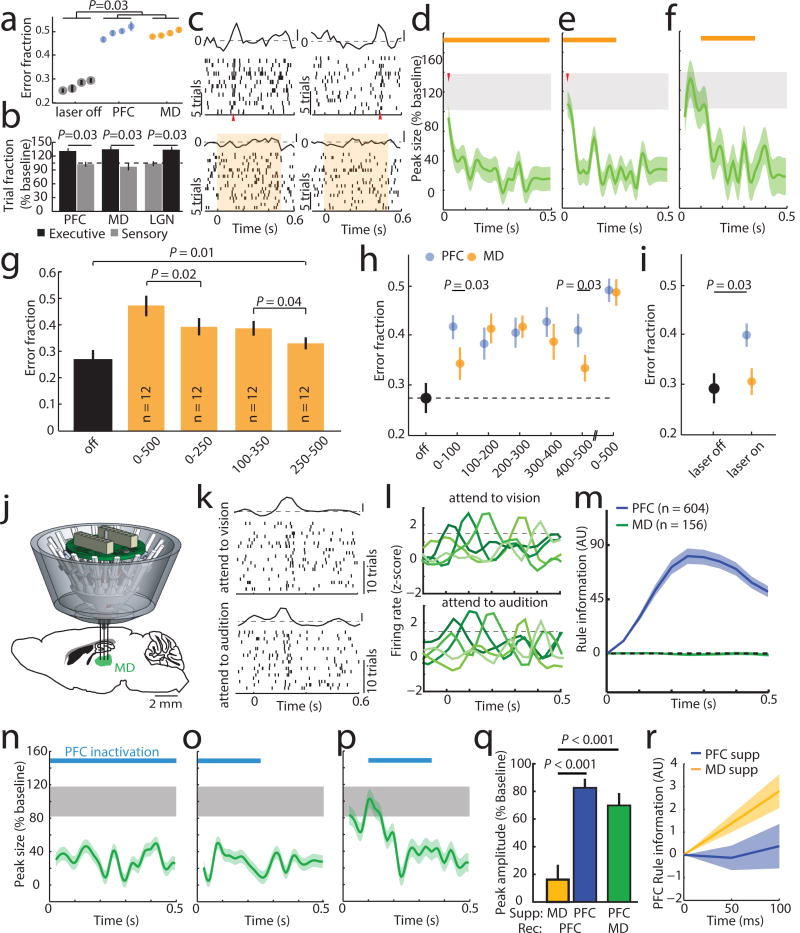
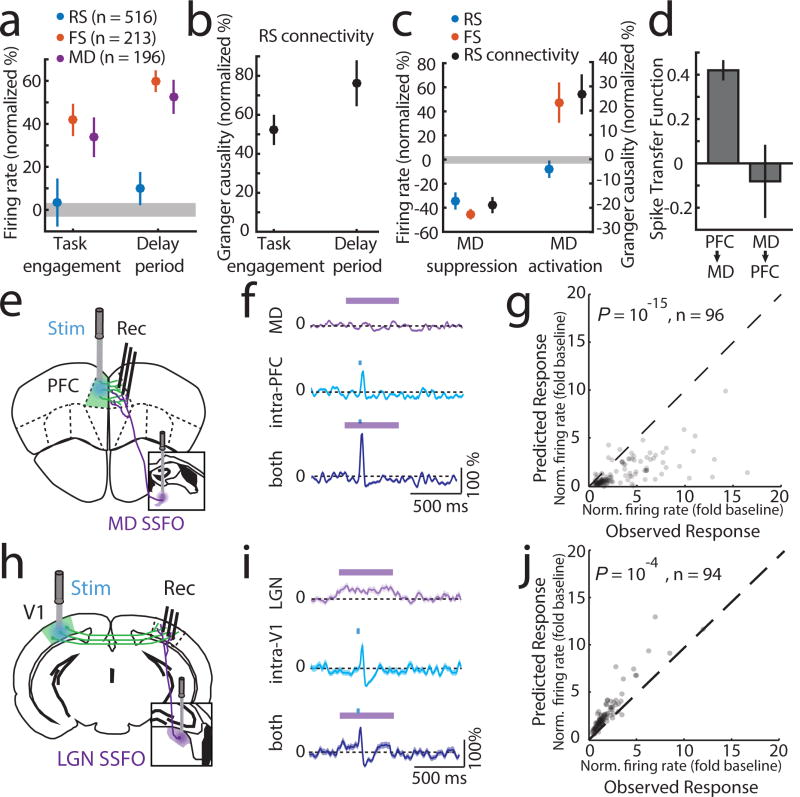
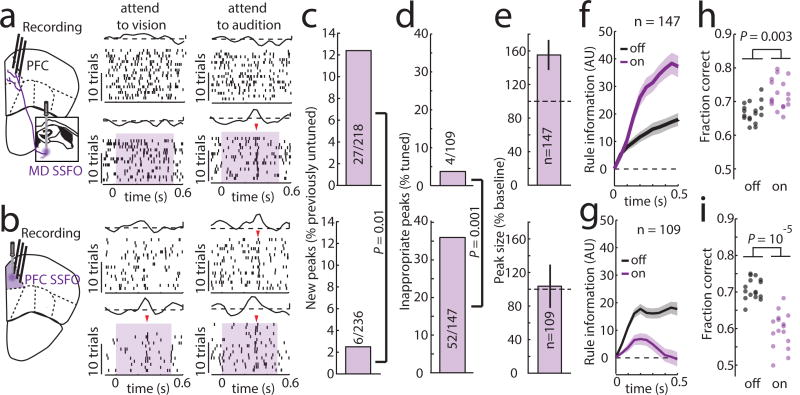
Although interactions between the thalamus and cortex are critical for cognitive function, the exact contribution of the thalamus to these interactions remains unclear. Recent studies have shown diverse connectivity patterns across the thalamus, but whether this diversity translates to thalamic functions beyond relaying information to or between cortical regions is unknown. Here we show, by investigating the representation of two rules used to guide attention in the mouse prefrontal cortex (PFC), that the mediodorsal thalamus sustains these representations without relaying categorical information. Specifically, mediodorsal input amplifies local PFC connectivity, enabling rule-specific neural sequences to emerge and thereby maintain rule representations. Consistent with this notion, broadly enhancing PFC excitability diminishes rule specificity and behavioural performance, whereas enhancing mediodorsal excitability improves both. Overall, our results define a previously unknown principle in neuroscience; thalamic control of functional cortical connectivity. This function, which is dissociable from categorical information relay, indicates that the thalamus has a much broader role in cognition than previously thought.


Conflict of interest statement

Conflict of interest

The authors declare no conflict of interest.

Figures

Extended Data Figure 1
Extended Data Figure 1. Behavioral and electrophysiological features reflected in the 2 AFC task
(a) Mice display equal performance across trial types (n = 4 mice, p = 0.52, Wilcoxon rank-sum). (b) Multi-electrode implant used for PFC neural recordings. Inset: magnification showing electrodes. (c) Postmortem histology in an example brain showing electrode tip locations (arrowheads). (d) Example of spike sorting in energy space to identify single units. Two identified clusters reflect two single units (color coded). Inset: Corresponding spike-waveforms. (e) In 17% of rule-tuned cells, tuning is observed for both task rules (example PSTHs shown), albeit with distinct temporal offsets during the delay. (f) Schematic showing electrode locations from which rule-tuned neurons (white dots) were recorded, illustrating that they are most frequently found in deeper layers. Dot sizes are scaled in proportion to the number of tuned neurons found at that location (n = 594 cells from 4 mice). (g) Fast spiking (FS) and regular spiking (RS) neurons are identified based on the peak to trough time of their spike waveform (left: example waveforms, right: peak to through time histogram, dashed line represents cut off for FS - RS classification,). (h) Example rasters and PSTHs for two cells during delay periods of either 400 or 800 ms, randomized within the same recording session. In the first, an early peak is present in both conditions (left) while in the other a late peak is only evident in the 800 ms condition (right). (i) Task-variable information for each mouse of our first cohort (‘manipulation free’). Task-variable information is based on PCA from the divergence of population activity of task modulated PFC neurons on the axis associated with each variable (see methods) and is highly informative for task rule (green) but contains no information about movement (side selection, grey). Shaded areas indicate the bootstrapped 95% confidence intervals.
Extended Data Figure 2
Extended Data Figure 2. Behavioral errors are primarily driven by inappropriate rule encoding
(a) Mice show comparable performance on trials with one target modality presented compared to performance in conflict trials (n = 4 mice, P = 0.81). (b) Example PSTHs of a neuron whose appropriate tuning to the ‘attend to vision’ rule is observed in error trials of the ‘attend to audition’ rule. (c) Rule information derived from PCA of sessions in which sufficient numbers of errors allowed for their analysis (93 neurons, 18 sessions from 4 mice) show that they contain information about the other rule; directionality of rule-related axis in error trials are along the same axis used in correct trials (see methods). Shaded areas indicate bootstrapped 95% CIs. (d) Schematic of the 4-alternative forced choice (4AFC) task developed to distinguish between errors related to rule encoding (executive) and those related to target cue perception (sensory, see methods). Visual and auditory targets are reported at different response port pairs (inner versus outer), making it possible to distinguish between outcomes in which the animal makes a selection based on prior cueing, the spatial location of sensory targets, both, only one or neither (e) 4AFC task outcomes illustrated in a confusion matrix showing outcomes conditional upon sensory target modality and location. Note that sensory conflict is not specified for these trials, as it can be either spatially congruent or in conflict with the appropriate target (f) Executive errors represent the majority of those observed, accounting for about 50% of all errors across mice (n = 4 mice). Dashed line represents chance performance (25%). All behavioral data was compared using Wilcoxon rank-sum test.
Extended Data Figure 3
Extended Data Figure 3. Combining PFC recordings with local optogenetic control of inhibitory interneurons
(a) Tuning peak examples of multiple PFC neurons simultaneously recorded in a single recording session.  Tuning peaks associated with either rule occur at multiple times across the delay period in different neurons suggesting precisely timed, sequential activation.  (b) Top: Two examples of a short-latency cross-correlation (shuffle corrected; see methods) observed between pairs of tuned neurons. Bottom: Histogram of cross-correlation peak times (n = 914 pairs). (c) Increased connection probability between tuned neurons (all: 914 pairs, tuned: 97 pairs, same rule: 50 pairs, diff rule: 47 pairs, comparison with binomial test).  (d)  Cross-correlation strength is significantly greater for neurons representing the same rule. (e) Co-modulation probability and (f) strength show dependence on temporal distance between tuning peaks among same rule-representing pairs (n = 138). (g) Photograph of a multi-electrode implant used to record from PFC with simultaneous optogenetic manipulation. Inset: top, enlargement of the drive component targeting bilateral PFC with optic fibers and electrodes; bottom, enlargement showing electrodes and optic fiber for one hemisphere. (h) Examples of an FS neuron that is driven (top) and an RS neuron that is inhibited (bottom) by exposure to blue light (blue bar, 473 nm). (i) Quantification of laser effects on FS and RS cell firing rate shows that this holds true at the population level (albeit with the population mean of RS being generally smaller than the example). Grey shading represents 95% CI of the no laser condition. (j) Top: example task-modulated spike rasters showing laser effect on tuning peak. Bottom: Visualization of peak strength measure for these examples (see methods).
Extended Data Figure 4
Extended Data Figure 4. Causal evidence for task-specific sequential PFC activity maintaining rule representation
(a) Impact of bilateral optogenetic enhancement of local inhibition on PFC rule tuning and behavior. (a1) Raster and PSTH examples of neurons tuned either early or late in the delay (blue shading indicates laser presentation), shows loss of tuning with minimal impact on overall spiking (see Extended Data Figure 3i for quantification of laser on spike rates). (a2) Laser impact on population tuning measured by averaged peak sizes over the delay (n = 94 neurons, 3 mice; example quantification in Extended Data Figure 3j; see method for peak quantification) (a3) Laser impact on population rule information from the same neurons in a2. (a4) Laser impact on behavior (n = 12 sessions; 4 from each mouse) (b-d) Temporally-limited optogenetic manipulations show that later PFC tuning is dependent on early tuning. (b) Manipulation limited to the first 250 ms is sufficient to mimic effect of full delay period suppression on neural tuning with a smaller impact on behavior likely due to a smaller laser dose and being close to the optical fibers (n = 52 neurons, 12 sessions). (c) Effect in b persists even when rule presentation period is spared (n = 46 neurons, 12 sessions). (d) Late laser only impacts late activity (n = 53 neurons, 12 sessions). (e) Cartoon of experimental comparison of the effect of sensory selection rule presentation inside and outside of the task. (f1) Example of two neurons that display tuning following rule-related cue presentation inside the task but not outside of it. (f2) Group quantification for population tuning in f1 (n = 52 neurons from 3 mice). For peak size, shaded error regions show the 95% CIs of the measure, while the gray bar denotes the subsampled bootstrapped 95% CIs for baseline error estimate. For rule information shaded areas indicate bootstrapped 95% CIs. Wilcoxon rank-sum test was used for all behavioral comparisons.
Extended Data Figure 5
Extended Data Figure 5. Optogenetic dissection of error types in the 4AFC task
(a) Inactivation of PFC in four VGAT-ChR2 mice during the delay period specifically increases executive errors while sensory errors remain comparable. (b) MD inhibition leads to a similar increase in executive errors. (c) In contrast, LGN inactivation specifically increases sensory errors in ‘attend to vision’ trials while executive errors remain comparable. Colored bars show median values and dots represent average performance of each mouse (4–5 sessions per mouse. Error bars were not included for visual clarity. Wilcoxon rank-sum test was used for all comparisons.
Extended Data Figure 6
Extended Data Figure 6. MD recruitment by PFC is related to delay period length in the 2AFC task
(a) Bilateral optogenetic LGN suppression through activation of NpHR3.0 (yellow bar) had no effect on PFC tuning during the delay period but did increase errors in the 2AFC task. (a1) Raster and PSTH examples of neurons tuned either early or late in the delay (yellow shading indicates laser presentation), shows that rule tuning persists during LGN inactivation. (a2) Laser impact on population rule information over the delay (n = 33 cells, 2 mice). (a3) Laser impact on behavior (n = 2 mice, 3 sessions each). (b–e) MD suppression using the same approach as in LGN leads to loss of tuning and disrupts behavioral performs. Data is presented as example units (b1-e1), followed by PCA for the laser on vs. off conditions (b2–e2) and behavioral impact (b3–e3). e4 shows the direct comparison between late PFC (Extended Data 4, d2) suppression and late MD suppression (e2) on PFC rule information in the last 100 ms (mean ± 95% CIs).
Extended Data Figure 7
Extended Data Figure 7. Connectivity pattern and response profile of MD and PFC neurons
(a) Cumulative distributions of neuronal peak widths (measured as full width to half maximum, FWHM) for MD and PFC. Two non-linear decoding methods (b) Poisson Naïve Bayes (PNB) and (c) maximum correlation coefficient (MCC) fail to reveal rule information among tuned MD neurons (PFC: n = 604 neurons, 6 mice, MD: n = 156 neurons, 3 mice). (d) Rule information obtained from non-linear decoding does not depend on the number of simultaneously recorded neurons: Decoding of rule information among tuned MD and PFC neurons is similar in sessions containing 1–5 neurons (PFC: n = 318 neurons, 6 mice, MD: n ­­= 73 neurons, 3 mice) and sessions containing greater than 5 neurons (PFC: n = 286 neurons, 6 mice, MD: n = 83 neurons, 3 mice). Similar results were obtained in single sessions with the highest population of simultaneously recorded MD neurons containing temporal peaks (n = 16), and an equivalent session containing the same number of simultaneously recorded tuned PFC neurons. Error bars are 95% CI. (e) Rule information is not encoded by MD neurons that do not show peaks. (f) Schematic diagram showing that tetrodes yielding MD neurons with peaks were located exclusively in lateral MD (white dots). (g) Anterograde labeling of PFC shows that their terminals are located in lateral MD. (h) Retrograde labeling from PFC identifies cells in lateral MD. Insets show enlarged view. (i) Firing rates are comparable in correct and incorrect trials for MD (left) or PFC (right) neurons. (j) Left: example PSTH of a single MD neuron in correct or error trials showing similar peaks across all conditions. Right: Quantification of peak size for the same rule in incorrect trials shows that MD peaks are retained while PFC peaks are diminished. Shade indicates 95% bootstrapped confidence intervals.
Extended Data Figure 8
Extended Data Figure 8. MD→PFC and PFC→MD pathways are functionally asymmetric
(a, b) Scatter plots comparing firing rates of PFC neurons during the delay period with and without MD suppression (each data point represents a neuron). (a) RS and (b) FS cells significantly show reduced firing when MD is optogenetically suppressed during the task delay period (P < 0.001). (c) In contrast, MD suppression outside of the task only reduces FS firing rates (RS: n = 245 neurons, FS: n = 114 neurons, data is presented as mean ± CI, grey shading indicates 95% CI of null distribution). (d) Increasing excitability in MD through activation of SSFOs has no effects on RS neuronal firing rate (n = 303 neurons, P > 0.05) but (e) significantly increases FS spiking (n = 131 neurons, P < 0.001) and (f) MD spiking (n = 254 neurons, P = 0.001). (g) The same manipulation in PFC increased firing rates in cortical RS neurons (n = 140 neurons, P < 0.001), (h) FS neurons (n = 91 neurons, P < 0.001) and (i) MD neurons (n = 111 neurons, P = 0.004). (j) All scatter plot data was compared using Wilcoxon signed-rank test. Other than panel c, the scatter plots are the raw data used for the normalized values in Figure 3.
Extended Data Figure 9
Extended Data Figure 9. Experimental and modeling results clarifying the novel attributes of the MD/ PFC network
(a) While LGN activation drives spiking in V1, MD activation does not drive spiking in PFC. (b) Schematic of the conceptual model based on the data showing MD, cortical FS and RS neurons in the three different conditions: outside task, task engaged and during the delay period. Triangles represent PFC RS cells that are all tuned to a single rule, and send convergent input to MD neurons (purple). MD sends a modulatory like signal that enhances spiking in FS cells and amplifies connections among RS cells. Task engagement enhances MD activity and in turn FS neural activity. Rule information is simulated as synchronized input to starter RS neurons, which triggers convergent input onto one another, as well as that on MD, resulting in progression of the RS neural sequence in time. (c) Example data from spiking neural model capturing illustration in (b): spike rasters of two RS cells (red: cell 1 and black: cell 2) at different positions within a chain showing corresponding changes in activity during the three conditions. Note that overall spike rates don’t change, but coordinated spiking (gray shadings) increases. (d) Systematically exploring the degree of convergence in the MD/PFC model suggests that 3–4 links in the PFC chain converge onto individual MD neurons (n = 250 neurons, 3 simulations per condition). (e) The model captures the firing rate and (f) connectivity changes observed experimentally. (g) In the modeled MD/PFC network, enhancing excitability in MD neurons by 10% significantly increases the number of rule tuned cells in the PFC population (n = 250 neurons, 10 simulations, data is mean ± SEM, P = 0.002, Wilcoxon rank-sum). (h) Enhancing excitability in the PFC population by 8% drastically increased the proportion of neurons that show inappropriate tuning to both rules (n = 250 neurons, 10 simulation, P = 0.002, Wilcoxon rank-sum). (i) Example spike raster from a neuron tuned to one rule, showing that MD activation is sufficient to generate appropriate tuning outside the task. (j) Population data shows that MD activation is sufficient to partially generate tuning outside the task (n = 2 mice, 31 tuned neurons). Grey shading indicates 95% CI of null distribution. All data is presented as mean ± 95% CI, separation indicates P < 0.05. (k) Example of the effect of SSFO-based activation on an MD neuron containing only one peak showing the addition of a second peak at the same timepoint in the opposite trial type. (l) Relative to the population average (8.4%, dotted line), MD neurons showed significantly fewer single peaks in the SSFO condition despite the presence of an average number of single peaks in the same neurons without SSFO (cumulative binomial test vs population average, p values as shown).
Extended Data Figure 10
Extended Data Figure 10. Behavioral effects of excitability changes in MGB
(a) Diagram showing task design and SSFO activation/termination timing in a Go/No-Go auditory discrimination task (see methods for task description). (b) Comparison showing the probability of a “Go” response after either “Go” or “No-Go” stimuli were presented across sessions (points) and mice (columns). NS: P = 0.52 non-significant, Wilcoxon signed-rank test.
Figure 1
Figure 1. Task-specific sequential PFC activity maintains rule representation
(a) Schematic of task design. (b) Example peri-stimulus time histogram (PSTH) and rasters for neurons tuned to either ‘attend to vision’ (red) or ‘attend to audition’ (blue) rules. (c) Examples of tuning peaks across multiple sessions. (d) Task-variable information, indicates that tuned neurons (n = 512 neurons from 4 mice) reflect rule information (top, green), but not movement (top, grey), but unturned neurons do not (n = 2727, bottom) (e) Example spike time cross-correlation between two neurons (50 μs bins), indicating a putative monosynaptic connection. (f) Putative monosynaptic connections in same rule tuned pairs showed a significantly larger average peak. Vertical ticks indicate peak times. (g) Cumulative plot showing cross-correlation values for each pair. (h) Same rule tuned pairs with putative monosynaptic connections had overlapping tuning peaks (i) Raster and PSTH examples showing diminished turning during optogenetic activation of inhibitory neurons (blue shading indicates laser). (j) Quantification of laser impact on peak sizes (n = 94 neurons, 3 mice; example in Extended Data Figure 3j). (k–l) Temporally-limited optogenetic manipulations (blue bars) indicate that later tuning depends on earlier activity. Shading indicates 95% confidence intervals.
Figure 2
Figure 2. Categorically-free MD activity is required for PFC rule representation and task performance
(a) Delay-limited PFC or MD inhibition diminishes task performance. (4 sessions, n = 4 mice each). (b) Delay-limited PFC or MD inhibition in the 4AFC task selectively increases executive errors while LGN suppression selectively increases sensory ones (n = 4 mice per group). (c) Raster and PSTH examples of PFC rule tuning with MD suppression (shading denotes laser). (d) Population quantification of c as in Figure 1j (n = 58 neurons). (e–f) Temporally-limited MD suppression effects on population tuning (e, n = 43 neurons; f, n = 46 neurons3 mice with 4 sessions per condition). (g) Comparison of behavioral performance with full and temporally limited MD suppression (n = 3 mice with 4 sessions each). (h) Effect of short duration (100 ms) suppression of PFC or MD across the delay on performance. (i) Effect of MD suppression with short delay (20 ms) trials. (j) MD recordings schematic. (k) Raster and PSTH example of an MD neuron showing similar peaks in both trial types. (l) Example PSTHs of five MD neurons showing consistent lack of rule-specificity. (m) Linear decoding fails to reveal rule information in MD neurons with peaks (PFC: n = 604 neurons, 6 mice, MD: n = 156 neurons, 3 mice). (n-p) MD peak elimination by PFC suppression, (full: n = 47 neurons, early: n = 34 neurons; middle: n = 36 neurons; 2 mice with 4–5 sessions each). (q) Effects of MD (yellow) and PFC (blue) suppression on the first 50 ms of PFC tuning. MD suppression produces a small effect on early PFC peaks (n = 101 neurons, 3 mice) relative to local PFC suppression (n = 146 neurons, 3 mice) while PFC suppression strongly reduced early MD tuning (green, n = 81 neurons, 2 mice). (r) Early rule information is preserved with MD, but not PFC suppression (decoding as in Figure 1. MD: n = 101 neurons, 3 mice; PFC: n = 146 neurons, 3 mice). Shading indicates 95% confidence intervals. Wilcoxon rank-sum test was used for all comparisons. Data is presented as mean ± SEM.
Figure 3
Figure 3. MD input amplifies local PFC connectivity
(a) MD and cortical FS but not RS show increased firing rates upon task engagement and further increase during the delay (normalized to values outside of task; PFC, 6 mice, RS: 516 cells, FS: 213 cells, MD, 3 mice, 196 cells, grey shading indicates 95% CI of null distribution. (b) RS network connectivity, assessed by granger causality of spike trains.(normalized to values outside of task, n = 6 mice, 43 sessions; median 13 neurons/session). (c) Suppressing MD reduces cortical FS and RS firing rates during task delay (RS: 245, FS: 114, n = 2 mice), as well as RS connectivity (n = 2 mice, 19 sessions; median 13 neurons/session). Enhancing MD excitability increases cortical FS firing rates, connectivity among cortical RS neurons but not RS firing rates (RS: 303, FS: 131, n = 2 mice; RS connectivity [n = 17 sessions; median 18 neurons/session]). (d) Spike transfer function (methods) of PFC→MD is significantly higher compared to MD→PFC (n = 17 sessions, median 11 PFC and 10 MD neurons/session for PFC→MD, median 18 PFC and 15 MD neurons/sessions for MD→PFC, 2 mice per condition, error bars are 95% CI estimated per session). (e) Experimental setup for testing the impact of MD activation on local intra-PFC connectivity. (f) Example RS neuron responses (normalized PSTH, mean ± SEM) to MD activation alone, intra-PFC activation alone or the combination. (g) Comparison of the observed combined response with the arithmetic sum of its individual components shows supra-linearity (P < 10−15, sign-rank test). (h–i) As in e–g but for SSFO-mediated activation of LGN and recordings from V1. (j) Combined stimulation results in a sub-linearity (P < 10−4, sign-rank test).
Figure 4
Figure 4. Enhancing MD excitability strengthens PFC rule representation and improves performance
(a) Optogenetic MD activation causes tuning of previously unturned PFC neurons in the 2AFC delay period, while (b) Optogenetic PFC activation generates inappropriate PFC tuning peaks (shading indicates laser on). (c, d) Quantification of examples in a,b (binomial test). (e) Quantification of existing peak size change (data is mean ± CI) and (f, g) rule information within the PFC following MD or PFC activation (n = 2 mice). (h, i) Opposing performance effects of he two manipulations (n = 16 sessions each from 4 mice).). Shading indicates 95% confidence intervals (see methods). Behavioral data is presented as session averages and compared using Wilcoxon rank-sum test.

Comment in

  • Working memory: Persistence is key.
    Bray N. Bray N. Nat Rev Neurosci. 2017 Jul;18(7):385. doi: 10.1038/nrn.2017.70. Epub 2017 May 25. Nat Rev Neurosci. 2017. PMID: 28541347 No abstract available.

References

    1. Ito HT, Zhang SJ, Witter MP, Moser EI, Moser MB. A prefrontal-thalamo-hippocampal circuit for goal-directed spatial navigation. Nature. 2015;522:50–55. doi: 10.1038/nature14396. - DOI - PubMed
    1. Parnaudeau S, et al. Inhibition of mediodorsal thalamus disrupts thalamofrontal connectivity and cognition. Neuron. 2013;77:1151–1162. doi: 10.1016/j.neuron.2013.01.038. - DOI - PMC - PubMed
    1. Xu W, Sudhof TC. A neural circuit for memory specificity and generalization. Science. 2013;339:1290–1295. doi: 10.1126/science.1229534. - DOI - PMC - PubMed
    1. Kuramoto E, et al. Individual mediodorsal thalamic neurons project to multiple areas of the rat prefrontal cortex: A single neuron-tracing study using virus vectors. The Journal of comparative neurology. 2016 doi: 10.1002/cne.24054. - DOI - PubMed
    1. Rubio-Garrido P, Perez-de-Manzo F, Porrero C, Galazo MJ, Clasca F. Thalamic input to distal apical dendrites in neocortical layer 1 is massive and highly convergent. Cerebral cortex. 2009;19:2380–2395. doi: 10.1093/cercor/bhn259. - DOI - PubMed

Publication types