. 2017 May 2;19(5):1056-1067.
doi: 10.1016/j.celrep.2017.04.028.

High-Resolution RNA Maps Suggest Common Principles of Splicing and Polyadenylation Regulation by TDP-43

Affiliations

High-Resolution RNA Maps Suggest Common Principles of Splicing and Polyadenylation Regulation by TDP-43

Gregor Rot et al. Cell Rep. .

Abstract

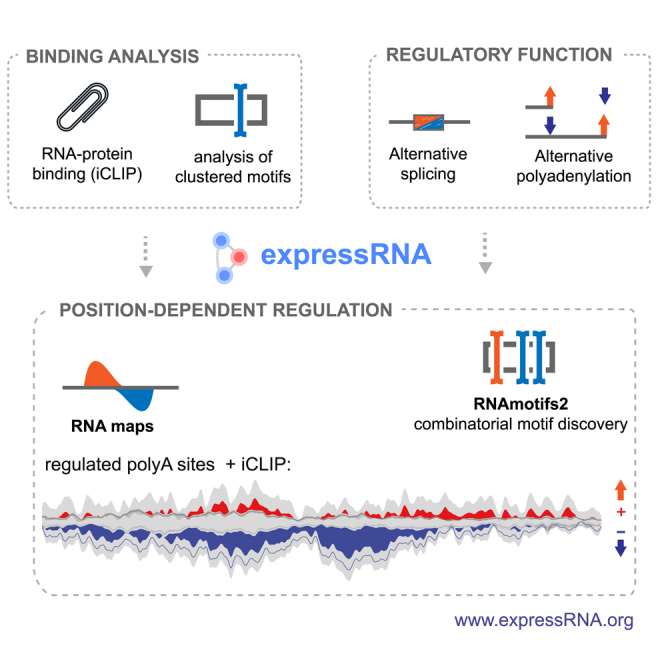
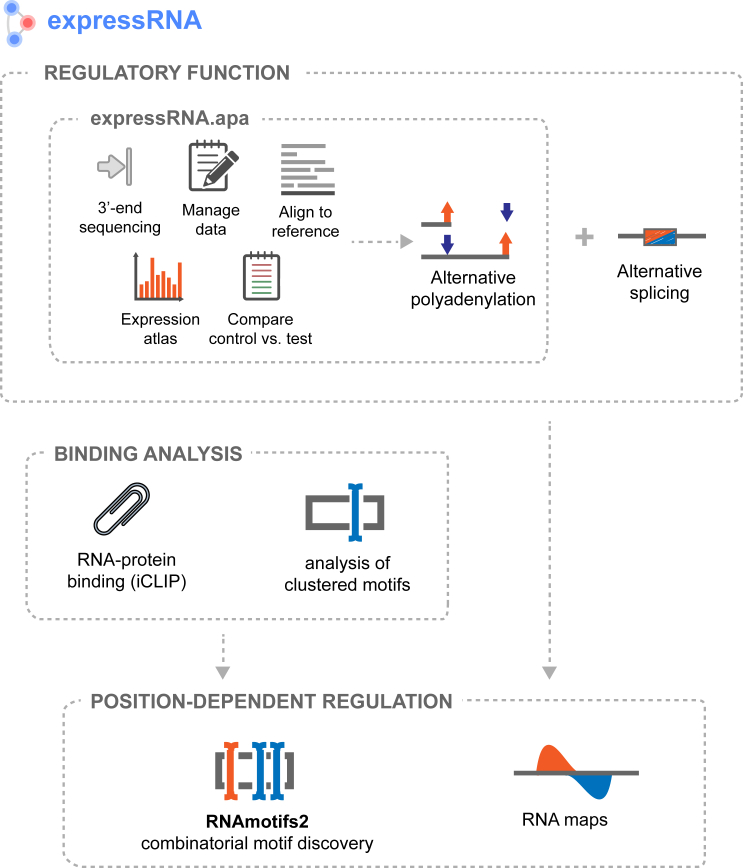
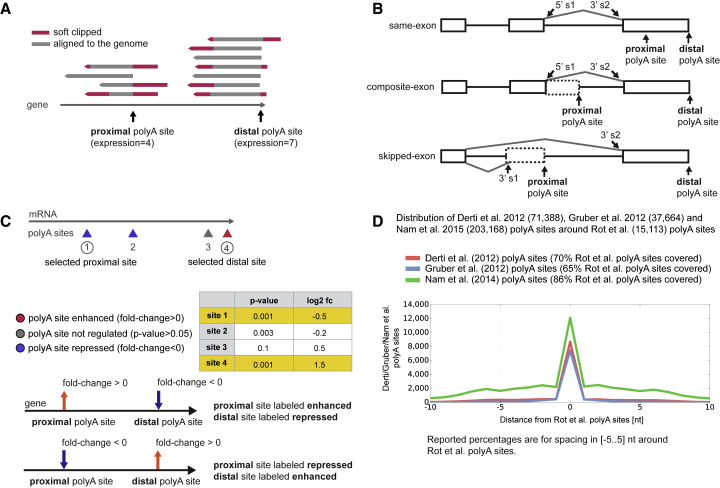
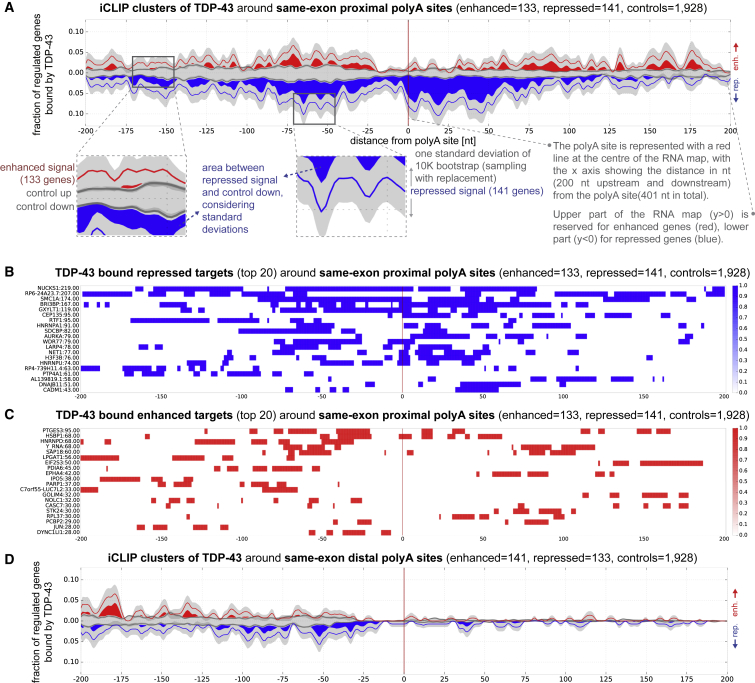
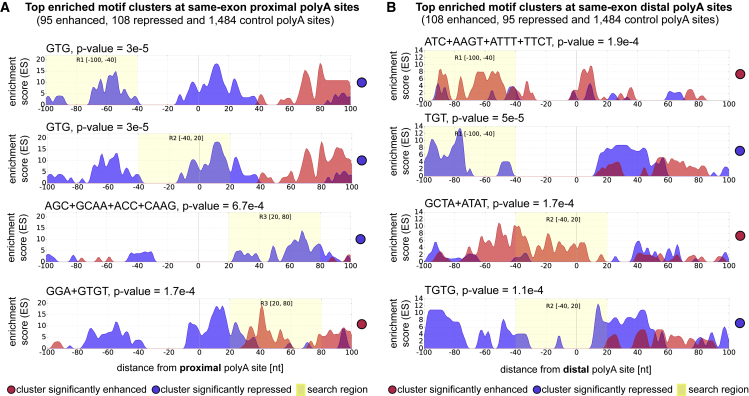
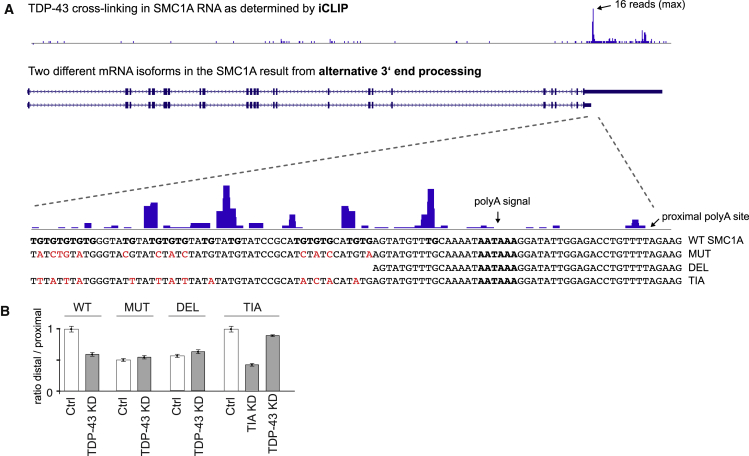
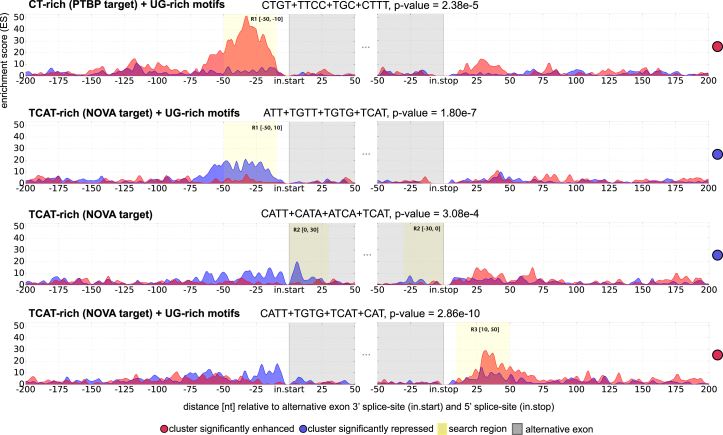
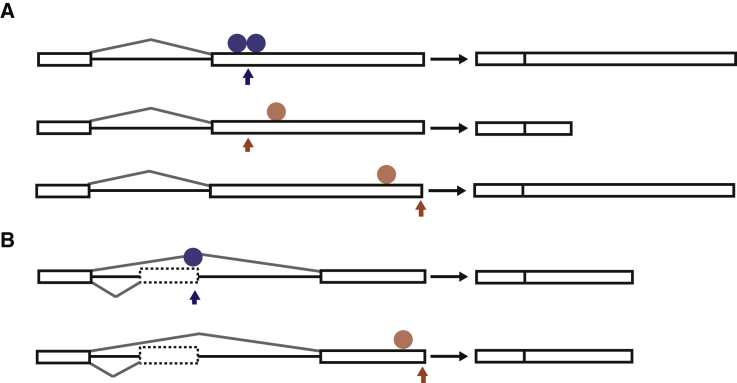
Many RNA-binding proteins (RBPs) regulate both alternative exons and poly(A) site selection. To understand their regulatory principles, we developed expressRNA, a web platform encompassing computational tools for integration of iCLIP and RNA motif analyses with RNA-seq and 3' mRNA sequencing. This reveals at nucleotide resolution the "RNA maps" describing how the RNA binding positions of RBPs relate to their regulatory functions. We use this approach to examine how TDP-43, an RBP involved in several neurodegenerative diseases, binds around its regulated poly(A) sites. Binding close to the poly(A) site generally represses, whereas binding further downstream enhances use of the site, which is similar to TDP-43 binding around regulated exons. Our RNAmotifs2 software also identifies sequence motifs that cluster together with the binding motifs of TDP-43. We conclude that TDP-43 directly regulates diverse types of pre-mRNA processing according to common position-dependent principles.

Keywords: 3′ mRNA sequencing; RNA map; RNAmotifs2; TDP-43; alternative polyadenylation; alternative splicing; clustered sequence motifs; expressRNA; iCLIP; positional regulatory principles.


Figures

None
Graphical abstract
Figure 1
Figure 1
expressRNA Research Platform The expressRNA platform performs analyses of alternative polyadenylation datasets and can include external alternative splicing datasets. The identified or provided regulated features (poly(A) sites, alternative exons) are then combined with RNA protein binding information (iCLIP). Motif analysis is performed with the RNAmotifs2 platform. The results are presented with RNA maps that elucidate position-dependent regulatory mechanisms.
Figure 2
Figure 2
Mapping Reads and Evaluating Poly(A) Site Loci and Expression (A) Read alignment to the hg19 reference genome. Reads are soft clipped (red) due to poly(A) tail sequence at the 5′ end or imperfect primer annealing at the 3′ end. (B) Classification of proximal and distal poly(A) site pairs (5′ s1 = 5′ splice site 1). The same-exon pairs are not limited to the last exons in the gene, 9% (201 of 2,202) of the same-exon pairs are annotated to a non-terminal exon. (C) DEXSeq computes direction (log2 fold change) and significance (adjusted p value) of poly(A) sites in control versus TDP-43 KD. The proximal-distal site pair with highest fold change is selected among significantly changed poly(A) sites (adjusted p value <0.05). Nonsignificant changes are classified as control-enhanced and control repressed. Control distributions are drawn as black lines in all RNA maps. (D) Overlap with Derti et al., 2012, Gruber et al., 2012, and Nam et al. (2014) poly(A) sites around the poly(A) sites defined by the present study.
Figure 3
Figure 3
RNA Maps of TDP-43 around Proximal and Distal Same-Exon Poly(A) Sites with iCLIP Clusters (A) Proximal poly(A) site RNA map of TDP-43 iCLIP at regulated genes. TDP-43 is bound around repressed poly(A) sites and to a lesser extent (sparsely) further upstream and downstream of enhanced poly(A) sites. (B) Top 20 iCLIP mRNA targets contributing to proximal poly(A) site repression. (C) Top 20 iCLIP mRNA targets contributing to proximal poly(A) site enhancement. (D) Distal site RNA map of TDP-43 binding around regulated genes. The level of binding is lower compared to the proximal sites (Table S6).
Figure 4
Figure 4
Motif Analysis around TDP-43-Regulated Same-Exon Poly(A) Sites Up to two of the most significant motif clusters are shown for each search region (R1, R2, R3). (A) Motif analysis around proximal poly(A) sites show significant UG-rich clusters in R1 [–100..–40] and R2 [–40..20] around repressed proximal poly(A) sites. The repressive effect concords with TDP-43 iCLIP binding analysis (Figure 3). More distal binding in R3 [20..80] results in enhancement. (B) Motif analysis around distal poly(A) sites reveals less pronounced regulatory effects, mostly enhancement guided by UC and UA-rich clusters.
Figure 5
Figure 5
SMC1A Mini-Gene (A) iCLIP TDP-43 binding along SMC1A 3′-UTR and zoomed in binding upstream of proximal poly(A) site. The intact SMCA1 sequence around the proximal polyA site is shown in the lower part (wild-type [WT] SMCA1), which includes the region upstream of the polyA signal (in bold) that contains a UG-rich region (in bold) that crosslinks to TDP-43 (shown above the sequence with blue bars). We introduced mutations (MUT) or deletion of TG dimers (DEL) to prevent TDP-43 binding to the UG-rich region in the RNA. The final minigene was designed with mutations that replaced G in TG dimers into T or A to convert the sequence into a binding site for TIA proteins (TIA). The mutant nucleotides are marked in red. (B) Ratio in the use of distal vs. proximal polyA site in control cells, TDP-43 KD or the double KD of TIA1 and TIAL1 (TIA KD).
Figure 6
Figure 6
Motif Clusters Regulating Alternative Splicing in the Human Brain Significant motif clusters involved in alternative splicing (comparing brain and heart tissue) obtained with RNAmotifs2. Both PTBP and NOVA proteins major effect is silencing of alternative exons. Alternative exons flanked by upstream TC and T-rich clusters (PTBP targets) are enhanced in the brain, where PTBP expression is low compared to other tissue. Contrary, NOVA proteins are highly expressed in the brain, and exons flanked by upstream TCAT-rich clusters (NOVA targets) are therefore repressed in this tissue. For previous analysis of data, see Cereda et al. (2014).
Figure 7
Figure 7
Summary of the Main Position-Dependent Modes of APA Regulation by TDP-43 (A) The binding patterns that are most enriched for the same-exon type of APA, as shown in Figures 3A–3D and S3B-E. (B) The binding patterns that are most enriched for the skipped-exon type of APA, as shown in Figures S4C and S4D; the arrow marks the position of the regulated poly(A) site, and the circle marks the main position of TDP-43 binding. The blue color denotes the repressive, and the red the enhancing effect of TDP-43, and the positions of the regulatory patterns can be found in the Table S6 (p value <0.01, BRG >10).

References

    1. Akhtar M.N., Bukhari S.A., Fazal Z., Qamar R., Shahmuradov I.A. POLYAR, a new computer program for prediction of poly(A) sites in human sequences. BMC Genomics. 2010;11:646. - PMC - PubMed
    1. Alipanahi B., Delong A., Weirauch M.T., Frey B.J. Predicting the sequence specificities of DNA- and RNA-binding proteins by deep learning. Nat. Biotechnol. 2015;33:831–838. - PubMed
    1. Anders S., Reyes A., Huber W. Detecting differential usage of exons from RNA-seq data. Genome Res. 2012;22:2008–2017. - PMC - PubMed
    1. Barash Y., Calarco J.A., Gao W., Pan Q., Wang X., Shai O., Blencowe B.J., Frey B.J. Deciphering the splicing code. Nature. 2010;465:53–59. - PubMed
    1. Batra R., Charizanis K., Manchanda M., Mohan A., Li M., Finn D.J., Goodwin M., Zhang C., Sobczak K., Thornton C.A., Swanson M.S. Loss of MBNL leads to disruption of developmentally regulated alternative polyadenylation in RNA-mediated disease. Mol. Cell. 2014;56:311–322. - PMC - PubMed

LinkOut - more resources