. 2017 May 2;25(5):1186-1193.e4.
doi: 10.1016/j.cmet.2017.04.006.

PPARδ Promotes Running Endurance by Preserving Glucose

Affiliations

PPARδ Promotes Running Endurance by Preserving Glucose

Weiwei Fan et al. Cell Metab. .

Abstract

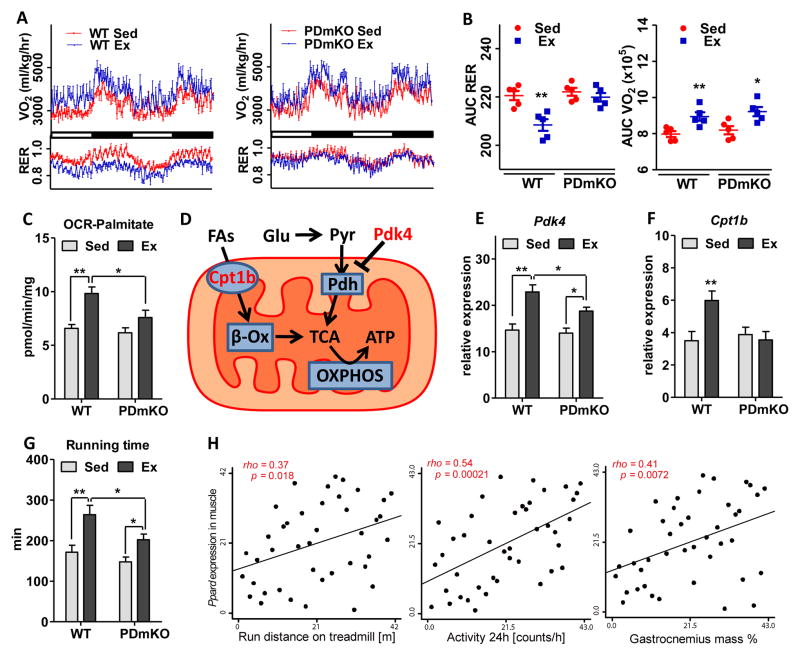
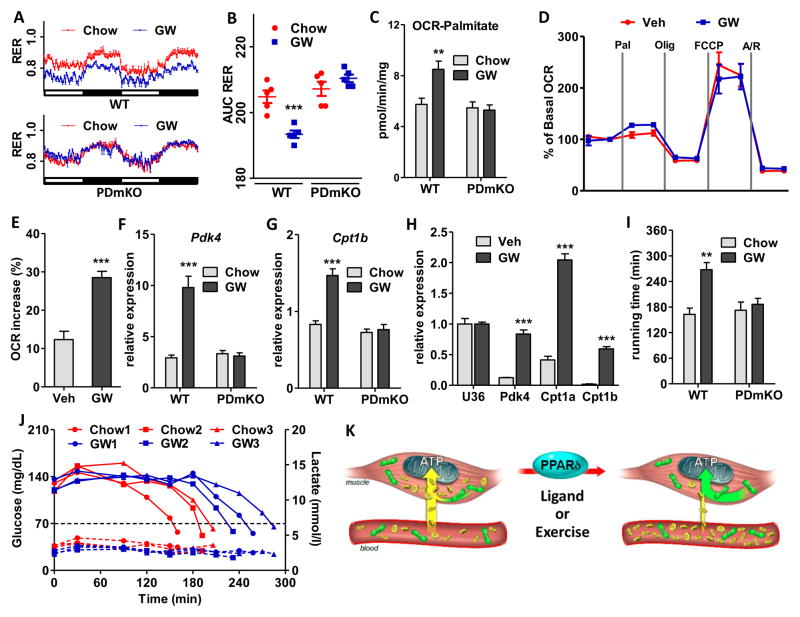
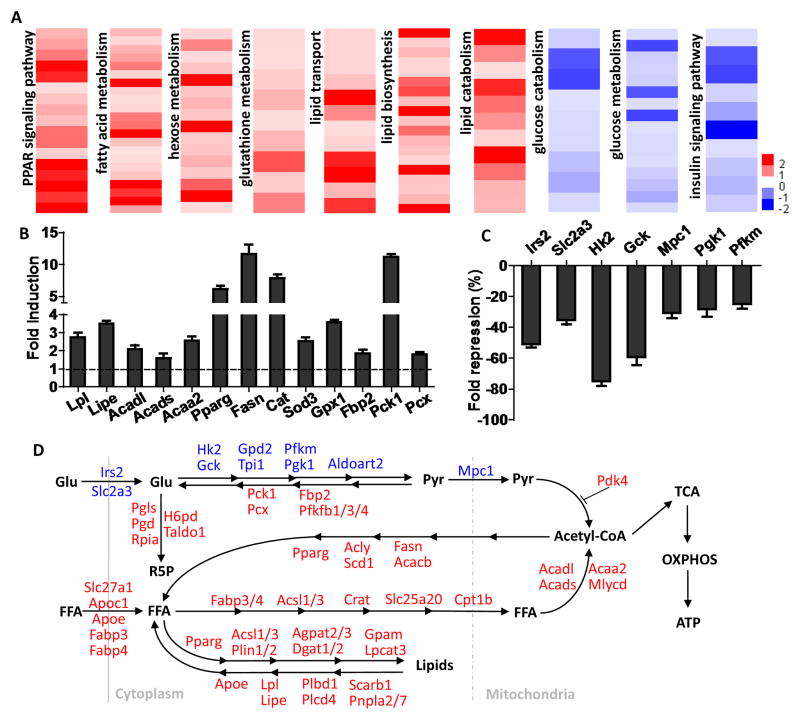
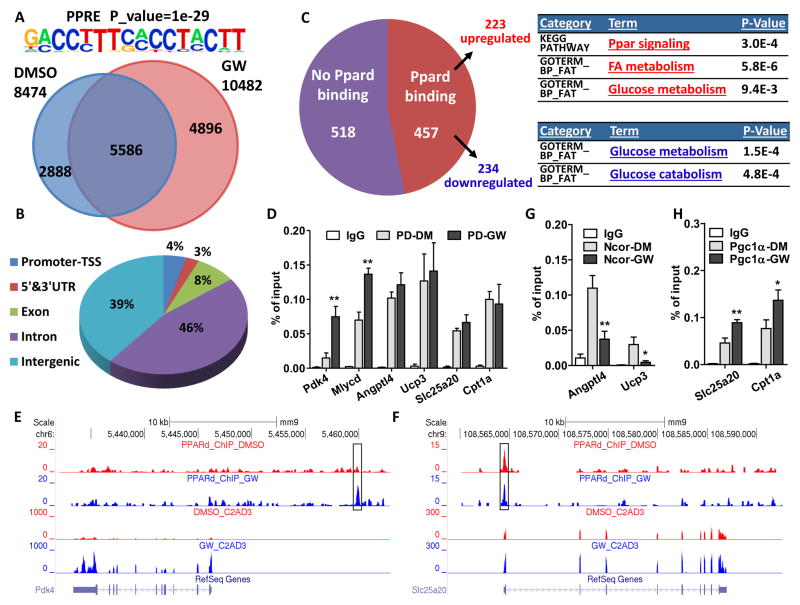
Management of energy stores is critical during endurance exercise; a shift in substrate utilization from glucose toward fat is a hallmark of trained muscle. Here we show that this key metabolic adaptation is both dependent on muscle PPARδ and stimulated by PPARδ ligand. Furthermore, we find that muscle PPARδ expression positively correlates with endurance performance in BXD mouse reference populations. In addition to stimulating fatty acid metabolism in sedentary mice, PPARδ activation potently suppresses glucose catabolism and does so without affecting either muscle fiber type or mitochondrial content. By preserving systemic glucose levels, PPARδ acts to delay the onset of hypoglycemia and extends running time by ∼100 min in treated mice. Collectively, these results identify a bifurcated PPARδ program that underlies glucose sparing and highlight the potential of PPARδ-targeted exercise mimetics in the treatment of metabolic disease, dystrophies, and, unavoidably, the enhancement of athletic performance.

Keywords: PPARδ; endurance exercise; exercise mimetics; fatty acid metabolism; glucose metabolism; muscle.


Figures

Figure 1
Figure 1. Exercise induces a PPARδ-dependent shift in muscle energy substrate utilization
Experiments were performed in the same set of 4-month-old WT or PDmKO mice with or without 4 weeks of exercise training (n=5). (A) Oxygen consumption rate (OCR, VO2) and respiratory exchange ratio (RER, VCO2/VO2) measured over a 48-hour period. (B) Quantitative analysis of VO2 and RER using area under curve (AUC) of the data in (A). (C) OCR using palmitoyl-carnitine as the substrate in freshly isolated mitochondria from quadriceps muscle. (D) Diagram showing the two major types of fuel sources (glucose and FAs) and the gatekeeper enzymes that control their mitochondrial influx. (E–F) mRNA expression levels of Cpt1b and Pdk4 in soleus. (G) Total running time in a run-to-exhaustion endurance test. (H) Correlations between PPARδ expression in quadriceps and running distance, activity, and muscle mass. Asterisks denote statistically significant differences (*p < 0.05, **p < 0.01).
Figure 2
Figure 2. Ligand activation of muscle PPARδ induces substrate shift and boosts endurance by preserving glucose
Mouse experiments were performed in the same set of 4-month-old WT or PDmKO mice with or without 8 weeks of oral GW treatment (n=8). (A) RER measured over a 48-hour period. (B) Quantitative RER analysis using AUC of the data in (A). (C) OCR using palmitoyl-carnitine as the substrate in freshly isolated mitochondria from quadriceps. (D) Change of OCR upon palmitate injection measured in C2C12 myotubes treated with vehicle or GW. (E–F) mRNA expression levels of Pdk4 and Cpt1b in white quadriceps. (G) mRNA expression levels of Pdk4 and Cpt1a/b in C2C12 myotubes. Data normalized to the level of U36 (U36b4). (H) Total running time in the endurance test. (J) Blood glucose (solid lines) and lactate (dotted lines) monitored during the run-to-exhaustion endurance test in mice treated with or without GW. (K) Diagram showing the PPARδ-controlled energy substrate shift induced by its ligands or exercise. Yellow marks glucose and its usage while green marks FAs and their usage. *p < 0.05, **p < 0.01, ***p < 0.001.
Figure 3
Figure 3. PPARδ gene network orchestrates opposing changes on fat and sugar metabolism
RNA-seq experiments were performed in white quadriceps from 4-month-old WT mice with or without 8 weeks of GW treatment. (A) Heat maps showing individual gene expression changes in gene ontology (GO) terms identified in RNA-seq results. Data are presented as log2(fold change). (B) GW-induced fold induction of the expression of genes involved in FA catabolism (Lpl, Lipe, Acadl, Acads, and Acaa2), lipogenesis (PPARg and Fasn), antioxidant (Cat, Sod3, and Gpx1), and gluconeogenesis (Fbp2, Pck1, and Pcx). (C) GW-induced fold repression of the expression of genes involved in insulin signaling (Irs2), glucose uptake (Slc2a3), glycolysis (Hk2, Gck, Pgk1, and Pfkm), and mitochondrial pyruvate entry (Mpc1). (D) Diagram showing the metabolism of glucose and FAs, the two major cellular energy substrates, as well as GW-induced gene expression changes that regulate their metabolism. Red and blue labels represent up- and down-regulation induced by GW treatment, respectively. p < 0.01 or 0.001 in all genes listed in (B) & (C).
Figure 4
Figure 4. Ligand Remodeling of the PPARδ cistrome
Experiments were performed in 5-day-differentiated C2C12 myotubes with 6-hour treatment of DMSO or GW. (A) Venn diagram showing distinct and overlapping binding sites of PPARδ in C2C12 myotubes with DMSO or GW treatment. PPRE motif (top) was significantly enriched. (B) Pie chart illustrating genomic locations of PPARδ binding sites in the DMSO-treated condition. GW treatment gave similar results. (C) Pie chart showing the number of PPARδ-bound or non-bound genes from all 975 genes that are changed by GW treatment. GO and pathway analysis of up- and down-regulated genes is listed. (D) ChIP-qPCR showing PPARδ binding sites that are enhanced by GW treatment or not. IgG: IgG control; PD-DM: PPARδ-ChIP in DMSO treatment; PD-GW: PPARδ-ChIP in GW treatment. (E–F) ChIP-Seq and RNA-seq reads aligned to Pdk4 (left) and Slc25a20 (right). (G–H) ChIP-qPCR showing the changes of NcoR (E) and Pgc1α (F) binding sites by GW treatment. IgG: IgG control; Pgc1α/Ncor-DM: Pgc1α/Ncor-ChIP in DMSO treatment; Pgc1α/Ncor-GW: Pgc1α/Ncor-ChIP in GW treatment. *p < 0.05, **p < 0.01.

References

    1. Andreux PA, Williams EG, Koutnikova H, Houtkooper RH, Champy MF, Henry H, Schoonjans K, Williams RW, Auwerx J. Systems genetics of metabolism: the use of the BXD murine reference panel for multiscalar integration of traits. Cell. 2012;150:1287–1299. - PMC - PubMed
    1. Barak Y, Liao D, He W, Ong ES, Nelson MC, Olefsky JM, Boland R, Evans RM. Effects of peroxisome proliferator-activated receptor delta on placentation, adiposity, and colorectal cancer. Proceedings of the National Academy of Sciences of the United States of America. 2002;99:303–308. - PMC - PubMed
    1. Bruce CR, Hoy AJ, Turner N, Watt MJ, Allen TL, Carpenter K, Cooney GJ, Febbraio MA, Kraegen EW. Overexpression of carnitine palmitoyltransferase-1 in skeletal muscle is sufficient to enhance fatty acid oxidation and improve high-fat diet-induced insulin resistance. Diabetes. 2009;58:550–558. - PMC - PubMed
    1. Dressel U, Allen TL, Pippal JB, Rohde PR, Lau P, Muscat GE. The peroxisome proliferator-activated receptor beta/delta agonist, GW501516, regulates the expression of genes involved in lipid catabolism and energy uncoupling in skeletal muscle cells. Molecular endocrinology. 2003;17:2477–2493. - PubMed
    1. Duan SZ, Usher MG, Mortensen RM. Peroxisome proliferator-activated receptor-gamma-mediated effects in the vasculature. Circulation research. 2008;102:283–294. - PubMed