

Induced Pluripotent Stem Cells Derived from a CLN5 Patient Manifest Phenotypic Characteristics of Neuronal Ceroid Lipofuscinoses
- PMID: 28468312
- PMCID: PMC5454868
- DOI: 10.3390/ijms18050955
Induced Pluripotent Stem Cells Derived from a CLN5 Patient Manifest Phenotypic Characteristics of Neuronal Ceroid Lipofuscinoses
Abstract
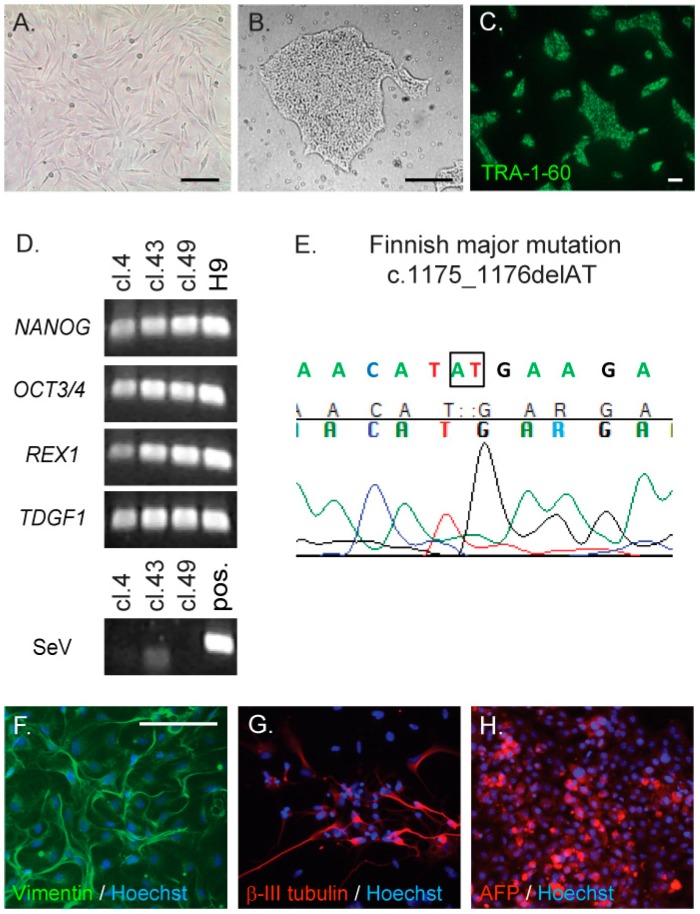
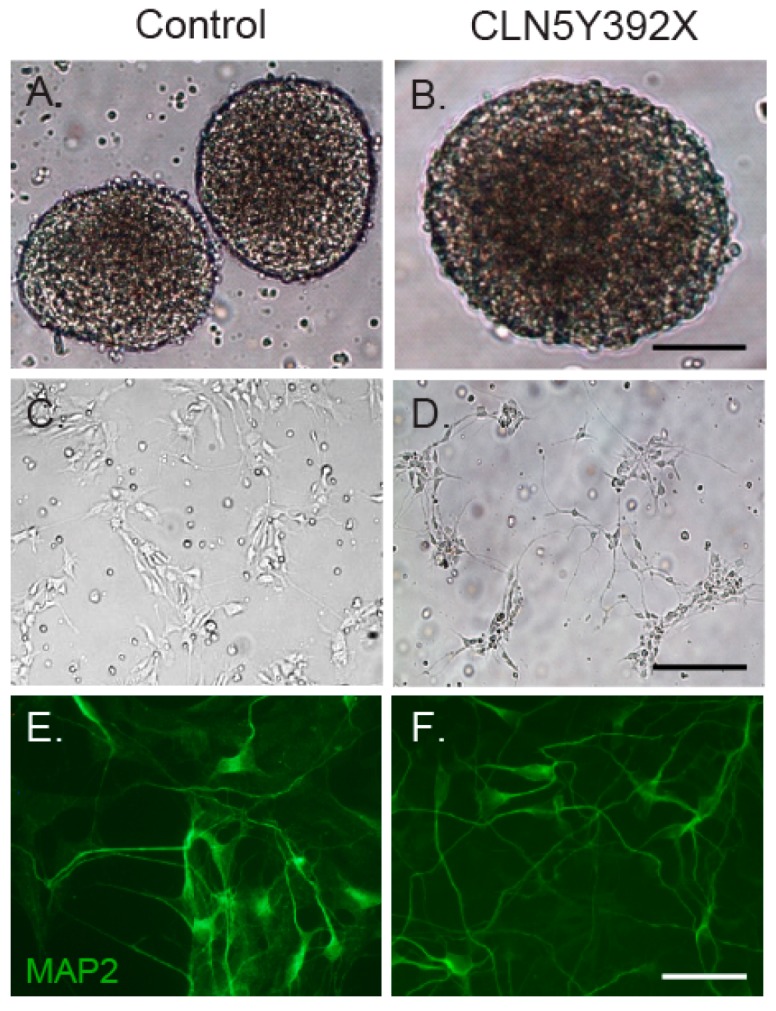
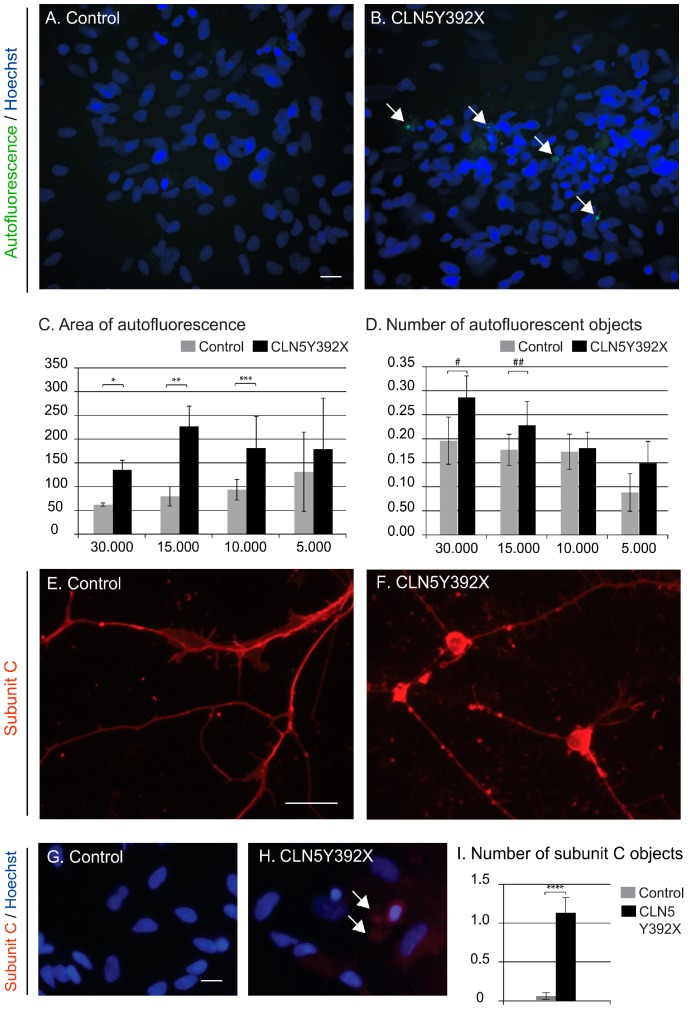
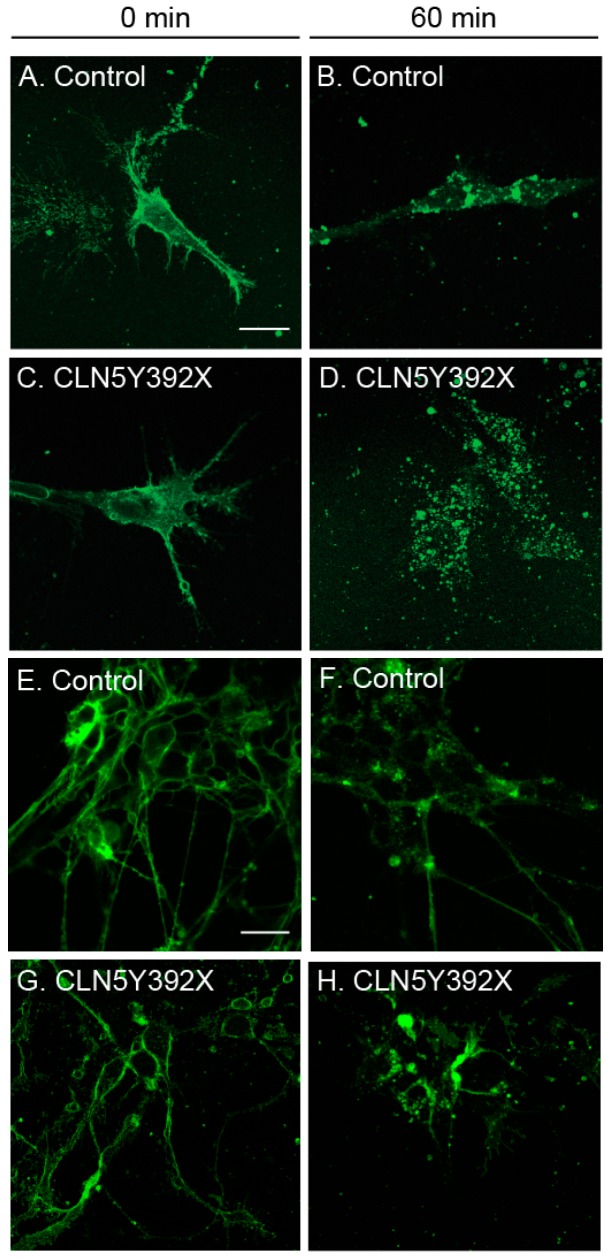
Neuronal ceroid lipofuscinoses (NCLs) are autosomal recessive progressive encephalopathies caused by mutations in at least 14 different genes. Despite extensive studies performed in different NCL animal models, the molecular mechanisms underlying neurodegeneration in NCLs remain poorly understood. To model NCL in human cells, we generated induced pluripotent stem cells (iPSCs) by reprogramming skin fibroblasts from a patient with CLN5 (ceroid lipofuscinosis, neuronal, 5) disease, the late infantile variant form of NCL. These CLN5 patient-derived iPSCs (CLN5Y392X iPSCs) harbouring the most common CLN5 mutation, c.1175_1176delAT (p.Tyr392X), were further differentiated into neural lineage cells, the most affected cell type in NCLs. The CLN5Y392X iPSC-derived neural lineage cells showed accumulation of autofluorescent storage material and subunit C of the mitochondrial ATP synthase, both representing the hallmarks of many forms of NCLs, including CLN5 disease. In addition, we detected abnormalities in the intracellular organelles and aberrations in neuronal sphingolipid transportation, verifying the previous findings obtained from Cln5-deficient mouse macrophages. Therefore, patient-derived iPSCs provide a suitable model to study the mechanisms of NCL diseases.
Keywords: CLN5; NCL; iPS cells; lysosomal storage disease; sphingolipid.
Conflict of interest statement
The authors declare no conflict of interest.
Figures

Similar articles
-
Inhibition of storage pathology in prenatal CLN5-deficient sheep neural cultures by lentiviral gene therapy.Neurobiol Dis. 2014 Feb;62:543-50. doi: 10.1016/j.nbd.2013.11.011. Epub 2013 Nov 19. Neurobiol Dis. 2014. PMID: 24269732
-
A mixed breed dog with neuronal ceroid lipofuscinosis is homozygous for a CLN5 nonsense mutation previously identified in Border Collies and Australian Cattle Dogs.Mol Genet Metab. 2019 May;127(1):107-115. doi: 10.1016/j.ymgme.2019.04.003. Epub 2019 Apr 17. Mol Genet Metab. 2019. PMID: 31101435 Free PMC article.
-
Characterization of two human induced pluripotent stem cell lines derived from Batten disease patient fibroblasts harbouring CLN5 mutations.Stem Cell Res. 2024 Feb;74:103291. doi: 10.1016/j.scr.2023.103291. Epub 2023 Dec 18. Stem Cell Res. 2024. PMID: 38141358
-
Genetic basis and phenotypic correlations of the neuronal ceroid lipofusinoses.Biochim Biophys Acta. 2013 Nov;1832(11):1827-30. doi: 10.1016/j.bbadis.2013.03.017. Epub 2013 Mar 28. Biochim Biophys Acta. 2013. PMID: 23542453 Review.
-
Correlations between genotype, ultrastructural morphology and clinical phenotype in the neuronal ceroid lipofuscinoses.Neurogenetics. 2005 Sep;6(3):107-26. doi: 10.1007/s10048-005-0218-3. Epub 2005 Sep 28. Neurogenetics. 2005. PMID: 15965709 Review.
Cited by
-
The Neuronal Ceroid Lipofuscinoses-Linked Loss of Function CLN5 and CLN8 Variants Disrupt Normal Lysosomal Function.Neuromolecular Med. 2019 Jun;21(2):160-169. doi: 10.1007/s12017-019-08529-7. Epub 2019 Mar 27. Neuromolecular Med. 2019. PMID: 30919163
-
Deficiency of the Lysosomal Protein CLN5 Alters Lysosomal Function and Movement.Biomolecules. 2021 Sep 27;11(10):1412. doi: 10.3390/biom11101412. Biomolecules. 2021. PMID: 34680045 Free PMC article.
-
Glial Dysfunction and Its Contribution to the Pathogenesis of the Neuronal Ceroid Lipofuscinoses.Front Neurol. 2022 Apr 4;13:886567. doi: 10.3389/fneur.2022.886567. eCollection 2022. Front Neurol. 2022. PMID: 35444603 Free PMC article. Review.
-
Neuropathophysiology of Lysosomal Storage Diseases: Synaptic Dysfunction as a Starting Point for Disease Progression.J Clin Med. 2020 Feb 25;9(3):616. doi: 10.3390/jcm9030616. J Clin Med. 2020. PMID: 32106459 Free PMC article. Review.
-
Using induced pluripotent stem cells derived neurons to model brain diseases.Neural Regen Res. 2017 Jul;12(7):1062-1067. doi: 10.4103/1673-5374.211180. Neural Regen Res. 2017. PMID: 28852383 Free PMC article. Review.
References
-
- Savukoski M., Klockars T., Holmberg V., Santavuori P., Lander E.S., Peltonen L. CLN5, a novel gene encoding a putative transmembrane protein mutated in finnish variant late infantile neuronal ceroid lipofuscinosis. Nat. Genet. 1998;19:286–288. - PubMed
MeSH terms
Substances
Supplementary concepts
LinkOut - more resources
Full Text Sources
Other Literature Sources
Miscellaneous
