. 2017 May 3;17(1):322.
doi: 10.1186/s12879-017-2420-y.

Universal test, treat, and keep: improving ART retention is key in cost-effective HIV control in Uganda

Affiliations

Universal test, treat, and keep: improving ART retention is key in cost-effective HIV control in Uganda

Nicky McCreesh et al. BMC Infect Dis. .

Abstract

Background: With ambitious new UNAIDS targets to end AIDS by 2030, and new WHO treatment guidelines, there is increased interest in the best way to scale-up ART coverage. We investigate the cost-effectiveness of various ART scale-up options in Uganda.

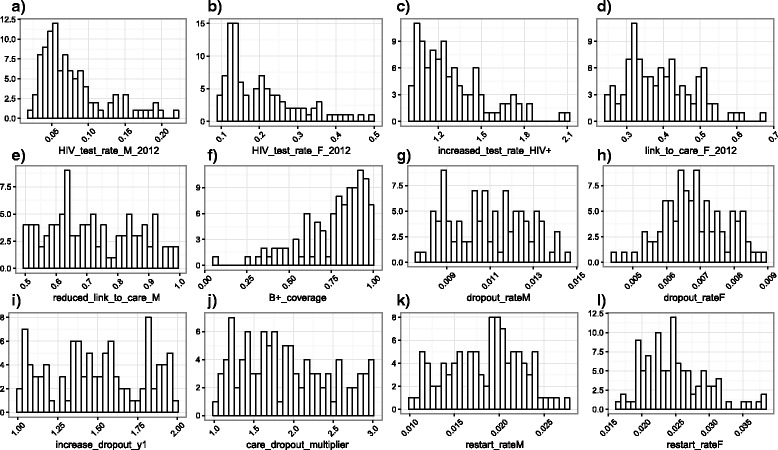
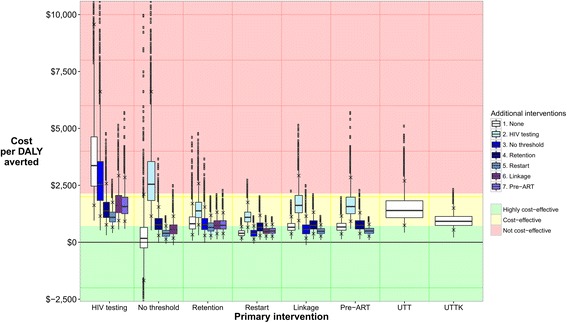
Methods: Individual-based HIV/ART model of Uganda, calibrated using history matching. 22 ART scale-up strategies were simulated from 2016 to 2030, comprising different combinations of six single interventions (1. increased HIV testing rates, 2. no CD4 threshold for ART initiation, 3. improved ART retention, 4. increased ART restart rates, 5. improved linkage to care, 6. improved pre-ART care). The incremental net monetary benefit (NMB) of each intervention was calculated, for a wide range of different willingness/ability to pay (WTP) per DALY averted (health-service perspective, 3% discount rate).

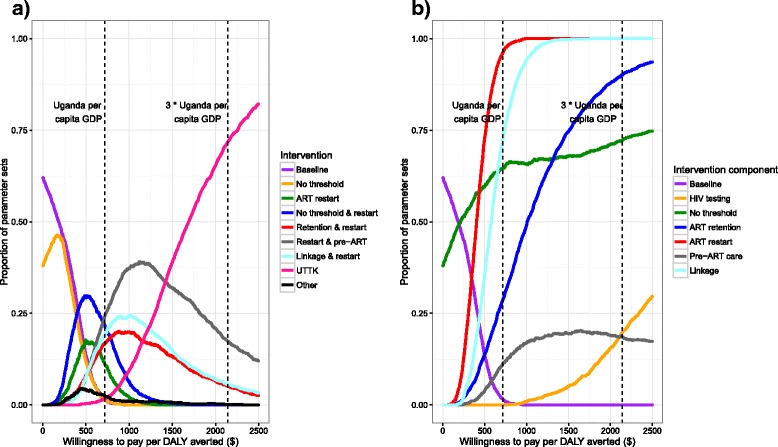
Results: For all WTP thresholds above $210, interventions including removing the CD4 threshold were likely to be most cost-effective. At a WTP of $715 (1 × per-capita-GDP) interventions to improve linkage to and retention/re-enrolment in HIV care were highly likely to be more cost-effective than interventions to increase rates of HIV testing. At higher WTP (> ~ $1690), the most cost-effective option was 'Universal Test, Treat, and Keep' (UTTK), which combines interventions 1-5 detailed above.

Conclusions: Our results support new WHO guidelines to remove the CD4 threshold for ART initiation in Uganda. With additional resources, this could be supplemented with interventions aimed at improving linkage to and/or retention in HIV care. To achieve the greatest reductions in HIV incidence, a UTTK policy should be implemented.

Keywords: ART; Cost-effectiveness; HIV; Mathematical modelling; Uganda; Universal test and treat.


Figures

Fig. 1
Fig. 1
Summary of the simulated care pathway
Fig. 2
Fig. 2
Model baseline fit to empirical data. Graphs a-f: Black dots show the empirical estimates, and the error bars show the plausible ranges for the output values. Black lines show the median model output. Blue/green bands show 10% quantiles of model outputs, from the 100 model fits. The full width of the band shows the range of the model output. Graphs g-i: Orange boxes show the empirical data and plausible ranges. Green boxes show the model output. Model fits to the remaining 20 outcomes are show in Additional file 3
Fig. 3
Fig. 3
Histograms of key input parameter values in the 100 model fits. a Baseline* rate of testing for HIV per month from 2012, in men who have not been tested within the past 6 months. b Baseline* rate of testing for HIV per month from 2012, in women who have not been tested within the past 6 months. c Increased rate of testing in HIV+ people (multiplicative). d Baseline* proportion of women linked to care following a positive HIV test, from 2012. e Proportion of men linked to care following a positive HIV test, from 2012, relative to proportion of women. f Coverage of B+ (following its adoption). g Baseline* rate of dropping out of ART in men, per month. h Baseline* rate of dropping out of ART in women, per month. i Increased rate of dropping out of ART in the first 12 months following ART initiation. j Increased rate of dropping out of pre-ART care, relative to the rate of dropping out of ART. k Baseline* rate of restarting ART in men, per month. l Baseline* rate of restarting ART in women, per month. *Before adjustment for adherence/health seeking behaviour. Histograms for all model inputs are shown in Additional file 4
Fig. 4
Fig. 4
Relative reduction in HIV incidence in 2030 in the intervention scenarios, compared to baseline. Boxes show the median and 25–75% quartiles. Crosses show the 90% plausible range. White boxes show the results for the various single intervention components, UTT, and UTTK. Shaded boxes show the results for combinations of two intervention components. Results for two-component interventions are shown twice, once for each intervention component
Fig. 5
Fig. 5
Distribution of cost per DALY averted for each intervention. White boxes show the results for single intervention components, UTT, and UTTK. Shaded boxes show the results for combinations of two intervention components. Boxes show the median and 25–75% quartiles. Crosses show the 90% plausible range. Results for two-component interventions are shown twice, once for each intervention component. Red, yellow, and green bands show areas where intervention are considered not cost-effective (cost >3 × Uganda’s per capita GDP per DALY averted, >$1430), cost-effective (cost 1–3 × Uganda’s per capita GDP per DALY averted, $715–$1430), and highly cost-effective (cost <1 × Uganda’s per capita GDP per DALY averted, <$715) respectively. In this figure, parameter sets are excluded from the results for an intervention if the number of DALYS averted is less than zero. The maximum number of parameter sets excluded for any intervention is 134/2000 (6.7%)
Fig. 6
Fig. 6
Cost-effectiveness acceptability curves. a Lines show the proportion of parameter sets for which an intervention is the most cost-effective option (highest net monetary benefit), for different willingness to pay per DALY averted thresholds. Interventions which are the most cost-effective option in less than 5% of scenarios at all willingness to pay thresholds are combined into the single category ‘other’. b Lines show the proportion of parameter sets where the most cost-effective intervention includes each individual intervention component, for different willingness to pay per DALY averted thresholds. Combinations of three and four interventions were included in the analysis for Fig. 6b, but not for Fig. 6a

Similar articles

Cited by

References

    1. Joint United Nations Programme on HIV/AIDS: The gap report. Geneva: UNAIDS 2014.
    1. Uganda AIDS Commission: HIV and AIDS Uganda Country progress report; 2014. Kampala: Uganda AIDS Commission 2015.
    1. Joint United Nations Programme on HIV/AIDS: 90–90-90: an ambitious treatment target to help end the AIDS epidemic. Geneva: UNAIDS 2014.
    1. Uganda AIDS. Commission: national HIV AND AIDS Strategic Plan 2015/2016-2019/2020. In Uganda. 2015;
    1. Ying R, Sharma M, Celum C, Baeten JM, van Rooyen H, Hughes JP, Garnett G, Barnabas RV. Home testing and counselling to reduce HIV incidence in a generalised epidemic setting: a mathematical modelling analysis. The Lancet HIV. 2016;3(6):e275–e282. doi: 10.1016/S2352-3018(16)30009-1. - DOI - PMC - PubMed

MeSH terms