. 2017 May 3;18(1):82.
doi: 10.1186/s13059-017-1211-5.

PRC2 represses transcribed genes on the imprinted inactive X chromosome in mice

Affiliations

PRC2 represses transcribed genes on the imprinted inactive X chromosome in mice

Emily Maclary et al. Genome Biol. .

Abstract

Background: Polycomb repressive complex 2 (PRC2) catalyzes histone H3K27me3, which marks many transcriptionally silent genes throughout the mammalian genome. Although H3K27me3 is associated with silenced gene expression broadly, it remains unclear why some but not other PRC2 target genes require PRC2 and H3K27me3 for silencing.

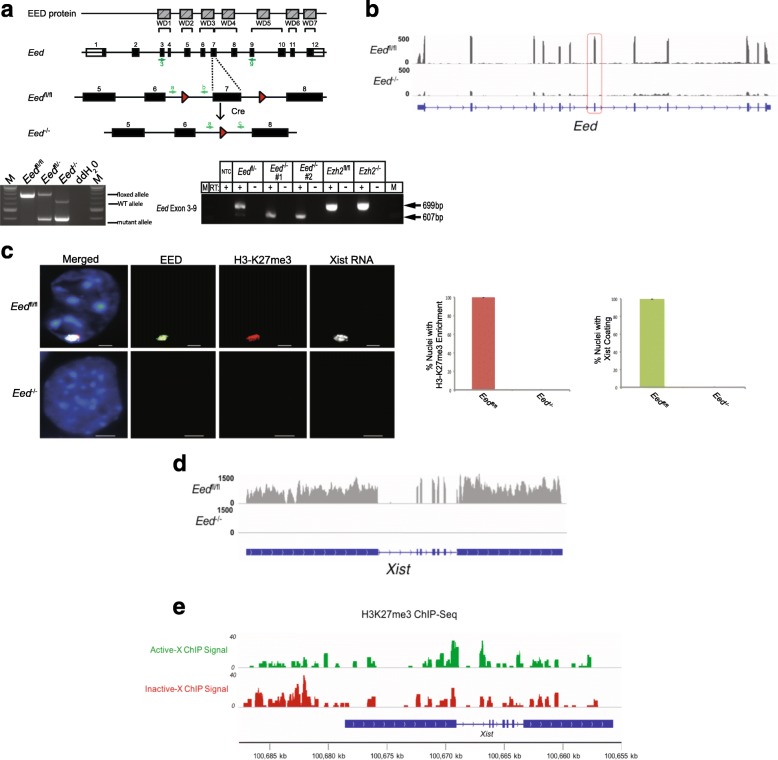
Results: Here we define the transcriptional and chromatin features that predict which PRC2 target genes require PRC2/H3K27me3 for silencing by interrogating imprinted mouse X-chromosome inactivation. H3K27me3 is enriched at promoters of silenced genes across the inactive X chromosome. To abrogate PRC2 function, we delete the core PRC2 protein EED in F1 hybrid trophoblast stem cells (TSCs), which undergo imprinted inactivation of the paternally inherited X chromosome. Eed -/- TSCs lack H3K27me3 and Xist lncRNA enrichment on the inactive X chromosome. Despite the absence of H3K27me3 and Xist RNA, only a subset of the inactivated X-linked genes is derepressed in Eed -/- TSCs. Unexpectedly, in wild-type (WT) TSCs these genes are transcribed and are enriched for active chromatin hallmarks on the inactive-X, including RNA PolII, H3K27ac, and H3K36me3, but not the bivalent mark H3K4me2. By contrast, PRC2 targets that remain repressed in Eed -/- TSCs are depleted for active chromatin characteristics in WT TSCs.

Conclusions: A comparative analysis of transcriptional and chromatin features of inactive X-linked genes in WT and Eed -/- TSCs suggests that PRC2 acts as a brake to prevent induction of transcribed genes on the inactive X chromosome, a mode of PRC2 function that may apply broadly.

Keywords: EED; H3K27me3; Imprinting; PRC2; Polycomb; Trophoblast stem cells; X-inactivation.


Figures

Fig. 1
Fig. 1
Absence of H3K27me3 enrichment and Xist RNA coating on the inactive X chromosome in Eed –/– TSCs. a Top, diagram of conditional Eed mutation. Bottom left, gel image of genotyping PCR. Bottom right, RT-PCR detection of Eed RNA in Eed fl/–, Eed –/–, and Eed +/+ samples. The location of PCR and RT-PCR primers are depicted in the diagram above in blue and green, respectively. b Loss of Eed exon 7 and reduction of mRNA in Eed –/– line by RNA-seq. c Detection of EED (green) and H3K27me3 (red) by immunofluorescence (IF) and Xist RNA (white) by RNA FISH in Eed fl/fl and Eed –/– TSCs. Nuclei are stained blue with DAPI. Scale bar, 2 μm. Right, quantifications of numbers of nuclei with H3K27me3 enrichment and Xist RNA coating in Eed fl/fl and Eed –/– TSCs. d Absence of Xist RNA expression in Eed –/– TSCs by RNA-seq. e Enrichment of H3K27me3 at Xist promoter region on the inactive paternal-X in WT TSCs
Fig. 2
Fig. 2
RNA FISH analysis of X-linked gene expression in Eed –/– TSCs. Left, RNA FISH detection of Xist RNA coating (green) and RNAs of four X-linked gene (Atrx, Rnf12, Pdha1, and Pgk1, red) in Eed fl/fl and Eed –/– TSCs. Nuclei are stained blue with DAPI. Scale bar, 2 μm. Right, quantifications of the RNA FISH data. Whereas Atrx, Rnf12, and Pdha1 remain silenced in Eed –/– TSCs, Pgk1 is derepressed from the inactive-X in the absence of EED. Three technical replicates of the Eed fl/fl TSC line and three different Eed –/– TSC lines were stained; 100 nuclei counted/gene/TSC sample
Fig. 3
Fig. 3
Identification and characterization of paternal-X expression in Eed +/+, Eed fl/fl, and Eed –/– TSCs. a Summary of allele-specific RNA-seq analysis of X-linked genes. b, c Euler diagrams assessing expression from the paternal X chromosome totaling ≥ 10% of total expression in three WT Eed +/+ TSC lines and one WT Eed fl/fl TSC line (b) and in three Eed –/– TSC lines (c). d Comparison of percent paternal-X expression in Eed –/– TSC lines compared with WT TSC lines. Percent paternal-X expression for individual Eed –/– TSC lines was compared with the average percent paternal-X expression in WT TSC lines (left). e Identification of genes with statistically significant difference in percent paternal-X expression in Eed –/– TSCs compared with WT TSCs. Percent paternal-X expression in the four WT TSC lines and three Eed –/– TSC lines was compared by T-test for the 77 genes that display a consistent increase in paternal-X expression in Eed –/– TSC lines. Of these, 74 genes are statistically significantly increased in paternal-X expression in Eed –/– TSC lines, following Benjamini–Hochberg correction of the p values for multiple testing (FDR = 0.1)
Fig. 4
Fig. 4
Characterization of expression and chromosomal location of genes with increased paternal-X expression in Eed –/– TSCs. a Plot of log2 fold change between genotypes in the expression of paternal allele, as calculated by DESeq2 (y-axis) vs. percent difference in paternal allele expression between Eed –/– and WT TSCs (x-axis) for the 74 X-linked genes exhibiting a statistically significant increase in the relative proportion of paternal:maternal allele expression. Sixty-five genes are upregulated (green) and nine genes are downregulated (red) from the paternal-X. b Table summarizing the ten X-linked genes with the greatest increase in paternal allele expression in Eed –/– TSCs. c Histogram indicating the location of all 338 X-linked genes with informative SNPs with ≥ 10X coverage (gray bars) and the 65 upregulated genes whose relative expression from the paternal allele is significantly increased (green bars). Derepressed X-linked genes are distributed across the length of the X chromosome
Fig. 5
Fig. 5
Derepressed genes are transcribed and enriched for active chromatin marks in WT TSCs. a Inactive-X profiles of H3K27me3 in WT TSCs of derepressed and non-derepressed genes in Eed –/– TSCs and of X-inactivation escapees in WT TSCs. b Inactive-X profiles for DNAseI hypersensitivity (DNAseI HS), RNA PolII occupancy, H3K27ac, H3K4me2, and H3K36me3. c Correlation between percent paternal-X expression in WT and Eed –/– TSCs. d Paternal-X contribution for all expressed X-linked genes in WT TSCs. The x-axis indicates the rank order of each gene from least to most paternal-X expression in WT TSCs. Gray dots indicate non-derepressed genes and red dots mark genes that are derepressed in Eed –/– TSCs. The y-axis depicts percent paternal-X expression for each gene. The expressed paternal X-linked genes can be divided into five quintiles. The derepressed genes are over-represented in quintile 4. e Table of number of genes and their percent paternal-X expression within the quintiles described in (d). f Left, boxplots of absolute paternal-X expression (as RNA-seq reads per kilobase of gene per million reads [RPKM]) for non-derepressed and derepressed genes in quintile 4 (3–6% paternal-X:total X-chromosomal expression). Derepressed genes exhibit a significantly higher median expression level than non-derepressed genes (p < 0.001, Mann–Whitney U test). Right, boxplots of absolute paternal-X expression (Log2 scaled, as RPKM) for all non-derepressed and derepressed genes. As with quintile 4, derepressed genes exhibit a significantly higher median expression level than non-derepressed genes (p < 0.05, Mann–Whitney U test)
Fig. 6
Fig. 6
A model for PRC2 function in repressing genes. Two classes of X-linked genes are distinguished by chromatin architecture. One gene set is characterized by little to no expression from the paternal-X in WT cells and harbors only H3K27me3 at the TSSs. Upon loss of EED, these genes maintain a relatively closed chromatin conformation and are not predisposed to activation. A second class of genes is characterized in WT cells by RNA PolII occupancy and open chromatin architecture and low-level transcription. Upon loss of EED and H3K27me3, the open chromatin architecture and RNA PolII occupancy facilitate rapid upregulation of these genes

References

    1. Margueron R, Reinberg D. The Polycomb complex PRC2 and its mark in life. Nature. 2011;469:343–9. doi: 10.1038/nature09784. - DOI - PMC - PubMed
    1. Ragunathan K, Jih G, Moazed D. Epigenetics. Epigenetic inheritance uncoupled from sequence-specific recruitment. Science. 2015;348:1258699. doi: 10.1126/science.1258699. - DOI - PMC - PubMed
    1. Zhang T, Cooper S, Brockdorff N. The interplay of histone modifications - writers that read. EMBO Rep. 2015;16:1467–81. doi: 10.15252/embr.201540945. - DOI - PMC - PubMed
    1. Cao R, Wang L, Wang H, Xia L, Erdjument-Bromage H, Tempst P, et al. Role of histone H3 lysine 27 methylation in Polycomb-group silencing. Science. 2002;298:1039–43. doi: 10.1126/science.1076997. - DOI - PubMed
    1. Czermin B, Melfi R, McCabe D, Seitz V, Imhof A, Pirrotta V. Drosophila enhancer of Zeste/ESC complexes have a histone H3 methyltransferase activity that marks chromosomal Polycomb sites. Cell. 2002;111:185–96. doi: 10.1016/S0092-8674(02)00975-3. - DOI - PubMed

Publication types