. 2017 Jun 5;214(6):1827-1841.
doi: 10.1084/jem.20161017. Epub 2017 May 3.

Two alternate strategies for innate immunity to Epstein-Barr virus: One using NK cells and the other NK cells and γδ T cells

Affiliations

Two alternate strategies for innate immunity to Epstein-Barr virus: One using NK cells and the other NK cells and γδ T cells

Zakia Djaoud et al. J Exp Med. .

Abstract

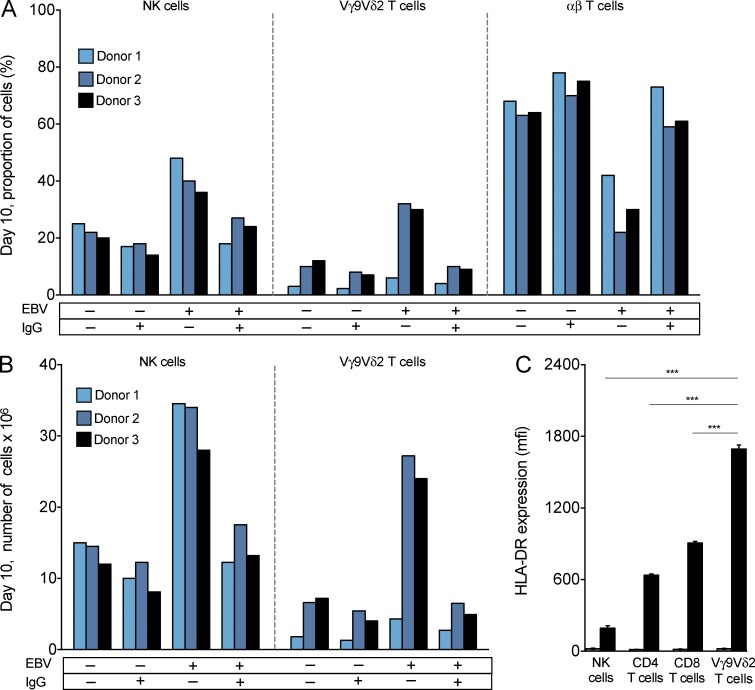
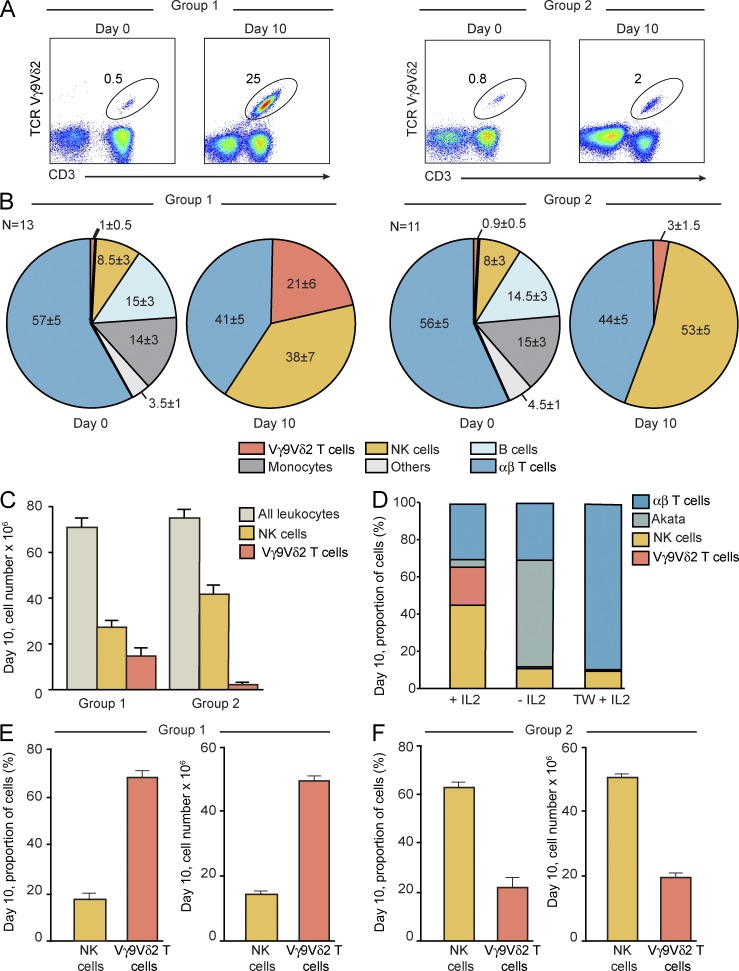
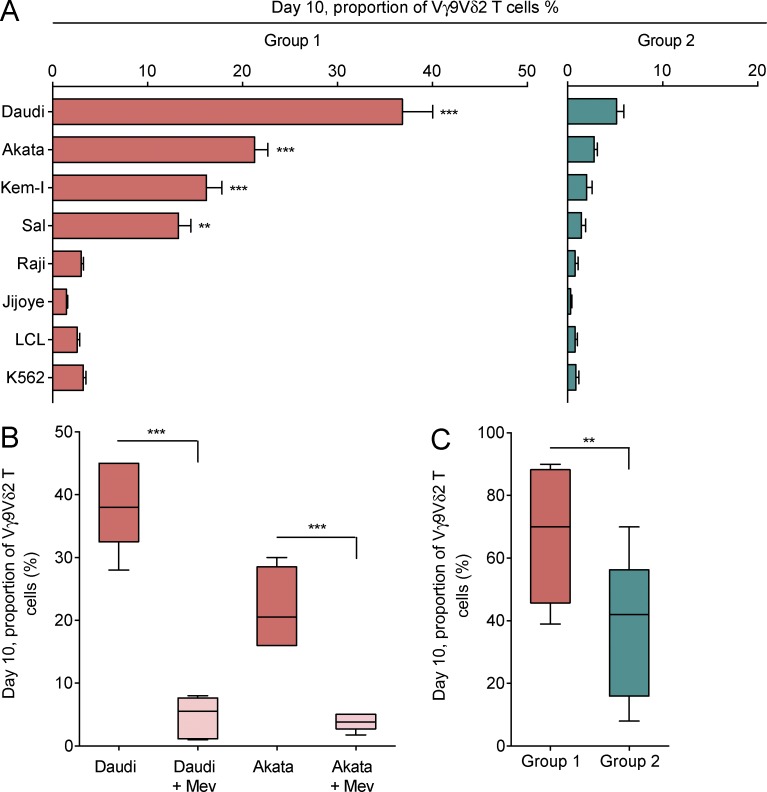
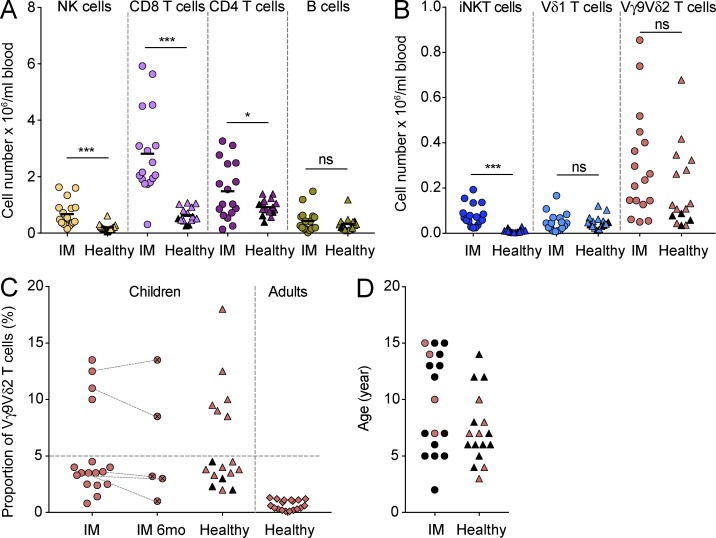
Most humans become infected with Epstein-Barr virus (EBV), which then persists for life. Infrequently, EBV infection causes infectious mononucleosis (IM) or Burkitt lymphoma (BL). Type I EBV infection, particularly type I BL, stimulates strong responses of innate immune cells. Humans respond to EBV in two alternative ways. Of 24 individuals studied, 13 made strong NK and γδ T cell responses, whereas 11 made feeble γδ T cell responses but stronger NK cell responses. The difference does not correlate with sex, HLA type, or previous exposure to EBV or cytomegalovirus. Cohorts of EBV+ children and pediatric IM patients include both group 1 individuals, with high numbers of γδ T cells, and group 2 individuals, with low numbers. The even balance of groups 1 and 2 in the human population points to both forms of innate immune response to EBV having benefit for human survival. Correlating these distinctive responses with the progress of EBV infection might facilitate the management of EBV-mediated disease.


Figures

Figure 1.
Figure 1.
NK cells and Vγ9Vδ2 T cells proliferate in response to latently infected EBV+ B cells. PBMCs were stimulated in culture for 10 d with IL2 and target cells. The targets were either EBV+ (denoted EBV +) or EBV (denoted EBV −) Akata. They were either stimulated with anti-IgG (denoted IgG +) or not stimulated (denoted IgG −). (A) For day 10 cultures, histograms show the percentage of total cell number that were NK cells, Vγ9Vδ2 T cells, and αβ T cells. Shown are the results from one experiment, representing three performed. (B) Histograms show the absolute numbers of NK cells and Vγ9Vδ2 T cells in day 10 cultures. Shown are the results from one experiment, representing three performed. (C) Histogram comparing the mean fluorescence intensity (MFI ± SD; n = 4) for HLA-DR expression by NK cells, Vγ9Vδ2 T cells, CD4 T cells, and CD8 T cells at day 0 (gray bars) and day 10 (black bars) of PBMC stimulation with latent EBV+ Akata and IL2. Shown are the results from one experiment, representing four performed, two on donor 2 PBMCs and two on donor 3 PBMCs. Statistical significance in the difference between pairs of cell types was tested using ANOVA. Statistically significant differences (***, P < 0.0001) were observed between Vγ9Vδ2 T cells and each of the other three cell types.
Figure 2.
Figure 2.
EBV-stimulated NK cells and Vγ9Vδ2 T cells exhibit similar phenotypes of early differentiation. (A) Representative 3D plots showing the expression pattern of NKG2A, NKG2C, and KIR2DL3 by NK cells. NKG2A expression is given on the y axis, NKG2C expression on the x axis, and KIR2DL/3 expression by the color of the data points, as depicted under signal intensity. Analyzed are the day 0 and 10 cultures of PBMCs, from CMV (donor 1) and CMV+ (donor 3) individuals, that were stimulated with Akata and IL2. Shown are the results from one experiment, representing three performed. (B) Representative viSNE maps of NK and Vγ9Vδ2 T cells at day 0 and NK cells and Vγ9Vδ2 T cells that proliferated during a 10-d stimulation of PBMCs with Akata cells and IL2. Each point in the viSNE map represents one cell; the points are colored to reflect the expression level of the indicated protein. Shown are the results from one experiment, representing three performed.
Figure 3.
Figure 3.
Bimodality in the human Vγ9Vδ2 T cell response to EBV. (A) 2D plots showing the size of the Vγ9Vδ2 T cell subpopulation in total unstimulated PBMCs and PBMCs after 10 d of culture with Akata cells. Representative data are shown for one group 1 donor (left; n = 13) and one group 2 donor (right; n = 11). (B) Pie charts showing the relative numbers (percentage of total cells) of Vγ9Vδ2 T cells, αβ T cells, NK cells, monocytes, B cells, and other cells in unstimulated PBMCs (day 0) and in PBMCs stimulated for 10 d with Akata cells (day 10). Mean values and SDs are given. For day 0 and day 10, the data for the group 1 donors (left; n = 13) and group 2 donors (right; n = 11) were analyzed separately. Statistically significant difference (P < 0.0001) was assessed between group 1 and group 2 Vγ9Vδ2 T cell proportions using ANOVA. (C) Histogram showing the absolute numbers of cells from cultures at day 10 for all leukocytes, NK cells, and Vγ9Vδ2 T cells. Mean values and SDs are given. The data for the group 1 donors (n = 13) and group 2 donors (n = 11) were analyzed separately. Statistically significant difference (P < 0.0001) was assessed between group 1 and group 2 Vγ9Vδ2 T cell numbers using ANOVA. (D) Histogram showing the proportions of Vγ9Vδ2 T cells, αβ T cells, NK cells, and Akata cells after 10-d culture of PBMCs with Akata cells. Three conditions were used: presence of IL2, absence of IL2, and presence of IL2 with separation of PBMCs from Akata targets by a Transwell (TW) system. PBMCs from three group 2 donors were studied. Shown is one representative of three experiments performed. (E and F) Histograms showing the proportions and absolute numbers of NK cells and Vγ9Vδ2 T cells after 10-d culture of PBMCs, depleted of CD4 and CD8 T cells, with Akata cells and IL2. Mean values ± SD are given. PBMCs from three group 1 donors (E) and three group 2 donors (F) were studied.
Figure 4.
Figure 4.
Vγ9Vδ2 T cells from group 1 donors proliferate in response to type I EBV infection. (A) PBMCs from six group 1 donors (orange) and six group 2 donors (green) were stimulated in culture for 10 d with IL2 and target cells. The targets were type I BL cell lines (Daudi, Akata, and Kem-I), the Wp-restricted BL cell line Sal, type III BL cell lines (Raji and Jijoye), and type III EBV-infected LCL and K562. Bar graphs give the proportion of Vγ9Vδ2 T cells after the 10-d culture. Mean values ± SEM are also given. Statistically significant difference between each experimental target cell and the negative control, K562 cells, was assessed using ANOVA (**, P < 0.008; ***, P < 0.0001). (B) PBMCs from six group 1 donors were stimulated in culture for 10 d with IL2 and target cells. The targets were Daudi and Akata, either preincubated (light pink) or not preincubated (orange) for 24 h with 80 µM mevastatin (Mev). Boxes and whiskers represent the proportion of Vγ9Vδ2 T cells after the 10-d culture. Statistical significance in the difference between experiment and control was assessed using ANOVA (***, P < 0.0001). (C) Boxes and whiskers represent the proportion of Vγ9Vδ2 T cells after 10-d culture of PBMCs from eight group 1 donors (orange) and eight group 2 donors (green), in the presence of 100 µM IPP and IL2. Statistical significance in the difference between the two groups was assessed using the unpaired two-tailed Student’s t test (**, P < 0.01).
Figure 5.
Figure 5.
A role for CD277 and NKG2D in the activation of Vγ9Vδ2 T cells by type I EBV infection. PBMCs from eight group 1 donors were preincubated with antagonistic mAbs against NKp30, DNAM-1, 2B4, CD2, NKG2D, CD277, or a control mouse IgG. They were then stimulated with Akata for 10 d in the presence of IL2. In other cultures, PBMCs alone were stimulated for 10 d with Akata cells preincubated with anti-CD277 or IgG control. Boxes and whiskers represent the proportion of Vγ9Vδ2 T cells (orange) and NK cells (yellow) after the 10-d culture with Akata cells. Hatched boxes and whiskers represent the proportion of Vγ9Vδ2 T cells (orange) and NK cells (yellow) after the 10-d culture with Akata cells preincubated with anti-CD277 or IgG control. Statistical significance of the difference between experiment and control was assessed using ANOVA (*, P = 0.01; **, P < 0.003; ***, P < 0.0001; ns, nonsignificant).
Figure 6.
Figure 6.
Group 1 Vγ9Vδ2 T cells are functionally more potent in their response to type I EBV infection than group 2 Vγ9Vδ2 T cells. PBMCs from six group 1 donors and six group 2 donors were incubated in culture either alone (Ø) or in the presence of target cells. The targets were Raji (a negative control), Akata, and Daudi. (A) Boxes and whiskers represent the proportion of granzyme B+ Vγ9Vδ2 T cells from group 1 donors (orange) and group 2 donors (green) after 24-h culture. (B) Boxes and whiskers represent the proportion of IFNγ+ Vγ9Vδ2 T cells from group 1 donors (orange) and group 2 donors (green) after 24-h culture. (C) Boxes and whiskers represent the proportion of MIP1-β+ Vγ9Vδ2 T cells from group 1 donors (orange) and group 2 donors (green) after 24-h culture. Statistical significance of the difference between experiment and control was assessed using ANOVA (*, P ≤ 0.04; **, P < 0.004; ***, P ≤ 0.0006; ns, nonsignificant).
Figure 7.
Figure 7.
Bimodality in the human Vγ9Vδ2 T cell response to EBV in vivo. (A) Scatter plots represent the absolute numbers of NK cells (yellow), CD8 T cells (light violet), CD4 T cells (dark violet), and B cells (green) in peripheral blood of children experiencing acute IM (circles) and healthy children (triangles). EBV healthy children are indicated by black triangles. Mean values are given. Statistical significance in the difference between IM and healthy children was assessed using the unpaired Student’s t test (*, P = 0.04; ***, P ≤ 0.0005; ns, nonsignificant). (B) Scatter plots represent the absolute numbers of iNKT cells (dark blue), Vδ1 T cells (light blue), and Vγ9Vδ2 T cells (orange) in peripheral blood of children experiencing acute IM (circles) and healthy children (triangles). EBV healthy children are indicated by black triangles. Statistical significance in the difference between IM and healthy children was assessed using the unpaired Student’s t test (***, P < 0.0001; ns, nonsignificant). (C) Scatter plots represent the proportion of Vγ9Vδ2 T cells in peripheral blood of children experiencing acute IM (circles), children at 6 mo after the diagnosis of IM (crossed circles), healthy children (triangles), and healthy adults (diamonds). EBV healthy children are indicated by black triangles. (D) Scatter plots represent the age of children experiencing acute IM (circles) and healthy children (triangles). Children who exhibited high proportions of Vγ9Vδ2 T cells are indicated in orange.

References

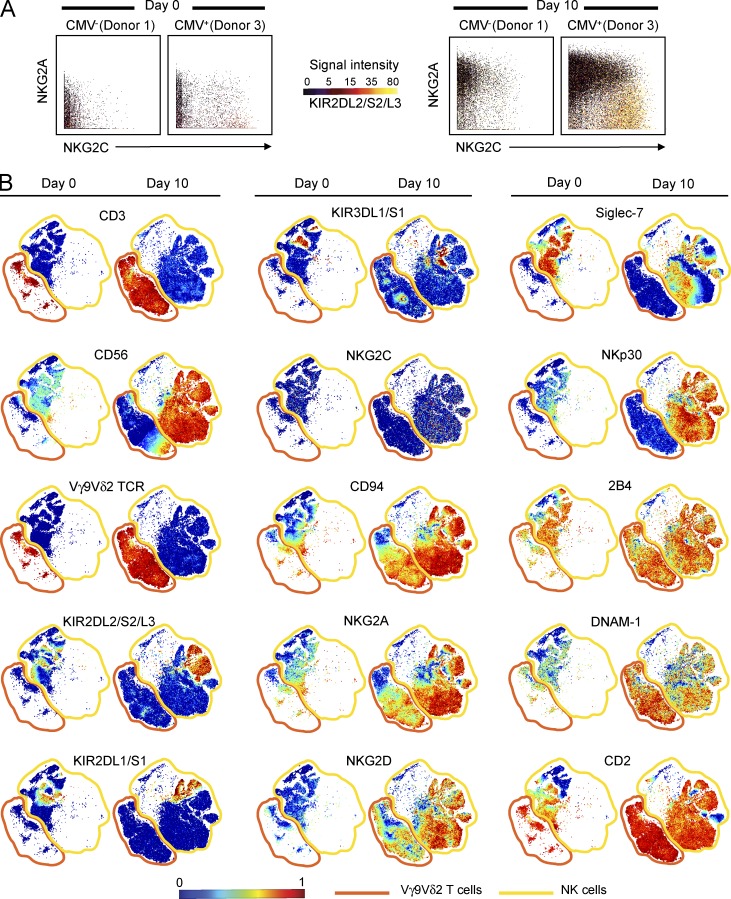
    1. Amir A.D., Davis K.L., Tadmor M.D., Simonds E.F., Levine J.H., Bendall S.C., Shenfeld D.K., Krishnaswamy S., Nolan G.P., and Pe’er D.. 2013. viSNE enables visualization of high dimensional single-cell data and reveals phenotypic heterogeneity of leukemia. Nat. Biotechnol. 31:545–552. 10.1038/nbt.2594 - DOI - PMC - PubMed
    1. Azzi T., Lünemann A., Murer A., Ueda S., Béziat V., Malmberg K.-J., Staubli G., Gysin C., Berger C., Münz C., et al. . 2014. Role for early-differentiated natural killer cells in infectious mononucleosis. Blood. 124:2533–2543. 10.1182/blood-2014-01-553024 - DOI - PMC - PubMed
    1. Béziat V., Dalgard O., Asselah T., Halfon P., Bedossa P., Boudifa A., Hervier B., Theodorou I., Martinot M., Debré P., et al. . 2012. CMV drives clonal expansion of NKG2C+ NK cells expressing self-specific KIRs in chronic hepatitis patients. Eur. J. Immunol. 42:447–457. 10.1002/eji.201141826 - DOI - PubMed
    1. Bukowski J.F., Morita C.T., and Brenner M.B.. 1994. Recognition and destruction of virus-infected cells by human gamma delta CTL. J. Immunol. 153:5133–5140. - PubMed
    1. Chen Z.W. 2013. Multifunctional immune responses of HMBPP-specific Vγ2Vδ2 T cells in M. tuberculosis and other infections. Cell. Mol. Immunol. 10:58–64. 10.1038/cmi.2012.46 - DOI - PMC - PubMed

Publication types

MeSH terms