

Inflammatory Differences in Plaque Erosion and Rupture in Patients With ST-Segment Elevation Myocardial Infarction
- PMID: 28468787
- PMCID: PMC5524113
- DOI: 10.1161/JAHA.117.005868
Inflammatory Differences in Plaque Erosion and Rupture in Patients With ST-Segment Elevation Myocardial Infarction
Abstract
Background: Plaque erosion causes 30% of ST-segment elevation myocardial infarctions, but the underlying cause is unknown. Inflammatory infiltrates are less abundant in erosion compared with rupture in autopsy studies. We hypothesized that erosion and rupture are associated with significant differences in intracoronary cytokines in vivo.
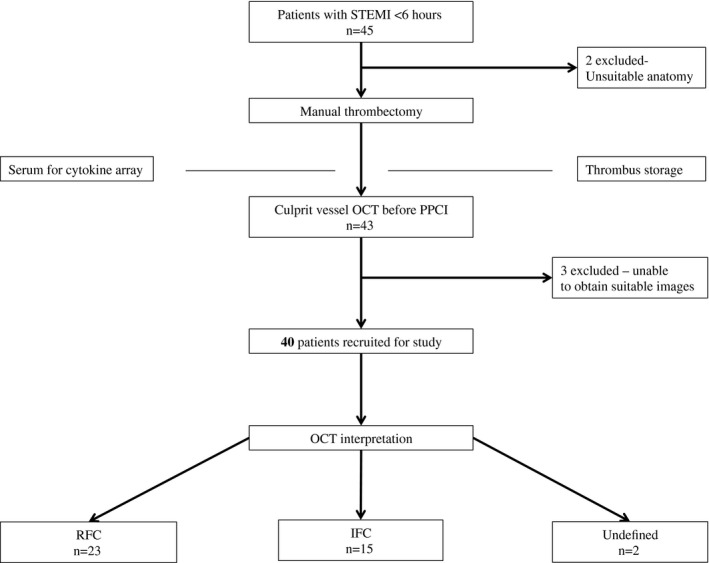
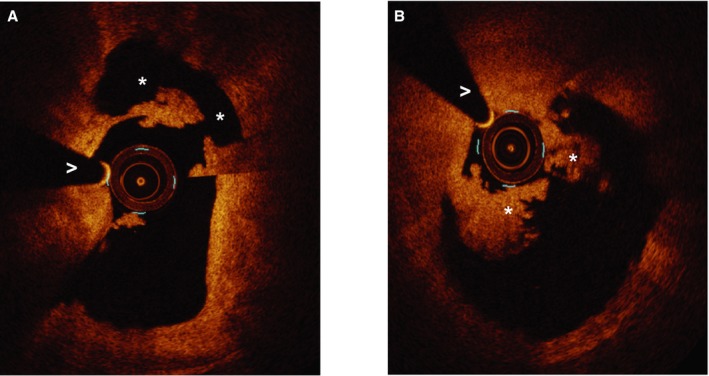
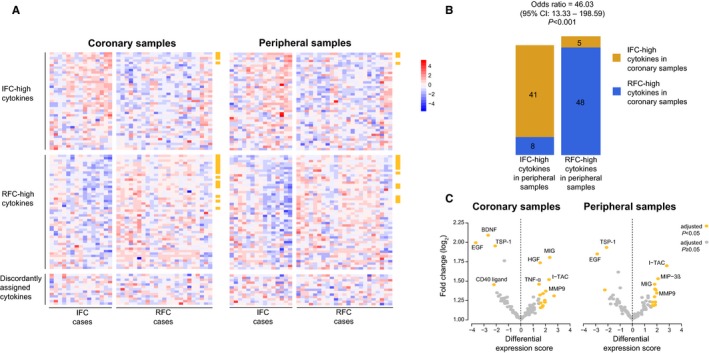
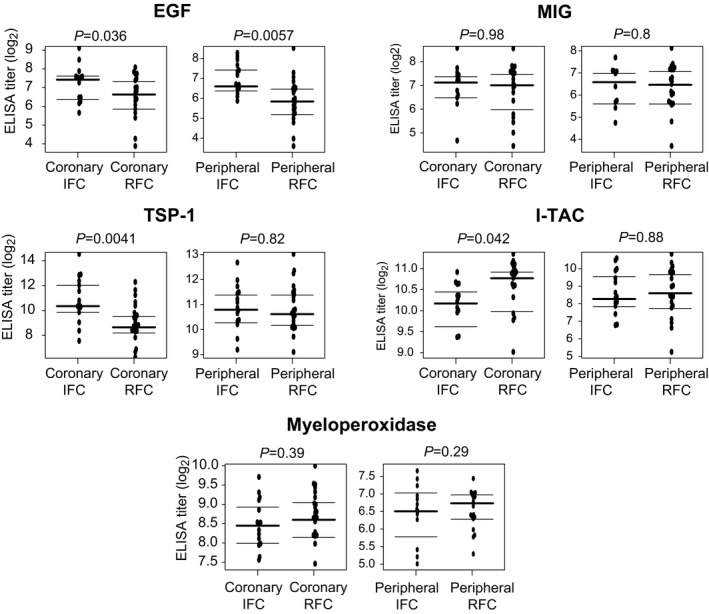
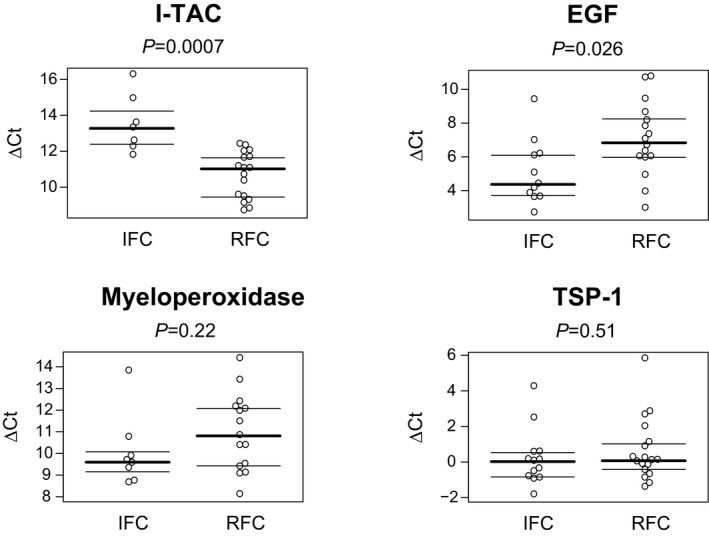
Methods and results: Forty ST-segment elevation myocardial infarction patients with <6 hours of chest pain were classified as ruptured fibrous cap (RFC) or intact fibrous cap (IFC) using optical coherence tomography. Plasma samples from the infarct-related artery and a peripheral artery were analyzed for expression of 102 cytokines using arrays; results were confirmed with ELISA. Thrombectomy samples were analyzed for differential mRNA expression using quantitative real-time polymerase chain reaction. Twenty-three lesions were classified as RFC (58%), 15 as IFC (38%), and 2 were undefined (4%). In addition, 12% (12 of 102) of cytokines were differentially expressed in both coronary and peripheral plasma. I-TAC was preferentially expressed in RFC (significance analysis of microarrays adjusted P<0.001; ELISA IFC 10.2 versus RFC 10.8 log2 pg/mL; P=0.042). IFC was associated with preferential expression of epidermal growth factor (significance analysis of microarrays adjusted P<0.001; ELISA IFC 7.42 versus RFC 6.63 log2 pg/mL, P=0.036) and thrombospondin 1 (significance analysis of microarrays adjusted P=0.03; ELISA IFC 10.4 versus RFC 8.65 log2 ng/mL, P=0.0041). Thrombectomy mRNA showed elevated I-TAC in RFC (P=0.0007) epidermal growth factor expression in IFC (P=0.0264) but no differences in expression of thrombospondin 1.
Conclusions: These results demonstrate differential intracoronary cytokine expression in RFC and IFC. Elevated thrombospondin 1 and epidermal growth factor may play an etiological role in erosion.
Keywords: coronary artery disease; erosion; inflammation; myocardial infarction; optical coherence tomography; thrombospondin 1.
© 2017 The Authors. Published on behalf of the American Heart Association, Inc., by Wiley.
Figures
Similar articles
-
Eroded Versus Ruptured Plaques at the Culprit Site of STEMI: In Vivo Pathophysiological Features and Response to Primary PCI.JACC Cardiovasc Imaging. 2015 May;8(5):566-575. doi: 10.1016/j.jcmg.2015.01.018. Epub 2015 Apr 15. JACC Cardiovasc Imaging. 2015. PMID: 25890582 Clinical Trial.
-
Identification of Optical Coherence Tomography-Defined Coronary Plaque Erosion by Preprocedural Computed Tomography Angiography.J Am Heart Assoc. 2023 May 16;12(10):e029239. doi: 10.1161/JAHA.122.029239. Epub 2023 May 15. J Am Heart Assoc. 2023. PMID: 37183866 Free PMC article.
-
Plasma Trimethylamine N-Oxide as a Novel Biomarker for Plaque Rupture in Patients With ST-Segment-Elevation Myocardial Infarction.Circ Cardiovasc Interv. 2019 Jan;12(1):e007281. doi: 10.1161/CIRCINTERVENTIONS.118.007281. Circ Cardiovasc Interv. 2019. PMID: 30599768
-
Plaque erosion causing ST-segment elevation myocardial infarction: report of an optical coherence tomography-documented case and concise literature review.Coron Artery Dis. 2017 Jun;28(4):355-357. doi: 10.1097/MCA.0000000000000463. Coron Artery Dis. 2017. PMID: 28441670 Review. No abstract available.
-
Acute coronary syndromes without coronary plaque rupture.Nat Rev Cardiol. 2016 May;13(5):257-65. doi: 10.1038/nrcardio.2016.19. Epub 2016 Feb 25. Nat Rev Cardiol. 2016. PMID: 26911330 Review.
Cited by
-
New Concepts on the Pathophysiology of Acute Coronary Syndrome.Rev Cardiovasc Med. 2023 Apr 17;24(4):112. doi: 10.31083/j.rcm2404112. eCollection 2023 Apr. Rev Cardiovasc Med. 2023. PMID: 39076267 Free PMC article. Review.
-
The Role of Natural Killer (NK) Cells in Acute Coronary Syndrome: A Comprehensive Review.Biomolecules. 2020 Nov 5;10(11):1514. doi: 10.3390/biom10111514. Biomolecules. 2020. PMID: 33167533 Free PMC article. Review.
-
Plaque erosion and acute coronary syndromes: phenotype, molecular characteristics and future directions.Nat Rev Cardiol. 2021 Oct;18(10):724-734. doi: 10.1038/s41569-021-00542-3. Epub 2021 May 5. Nat Rev Cardiol. 2021. PMID: 33953381 Review.
-
Neutrophil Extracellular Traps Induce Endothelial Cell Activation and Tissue Factor Production Through Interleukin-1α and Cathepsin G.Arterioscler Thromb Vasc Biol. 2018 Aug;38(8):1901-1912. doi: 10.1161/ATVBAHA.118.311150. Arterioscler Thromb Vasc Biol. 2018. PMID: 29976772 Free PMC article.
-
Implications for neutrophils in cardiac arrhythmias.Am J Physiol Heart Circ Physiol. 2024 Mar 1;326(3):H441-H458. doi: 10.1152/ajpheart.00590.2023. Epub 2023 Dec 15. Am J Physiol Heart Circ Physiol. 2024. PMID: 38099844 Free PMC article. Review.
References
-
- Guagliumi G, Capodanno D, Saia F, Musumeci G, Tarantini G, Garbo R, Tumminello G, Sirbu V, Coccato M, Fineschi M, Trani C, De Benedictis M, Limbruno U, De Luca L, Niccoli G, Bezerra H, Ladich E, Costa M, Biondi Zoccai G, Virmani R. Mechanisms of atherothrombosis and vascular response to primary percutaneous coronary intervention in women versus men with acute myocardial infarction: results of the OCTAVIA study. JACC Cardiovasc Interv. 2014;7:958–968. - PubMed
-
- Jia H, Abtahian F, Aguirre AD, Lee S, Chia S, Lowe H, Kato K, Yonetsu T, Vergallo R, Hu S, Tian J, Lee H, Park SJ, Jang YS, Raffel OC, Mizuno K, Uemura S, Itoh T, Kakuta T, Choi SY, Dauerman HL, Prasad A, Toma C, McNulty I, Zhang S, Yu B, Fuster V, Narula J, Virmani R, Jang IK. In vivo diagnosis of plaque erosion and calcified nodule in patients with acute coronary syndrome by intravascular optical coherence tomography. J Am Coll Cardiol. 2013;62:1748–1758. - PMC - PubMed
-
- Niccoli G, Montone RA, Di Vito L, Gramegna M, Refaat H, Scalone G, Leone AM, Trani C, Burzotta F, Porto I, Aurigemma C, Prati F, Crea F. Plaque rupture and intact fibrous cap assessed by optical coherence tomography portend different outcomes in patients with acute coronary syndrome. Eur Heart J. 2015;36:1377–1384. - PubMed
-
- Libby P. Mechanisms of acute coronary syndromes and their implications for therapy. N Engl J Med. 2013;368:2004–2013. - PubMed
-
- Jia H, Dai J, Hou J, Xing L, Ma L, Liu H, Xu M, Yao Y, Hu S, Yamamoto E, Lee H, Zhang S, Yu B, Jang I. Effective anti‐thrombotic therapy without stenting: intravascular optical coherence tomography‐based management in plaque erosion (the EROSION study). Eur Heart J. 2016;38:1–9. - PubMed
MeSH terms
Substances
LinkOut - more resources
Full Text Sources
Other Literature Sources
Medical
Miscellaneous
