. 2017 Jul;206(3):1237-1250.
doi: 10.1534/genetics.117.200303. Epub 2017 May 3.

Whole-Genome Restriction Mapping by "Subhaploid"-Based RAD Sequencing: An Efficient and Flexible Approach for Physical Mapping and Genome Scaffolding

Affiliations

Whole-Genome Restriction Mapping by "Subhaploid"-Based RAD Sequencing: An Efficient and Flexible Approach for Physical Mapping and Genome Scaffolding

Jinzhuang Dou et al. Genetics. 2017 Jul.

Abstract

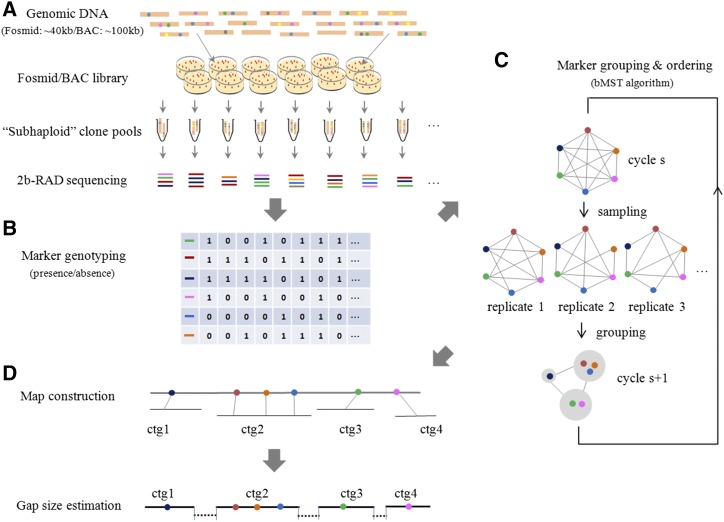
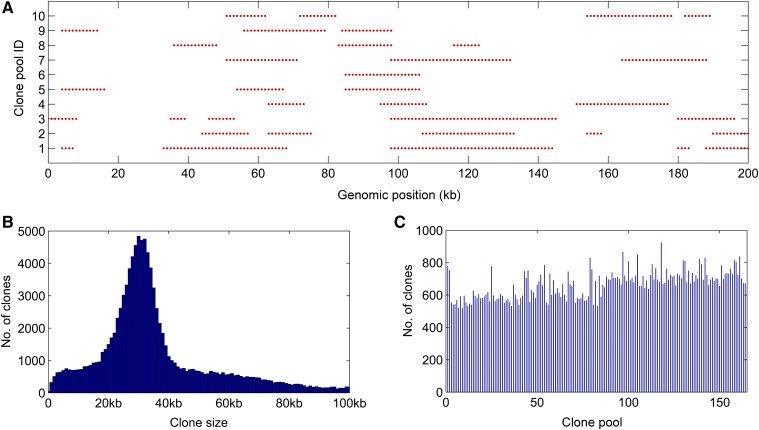
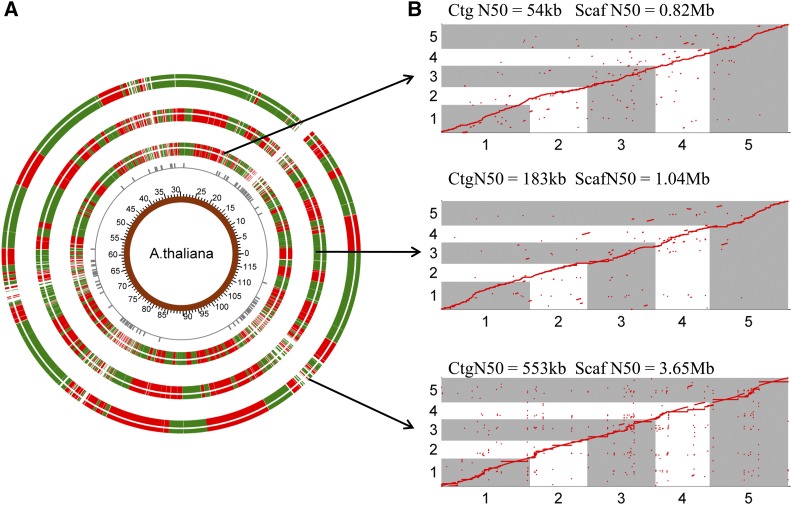
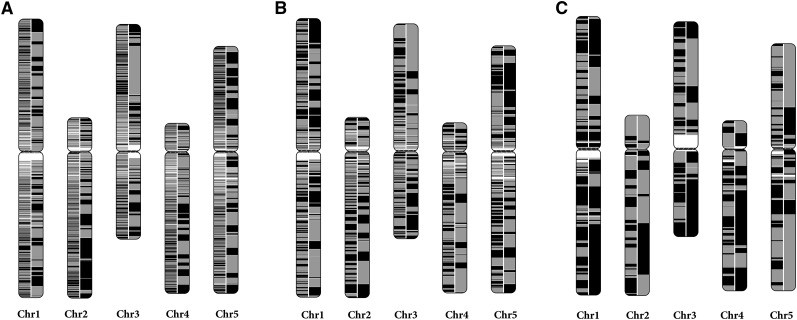
Assembly of complex genomes using short reads remains a major challenge, which usually yields highly fragmented assemblies. Generation of ultradense linkage maps is promising for anchoring such assemblies, but traditional linkage mapping methods are hindered by the infrequency and unevenness of meiotic recombination that limit attainable map resolution. Here we develop a sequencing-based "in vitro" linkage mapping approach (called RadMap), where chromosome breakage and segregation are realized by generating hundreds of "subhaploid" fosmid/bacterial-artificial-chromosome clone pools, and by restriction site-associated DNA sequencing of these clone pools to produce an ultradense whole-genome restriction map to facilitate genome scaffolding. A bootstrap-based minimum spanning tree algorithm is developed for grouping and ordering of genome-wide markers and is implemented in a user-friendly, integrated software package (AMMO). We perform extensive analyses to validate the power and accuracy of our approach in the model plant Arabidopsis thaliana and human. We also demonstrate the utility of RadMap for enhancing the contiguity of a variety of whole-genome shotgun assemblies generated using either short Illumina reads (300 bp) or long PacBio reads (6-14 kb), with up to 15-fold improvement of N50 (∼816 kb-3.7 Mb) and high scaffolding accuracy (98.1-98.5%). RadMap outperforms BioNano and Hi-C when input assembly is highly fragmented (contig N50 = 54 kb). RadMap can capture wide-range contiguity information and provide an efficient and flexible tool for high-resolution physical mapping and scaffolding of highly fragmented assemblies.

Keywords: RAD sequencing; genome scaffolding; in vitro linkage mapping; restriction map.


Figures

Figure 1
Figure 1
Overview of the RadMap approach for restriction mapping and genome scaffolding. (A) Generation and sequencing of subhaploid clone pools. A mapping panel is created by generating a large-insert fosmid (40 kb) or BAC (100 kb) library and then splitting it into hundreds of clone pools, with each pool representing less than one haploid genome (∼0.3–0.7×). 2bRAD libraries are prepared for each pool and then pooled together for high-throughput sequencing. (B) Marker genotyping. The presence (1) or absence (0) of a marker in each pool is determined according to the sequencing depth of the marker, and the coexisting frequencies of pairs of markers across clone pools are used to estimate the pair-wise distances between markers. (C) Marker grouping and ordering. A bMST algorithm is developed for grouping and ordering genome-wide markers. For each iteration, a certain number of clone pools are randomly picked up to estimate the pair-wise distance between markers, and then markers are assigned into different groups according to a specified threshold. One pair of markers will be placed together if they exist in one group for >60% of replications. A new cycle starts by regarding the groups generated from former cycle as new nodes, and the pair-wise distance between groups defined as the minimal distance among tags mapped along them. (D) Genome scaffolding and gap-size estimation. For scaffolding a WGS-based preassembly, the bMST algorithm can take the contigs/scaffolds from the assembly as the input for grouping and ordering as long as each contig/scaffold contains at least one BsaXI tag. The gap size between anchored contigs/scaffolds can be estimated based on a linear regression model established by comparing the map distance and true physical distance between markers. ctg, contig.
Figure 2
Figure 2
Generation and sequencing of 164 subhaploid clone pools in A. thaliana. (A) Visualization of fosmid clones distributed along the reference genome. A partial region of chromosome 1 (0–1 Mb) is chosen for display of 10 clone pools. One red ● represents a BsaXI tag. (B) The histogram of estimated insert sizes of fosmid clones. It is shown that ∼65% of clones fall into the range of 20–40 kb. (C) Distribution of inferred clone numbers across all clone pools. The average number of clones per pools is 665 (representing 0.22× haploid genome), with an SD of 85.
Figure 3
Figure 3
RadMap scaffolding of different WGS assemblies of A. thaliana. (A) Overview of three RadMap-based assemblies, with 15.1-, 5.7-, and 6.6-fold improvement of assembly contiguity. From inner to outer rings are genome coordinates, BsaXI sites with between-site distances over 40 kb, and RadMap scaffolding of three WGS assemblies generated based on Illumina MiSeq PE300, PacBio-5 kb, and PacBio-14 kb data sets (Table 3), respectively. The junctions between the red and green bands for the outermost three rings represent the gaps in the assembled genome, and most gaps result from genomic regions containing very sparse BsaXI sites (between-site distances >40 kb). (B) Dot-plot comparison of the RadMap-based assemblies and the reference genome (five chromosomes), showing high accuracy of contig linkage with Kendall’s statistic >0.98 (Table 3). One red ● represents one BsaXI tag. Ctg, contig; Scaf, scaffold.
Figure 4
Figure 4
The continuity of the RadMap-based assemblies. The A. thaliana chromosomes are painted with assembled contigs. Alternating shades indicate adjacent contigs, and each vertical transition from gray to black represents a contig boundary or alignment breakpoint. The left half of each chromosome shows the input assembly of (A) 25× MiSeq PE300 data set, (B) 5× PacBio-5 kb data set, and (C) 5× PacBio-14 kb data set, while the right half shows the corresponding RadMap-based assembly. The RadMap-based assemblies are considerably more continuous, with 15-, 6-, and 7-fold improvement of N50 and 12-, 12-, and 5-fold improvement of N90. Chr, chromosome.
Figure 5
Figure 5
Examples of RadMap-linked contigs. (A) Overview and (B) zoomed-in detail of one genomic region located on the chromosome 1 (1.45–2.40 Mb) of A. thaliana, which consists of 20 contigs generated from 25× MiSeq PE300 data set, with BsaXI tag or contig orders highly consistent with the reference genome. Chr, chromosome; Ctg, contig.
Figure 6
Figure 6
Gap-size estimation. (A) The relationship between map distance and true physical distance. The inter-contig map distances are obtained from the RadMap assembly generated using the MiSeq PE300 data set and the corresponding true physical distances are determined according to the reference genome. The map distances range from 0 to 0.5 and are split into 50 bins. The red line refers to the average physical distance of pairs of markers for each bin, and the cyan region denotes the corresponding SE region. Note only the pairs of markers with physical distance no longer than 50-kb apart are included here. (B) Comparison of the true and predicted inter-contig gap sizes. The dashed line indicates the linear least squares fit of y = 0.7752x + 2496, with the Pearson correlation r of 0.75.

Similar articles

Cited by

References

    1. Adey A., Kitzman J. O., Burton J. N., Daza R., Kumar A., et al. , 2014. In vitro, long-range sequence information for de novo genome assembly via transposase contiguity. Genome Res. 24: 2041–2049. - PMC - PubMed
    1. Alkan C., Sajjadian S., Eichler E. E., 2011. Limitations of next-generation genome sequence assembly. Nat. Methods 8: 61–65. - PMC - PubMed
    1. Andrews K. R., Good J. M., Miller M. R., Luikart G., Hohenlohe P. A., 2016. Harnessing the power of RADseq for ecological and evolutionary genomics. Nat. Rev. Genet. 17: 81–92. - PMC - PubMed
    1. Bach L. H., Gandolfi B., Grahn J. C., Millon L. V., Kent M. S., et al. , 2012. A high-resolution 15,000Rad radiation hybrid panel for the domestic cat. Cytogenet. Genome Res. 137: 7–14. - PMC - PubMed
    1. Bankevich A., Nurk S., Antipov D., Gurevich A. A., Dvorkin M., et al. , 2012. SPAdes: a new genome assembly algorithm and its applications to single-cell sequencing. J. Comput. Biol. 19: 455–477. - PMC - PubMed

Publication types