. 2017 May;14(130):20160898.
doi: 10.1098/rsif.2016.0898.

Form and function of the teleost lateral line revealed using three-dimensional imaging and computational fluid dynamics

Affiliations

Form and function of the teleost lateral line revealed using three-dimensional imaging and computational fluid dynamics

Hendrik Herzog et al. J R Soc Interface. 2017 May.

Abstract

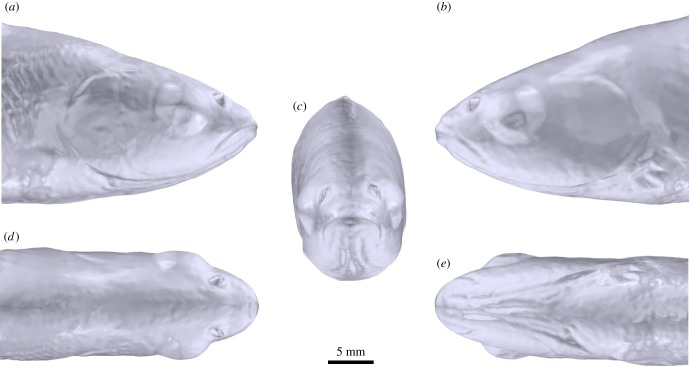
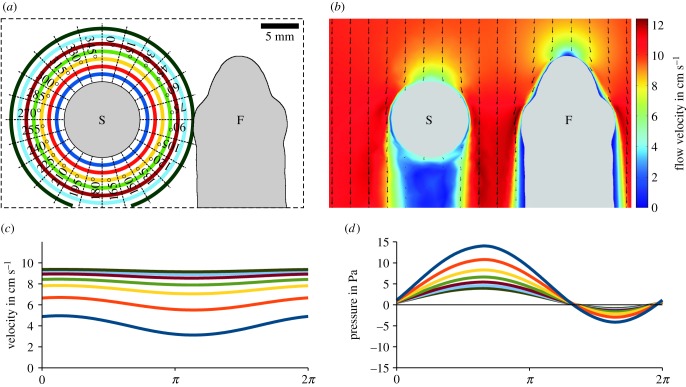
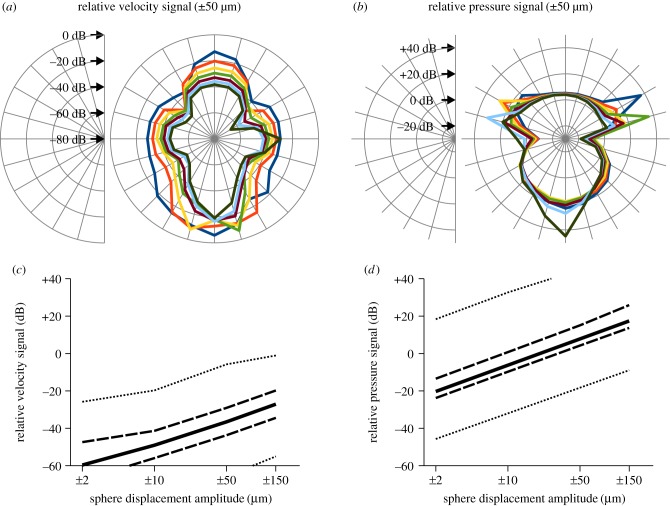
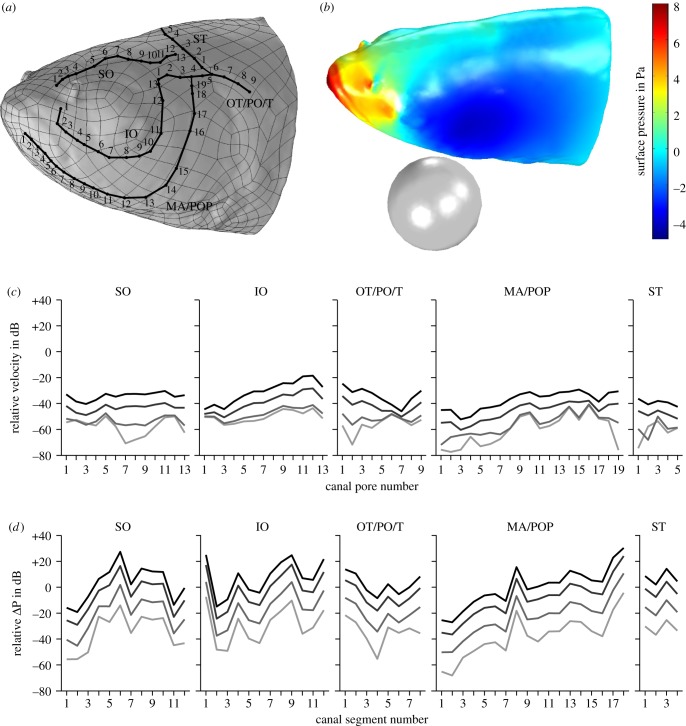
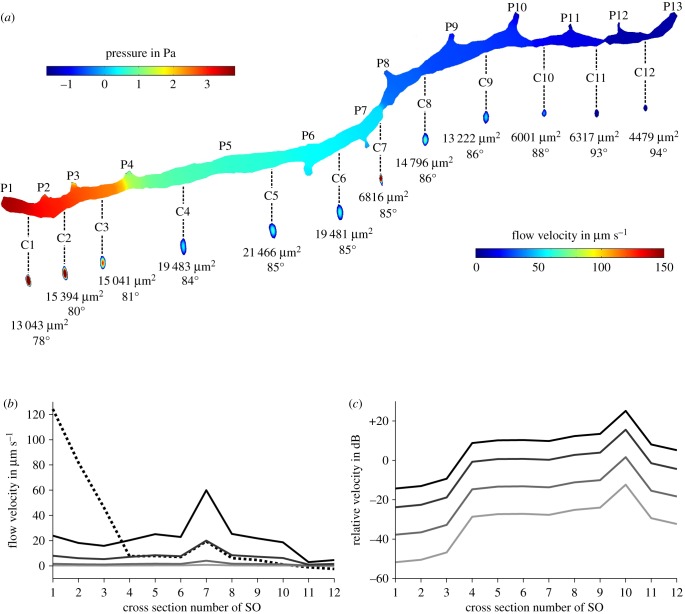
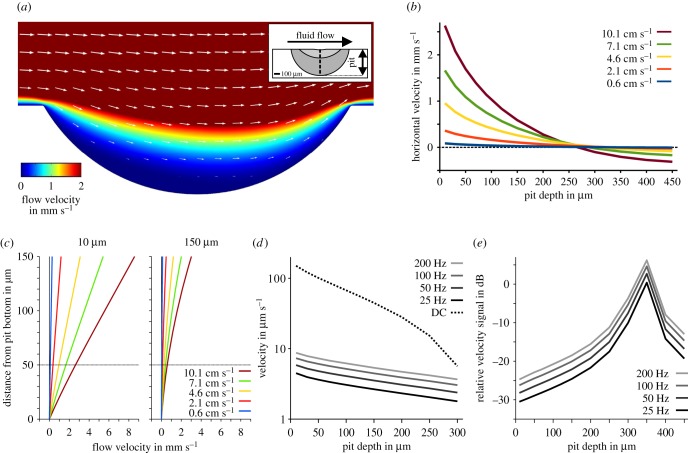
Fishes sense weak water motion using the lateral line. Among the thousands of described fish species, this organ may differ in size, shape and distribution of individual mechanoreceptors or lateral line canals. The reasons for this diversity remain unclear, but are very likely related to habitat preferences. To better understand the performance of the organ in natural hydrodynamic surroundings, various three-dimensional imaging datasets of the cephalic lateral line were gathered using Leuciscus idus as representative freshwater teleost. These data are employed to simulate hydrodynamic phenomena around the head and within lateral line canals. The results show that changes in canal dimensions alter the absolute stimulation amplitudes, but have little effect on the relation between bulk water flow and higher frequency signals. By contrast, depressions in the skin known as epidermal pits reduce bulk flow stimulation and increase the ratio between higher-frequency signals and the background flow stimulus.

Keywords: Leuciscus idus; finite-element modelling; laser scanning; micro-computed tomography; morphometry; photogrammetry.


Conflict of interest statement

We declare we have no competing interests.

Figures

Figure 1.
Figure 1.
Morphology of the cephalic lateral line of Leuciscus idus analysed using photogrammetry. Structures were visualized using methylene blue staining. (a) Right lateral, (b) left lateral, (c) anterior, (d) dorsal and (e) ventral views. IO, infraorbital canal; MA, mandibular canal; OT, otic canal; PO, postotic canal; POP, preopercular canal; sc, side canal; SO, supraorbital canal; ST, supratemporal commissure; T, temporal canal.
Figure 2.
Figure 2.
External and internal anatomy of the head of Leuciscus idus analysed using contrast-enhanced µCT. (a) Anterolateral view of a volume rendering illustrating the position of (b) sagittal, (c) transverse and (d) coronal virtual sections. Asterisk in (a) indicates a lesion of the skin caused during specimen handling. Asterisk in (b) depicts an area inside the brain with insufficient staining. Asterisk in (d) indicates a region with low X-ray absorption due to the presence of an air bubble. br, brain; ep, epithelium; es, oesophagus; gi, gill; gj, gill juncture; he, heart; IO, infraorbital canal; le, lens; MA, mandibular canal; mu, muscle tissue; ne, nerve tissue; no, nostril; ob, olfactory bulb; ot, otolith; ph, pharynx; POP, preopercular canal; pt, pharyngeal tooth; re, retina; sk, skeleton; SO, supraorbital canal; ST, supratemporal commissure.
Figure 3.
Figure 3.
Three-dimensional visualization of the cephalic lateral line of Leuciscus idus based on contrast-enhanced µCT data. Individual canals were reconstructed using manual segmentation. (a) Right lateral, (b) left lateral, (c) anterior, (d) dorsal and (e) ventral views derived from shaded and semi-transparent surface renderings. Arrows in (a) indicate the results of a ring artefact present in the µCT dataset. Oblique lines in (b) indicate the planes at which canal diameters were measured (electronic supplementary material, table S3). cp, canal pore; IO, infraorbital canal; MA, mandibular canal; OT, otic canal; PO, postotic canal; POP, preopercular canal; sc, side canal; SO, supraorbital canal; ST, supratemporal commissure; T, temporal canal.
Figure 4.
Figure 4.
Detailed structure of the cephalic lateral line in Leuciscus idus. (a) Anterolateral view of a µCT-based, semi-transparent volume rendering showing the approximate positions of the following virtual sections and renderings. (b) Transverse section through the centre of the ST showing canal lumen, canal pores (two are only partly visible: dashed lines) and CNs. (c) Transverse section through the MA showing the accessory cavity adjacent to the canal. (d) Transverse section through the anterior part of the head showing afferent nerve fibres innervating SNs located in epidermal pits. (e) Close-up view showing the presence of several clusters of epidermal pits and their location relative to the left SO and IO. (f) Same view as shown in (e), but here based on a methylene blue-stained specimen showing the location of SNs. ac, accessory cavity; CN, canal neuromast; cp, canal pore; gi, gill; IO, infraorbital canal; MA, mandibular canal; mu, muscle tissue; ne, nerve tissue; ph, pharynx; pi, pit; POP, preopercular canal; SN, superficial neuromast; SO, supraorbital canal; ST, supratemporal commissure; T, temporal canal.
Figure 5.
Figure 5.
Morphology of the head of a specimen of Leuciscus idus analysed using laser scanning. (a) Right lateral, (b) left lateral, (c) anterior, (d) dorsal and (e) ventral views of a surface-rendered 3D model.
Figure 6.
Figure 6.
Simulation of bulk water flow and pressures induced by a vibrating sphere acting on the head of Leuciscus idus. (a) Dorsal view of the experimental set-up showing the vibrating sphere and a virtual section of the fish. The coloured rings refer to distances from the sphere (1–7 mm, step size 1 mm, 24 directions in steps of 15°). (b) Changes in the flow field within the bulk water flow (10 cm s−1) induced by the vibrating sphere (amplitude ± 150 µm). Arrows show the direction of water flow, while the colour map indicates flow velocity magnitude. (c,d) Time course of the magnitude of the flow velocity (c) and pressure (d) along the main vibrational axis (0° in (a)) at distances of 1–7 mm for one cycle of sphere vibration (amplitude ± 50 µm). Note the vertical offsets of the sinusoidal signals. F, fish; S, sphere.
Figure 7.
Figure 7.
Spatial distribution and relative amplitude of flow and pressure fields induced by a sphere vibrating in bulk water flow. (a,b) The relative vibration signatures (displacement ± 50 µm) in velocity (a) and pressure (b) referenced to bulk water flow (10 cm s−1) are shown as polar plots. Colour scheme and angles refer to figure 6a. Note that scaling between (a) and (b) differs by 50 dB. (c,d) Relative vibration signatures in velocity (c) and pressure (d) induced by sphere displacements of ±2 µm, ±10 µm, ±50 µm and ±150 µm. Plots show the median (solid line), 1st/3rd quartile (dashed lines) and minimum/maximum (dotted lines) values obtained from measuring points depicted in figure 6a.
Figure 8.
Figure 8.
Simulation of the pressure induced by a vibrating sphere and bulk water flow (10 cm s−1) on head and canal pores of Leuciscus idus. (a) Left lateral view of the laser scanning-based model featuring vertices, cephalic lateral line canals and manually placed measuring points (numbered black dots). (b) Exemplary pressure field on the surface of the fish's head induced by a sphere vibrating parallel to the fish with an amplitude of ±150 µm in bulk water flow. (c,d) Relative flow velocity close to the fish's surface near the canal pore (c) and relative pressure gradients along canal segments (d). The location of the measuring points is provided in (a). Lines denote displacement amplitudes of ±150 µm (black), ±50 µm (dark grey), ±10 µm (grey) and ±2 µm (light grey). IO, infraorbital canal; MA, mandibular canal; OT, otic canal; PO, postotic canal; POP, preopercular canal; SO, supraorbital canal; ST, supratemporal commissure; T, temporal canal.
Figure 9.
Figure 9.
Simulation of fluid flow inside the right supraorbital canal (SO) of Leuciscus idus. (a) Pressure on the canal walls and fluid flow velocity induced by pressures acting on the canal pores caused by bulk flow and a vibrating sphere. Numbers below the cross sections provide the area of the respective cross section as well as the phase of the sine wave. (b) Average flow velocity of canal fluid measured along the cross sections shown in (a) for DC (dashed line) and sphere displacements of ±150 µm (black), ±50 µm (dark grey), ±10 µm (grey) and ±2 µm (light grey). (c) Relative amplitudes of sphere signal for displacements of ±150 µm (black), ±50 µm (dark grey), ±10 µm (grey) and ±2 µm (light grey) referred to DC flow velocity induced by bulk water flow. C1–C12, canal segment 1–12; P1–P13, canal pore 1–13.
Figure 10.
Figure 10.
Influence of epidermal pits on surface hydrodynamics of Leuciscus idus. (a) Exemplary flow field induced by a DC flow of 10 cm s−1 and a pit depth of 150 µm (velocity magnitude colour-coded, arrows pointing in the direction of flow, arrow lengths scaled logarithmically). (b) Horizontal flow velocity magnitude at 50 µm above the bottom of the pit for various pit depths and bulk flow velocities. (c) Horizontal flow velocity magnitude above the pit bottom for various bulk flow velocities used for stimulation. The two images show exemplary velocity profiles at 0–150 µm distance from the pit bottom for pit depths of 10 µm (left) and 150 µm (right). (d) Absolute flow velocity (logarithmic scaling) at a distance of 50 µm from the bottom of the pit for bulk water flow (DC, 10 mm s−1, dashed black line), sinusoidal velocity amplitudes of 0.01 mm s−1, and frequencies of 25 Hz (black line), 50 Hz (dark grey line), 100 Hz (grey line) and 200 Hz (light grey line). (e) Relative velocity amplitude of altering velocity signals of 25 Hz (black line), 50 Hz (dark grey line), 100 Hz (grey line) and 200 Hz (light grey line) as referred to the DC signal (dashed line shown in (d)).

Similar articles

Cited by

References

    1. Dijkgraaf S. 1933. Untersuchungen über die Funktion der Seitenorgane an Fischen. Z. Physiol. 20, 162–214. (10.1007/bf00340757) - DOI
    1. Dijkgraaf S. 1962. The functioning and significance of the lateral-line organs. Biol. Rev. 38, 51–105. (10.1111/j.1469-185X.1963.tb00654.x) - DOI - PubMed
    1. Bleckmann H. 2008. Peripheral and central processing of lateral line information. J. Comp. Physiol. A 194, 145–158. (10.1007/s00359-007-0282-2) - DOI - PubMed
    1. Schmitz A, Bleckmann H, Mogdans J. 2008. Organization of the superficial neuromast system in goldfish, Carassius auratus. J. Morphol. 269, 751–761. (10.1002/jmor.10621) - DOI - PubMed
    1. Beckmann M, Erös T, Schmitz A, Bleckmann H. 2010. Number and distribution of superficial neuromasts in twelve common European cypriniform fishes and their relationship to habitat occurrence. Int. Rev. Hydrobiol. 95, 273–284. (10.1002/iroh.200911185) - DOI

Publication types

LinkOut - more resources