

A genome editing approach to study cancer stem cells in human tumors
- PMID: 28468934
- PMCID: PMC5494503
- DOI: 10.15252/emmm.201707550
A genome editing approach to study cancer stem cells in human tumors
Abstract
The analysis of stem cell hierarchies in human cancers has been hampered by the impossibility of identifying or tracking tumor cell populations in an intact environment. To overcome this limitation, we devised a strategy based on editing the genomes of patient-derived tumor organoids using CRISPR/Cas9 technology to integrate reporter cassettes at desired marker genes. As proof of concept, we engineered human colorectal cancer (CRC) organoids that carry EGFP and lineage-tracing cassettes knocked in the LGR5 locus. Analysis of LGR5-EGFP+ cells isolated from organoid-derived xenografts demonstrated that these cells express a gene program similar to that of normal intestinal stem cells and that they propagate the disease to recipient mice very efficiently. Lineage-tracing experiments showed that LGR5+ CRC cells self-renew and generate progeny over long time periods that undergo differentiation toward mucosecreting- and absorptive-like phenotypes. These genetic experiments confirm that human CRCs adopt a hierarchical organization reminiscent of that of the normal colonic epithelium. The strategy described herein may have broad applications to study cell heterogeneity in human tumors.
Keywords: CRISPR/Cas9; LGR5; cancer stem cells; colorectal cancer.
© 2017 The Authors. Published under the terms of the CC BY 4.0 license.
Figures
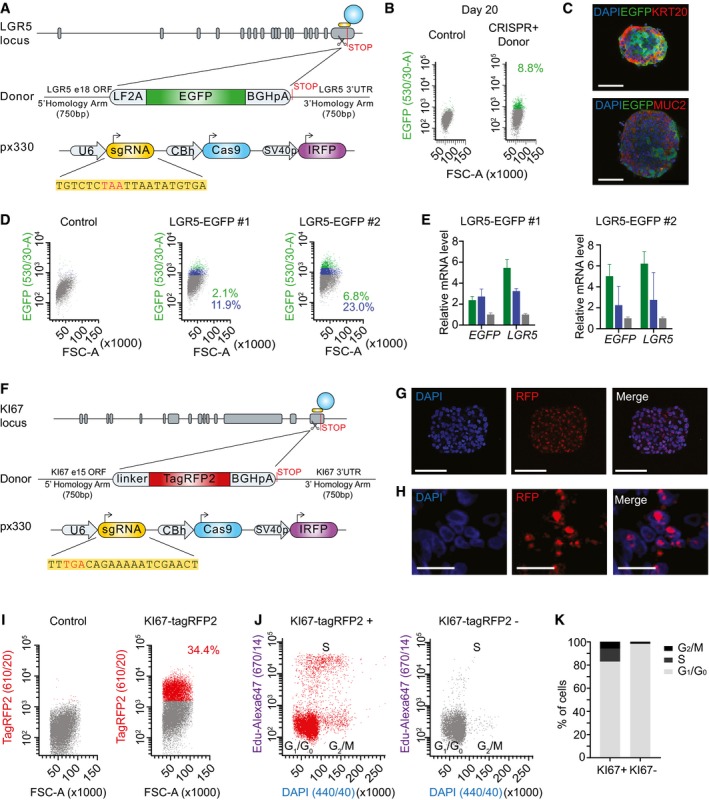
Design of LGR5‐EGFP donor and CRISPR/Cas9 sgRNA vectors. Blue circle represents the CRISPR/Cas9 protein complex and the yellow box underneath the guide RNA.
Flow cytometry profiles at day 20 post‐nucleofection.
Immunofluorescence for DAPI, EGFP, and KRT20 or MUC2 in in vitro cultured PDO#7‐LGR5‐EGFP#1. Scale bars indicate 100 μm.
FACS profiles showing EGFP‐high (green), ‐low (blue), and ‐negative (gray) cells in PDO#7‐LGR5‐EGFP#1 and #2 organoids.
Relative mRNA expression level by real‐time qPCR in cells expressing distinct levels of EGFP isolated from PDO#7‐LGR5‐EGFP#1 and #2 knock‐in organoids. Values show mean ± s.d. of three measurements.
Design of KI67‐TagRFP2 donor and CRISPR/Cas9 sgRNA vectors. Blue circle represents the CRISPR/Cas9 protein complex and the yellow box underneath the guide RNA.
Images of PDO#7‐KI67‐TagRFP2#1 organoids. Scale bars indicate 100 μm.
PDO#7‐KI67‐TagRFP2#1 xenograft. TagRFP2 co‐localizes with DAPI nuclear staining. Scale bars indicate 25 μm.
Flow cytometry analysis of EPCAM+/DAPI− cell population of PDO#7‐LGR5‐EGFP/KI67‐TagRFP2#1 from disaggregated xenografts.
Cell cycle analysis of KI67‐TagRFP2‐positive and KI67‐TagRFP2‐negative cells from PDO#7‐LGR5‐EGFP/KI67‐TagRFP2#1 disaggregated xenografts. X‐axis shows DNA content and y‐axis EdU incorporation.
Quantification of the frequencies of KI67+ versus KI67− cells found in each cell cycle phase.
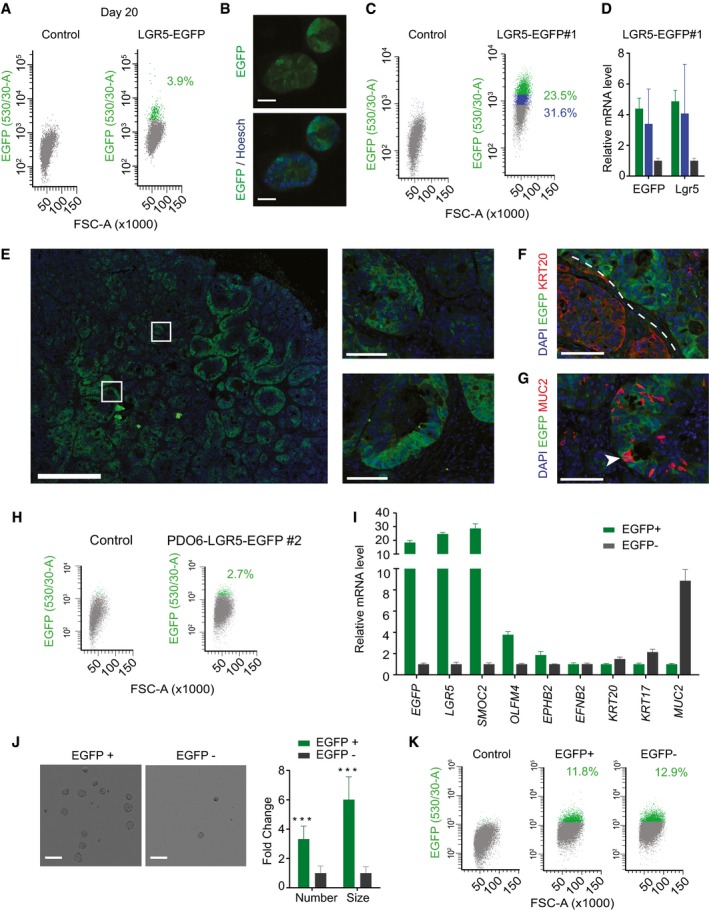
Flow cytometry profiles at day 20 post‐nucleofection.
Live imaging of PDO#6 LGR5‐EGFP#1 knock‐ins. Scale bars indicate 50 μm.
FACS profiles showing EGFP‐high (green), EGFP‐low (blue) and EGFP‐negative (gray) cells from dissociated PDO#6‐LGR5‐EGFP#1 organoids.
Relative mRNA expression (RT–qPCR) of key marker genes of the cell fractions mentioned in (C). Values show mean ± standard deviation (s.d.) of three measurements.
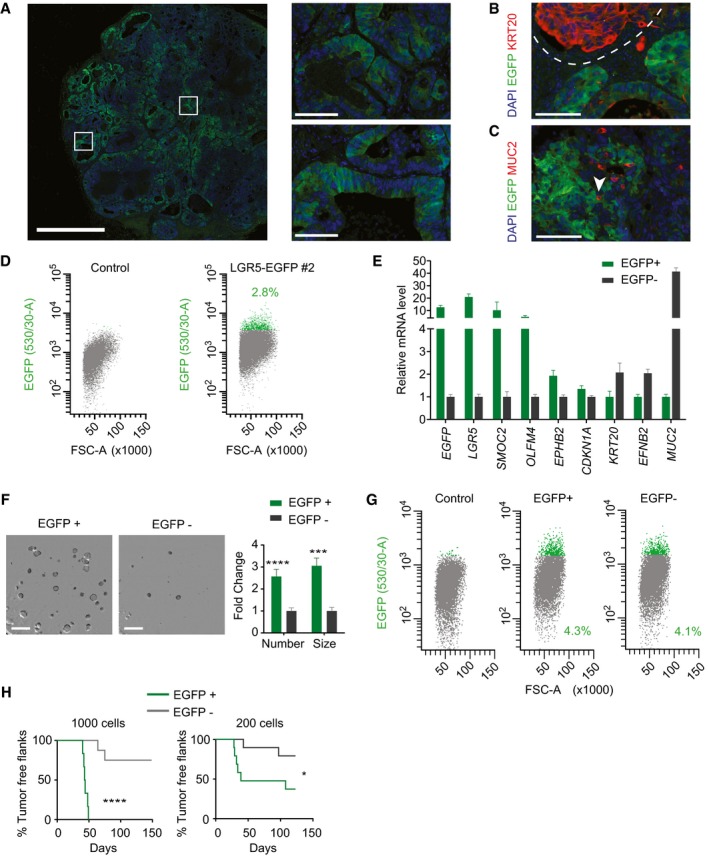
Representative images of EGFP patterns analyzed by immunofluorescence on a section of PDO#6‐LGR5‐EGFP#1‐derived subcutaneous xenograft. White squares indicate position of the insets in the xenograft. Scale bars indicate 1 mm for low magnification picture and 100 μm for insets.
Dual immunofluorescence for KRT20 and LGR5 demonstrating complementary expression domains of the two marker genes. Dashed line marks expression domains of adjacent glands. Scale bar indicates 100 μm.
Dual immunofluorescence on paraffin sections of clone #1. White arrows point to LGR5−/MUC2+ cells. Scale bar indicates 100 μm.
Flow cytometry analysis of disaggregated xenografts generated by PDO#6‐LGR5‐EGFP#2.
Relative expression level by RT–qPCR of intestinal stem and differentiation genes in EGFP+ versus EGFP− (EPCAM+) cells isolated from disaggregated xenografts. Values show mean ± s.d. of three measurements.
Representative pictures and quantifications of organoid formation generated by EGFP+ and EGFP− cells isolated from xenografts. Scale bars indicate 1 mm. (n = 4 wells per condition). Data is represented as mean ± s.d. Differences were assessed with Student's t‐test: ***P‐value < 0.005. The exact P‐values are specified in Appendix Table S5.
Representative flow cytometry analysis of 15 days grown organoids from the EGFP+ and EGFP− sorted populations.
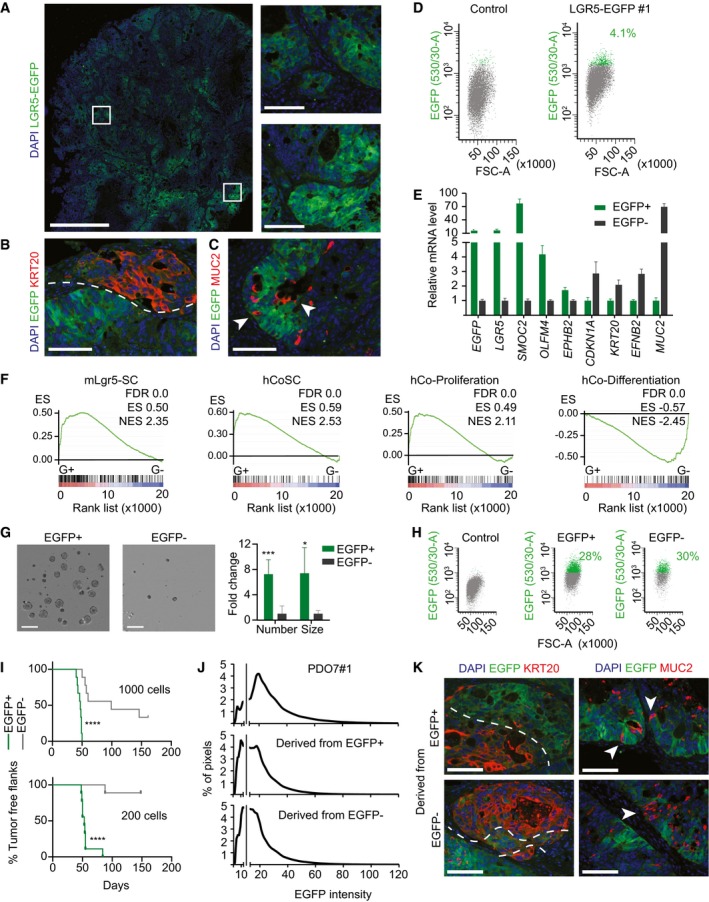
Representative images of EGFP by immunofluorescence on a section of PDO#7‐LGR5‐EGFP#1‐derived subcutaneous xenograft. White squares indicate the position of the insets. Scale bars indicate 1 mm for the whole xenograft and 100 μm for the insets.
Dual immunofluorescence on paraffin sections for KRT20 and LGR5‐EGFP showing complementary expression domains. Dashed line delimits expression domain in adjacent glands. Scale bar indicates 100 μm.
Dual immunofluorescence on paraffin sections of clone #1 for MUC2 and LGR5‐EGFP. White arrows point to LGR5‐EGFP−/MUC2+ cells. Scale bar indicates 100 μm.
Representative FACS profiles of EGFP+ and EGFP− in EPCAM+/DAPI− subpopulation from disaggregated xenografts.
Relative mRNA expression level of intestinal stem and differentiation genes for the sorted EGFP+ and EGFP− populations. Values show mean ± standard deviation (s.d.) of three measurements.
GSEA comparing the expression of signatures of mouse LGR5+ cells (MmLgr5‐SC), human colon stem cells (hCoSCs), differentiated cells (hCo differentiation), or proliferative crypt cells (Jung et al, 2011) in profiled LGR5‐EGFP+ versus LGR5‐EGFP− cells.
Representative images and quantification of organoid formation assays from cells purified from PDO#7‐LGR5‐EGFP#1‐derived subcutaneous xenograft (n = 4 wells per condition). Data is represented as mean ± s.d. Scale bars indicate 1 mm.
Representative flow cytometry analysis of 15‐day grown organoids from the EGFP+ and EGFP− sorted populations.
In vivo tumor initiation capacity of 1,000 and 200 sorted cells from PDO#7‐LGR5‐EGFP#1‐derived subcutaneous xenografts. Graphs show Kaplan–Meier plots (n = 9 xenografts).
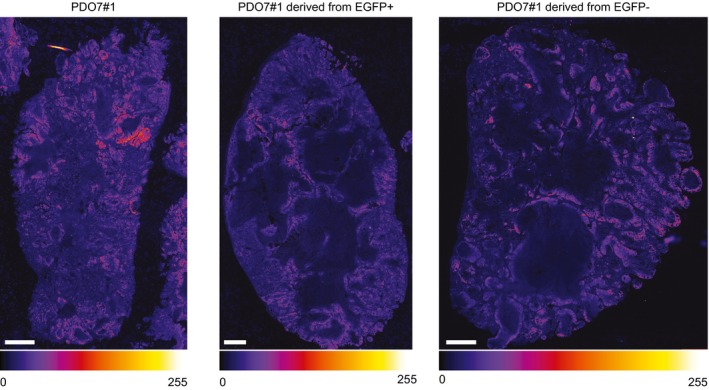
Distribution of the EGFP staining intensity in PDO7#1 and in xenografts derived from EGFP+ and EGFP− cells. Gray line indicates background fluorescence levels.
Dual immunofluorescence for KRT20/EGFP and MUC2/EGFP on paraffin sections of xenografts generated by EGFP+ and EGFP− sorted populations respectively. Dashed lines mark stem‐like and differentiated‐like compartments. White arrows point to secretory cells intermingled in the LGR5− compartment. Scale bars indicate 100 μm.
Representative images of EGFP patterns analyzed by immunofluorescence on a section of PDO#7‐LGR5‐EGFP#2‐derived subcutaneous xenograft. White squares are magnified in insets. Scale bars indicate 1 mm for the whole xenograft, 100 μm for the magnified insets.
Dual immunofluorescence of clone #2 for KRT20 and LGR5‐EGFP that illustrates complementary expression domains of the marker genes. Dashed line delimits expression domains in adjacent glands. Scale bar indicates 100 μm.
Dual immunofluorescence of clone #2 for MUC2 and LGR5‐EGFP. White arrows point to LGR5−/MUC2+ tumor cells. Scale bar indicates 100 μm.
Flow cytometry profiles of EGFP+ and EGFP− disaggregated xenografts. Only EPCAM+ cells are shown.
Relative expression levels assessed by RT–qPCR of ISC and differentiation genes in EGFP+ and EGFP− cells isolated from disaggregated xenografts. Values show mean ± standard deviation (s.d.) of three measurements.
Representative images and quantifications of organoid formation by EGFP+ versus EGFP− cells isolated from xenografts (n = 4 wells per condition). Data is represented as mean ± s.d. Scale bars indicate 1 mm.
Representative flow cytometry analysis of 15‐day grown organoids formed by EGFP+ and EGFP− sorted populations.
Tumor initiation capacity of 1,000 and 200 sorted epithelial cells from xenografts that were re‐inoculated into recipient mice. Graphs show Kaplan–Meier plots (n = 9 xenografts for condition. In EGFP+ 1,000 cells n = 6).
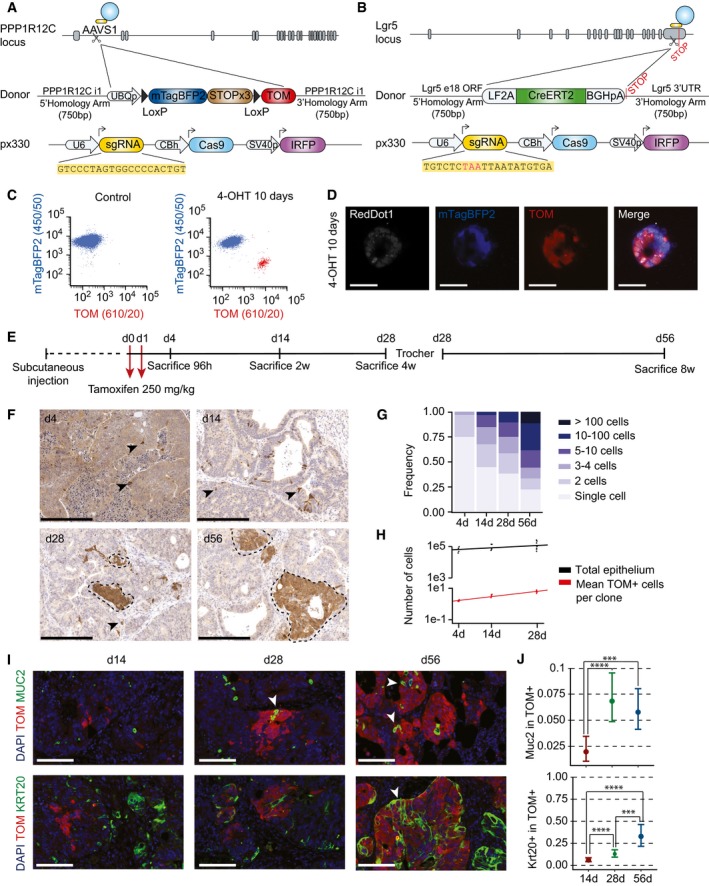
Design of the donor vector containing lineage‐tracing cassette and AAVS1 homology arms.
Design of LGR5‐CreERT2 donor and CRISPR/Cas9 sgRNA vectors.
Flow cytometry analysis of double knock‐in PDO#7 carrying AAVS1‐LSL‐TOM and LGR5‐CreERT2 cassettes. Organoids were treated in vitro with 1 μM 4‐hydroxytamoxifen (4‐OHT). About 3.6% of the cells recombined the stop cassette (i.e., expressed low levels of mTagBFP2) and gained expression of TOM.
Confocal imaging of double knock‐in organoids 10 days after in vitro 1 μM 4‐OHT addition. Scale bars indicate 50 μm. Note that recombined organoids switch mTagBFP2 to TOM expression.
Experimental setup used for lineage‐tracing experiments.
Representative immunohistochemistry using anti‐Tomato antibodies on paraffin sections of the four time points after tamoxifen treatment. Arrowheads point to single and two cell clones. Dashed lines delimit large clones. Scale bars indicate 250 μm.
Clone size frequency per time point according to number of cells. Number of clones quantified was 878 for day 4, 2,424 for day 14, 6,940 for day 28, and 6,940 for day 56.
Correlation of number of epithelial cells per xenograft and number of cells per clone over time (n = 4 xenografts for 4 days time point, n = 5 xenografts for 14 days time point, n = 8 xenografts for 28 days time point, n = 8 xenografts for 56 days time point).
Expression domains of TOM and differentiation markers MUC2 and KRT20. White arrowheads indicate double‐positive cells. Scale bars indicate 100 μm.
Quantification of the number of MUC2+ and KRT20+ cells within TOM+ clones at each time point. Data is represented as the 95% confidence intervals of the measurements. Number of clones assessed was 872 (4 days), 372 (day 14), and 69 (day 28) for KRT20 and 387 (day 4), 611 (day 14), and 130 (day 28) for MUC2. The P‐value was calculated using a generalized linear model with binomial response. ***P‐value < 0.005, ****P‐value < 0.0001. The exact P‐values are specified in Appendix Table S5.
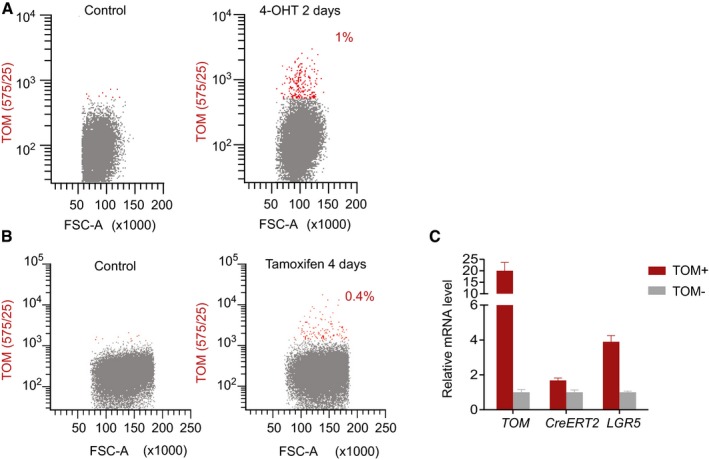
Flow cytometry analysis of PDO#7 AAVS1‐LSL‐TOM LGR5‐CreERT2#1 treated for 2 days with 1 μM 4‐hydroxytamoxifen (4‐OHT).
Flow cytometry profiles of PDO#7 AAVS1‐LSL‐TOM LGR5‐CreERT2#1‐derived xenograft 4 days after injection of tamoxifen.
Relative mRNA expression levels of LGR5 in TOM+ versus TOM− populations by RT‐qPCR. Values show mean ± standard deviation of three measurements.
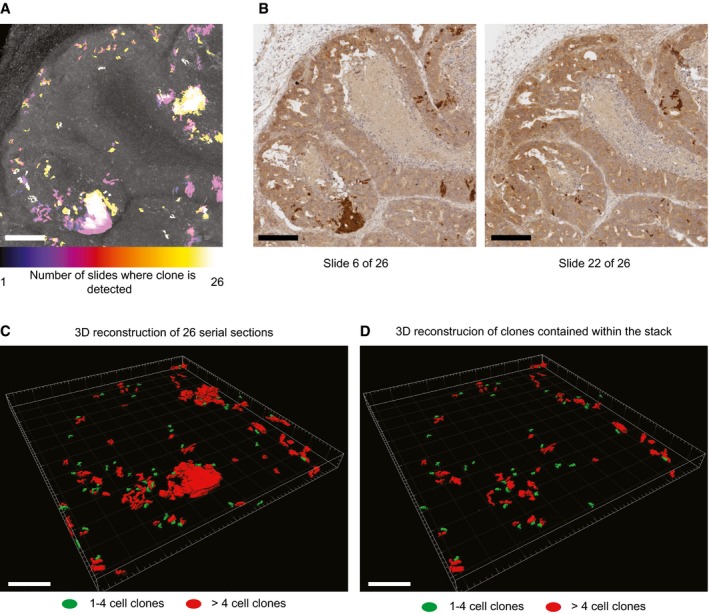
Z‐projection of clones in 26 serial sections of subcutaneous PDO#7 LGR5‐CreERT2#1 xenografts 1 month after tamoxifen injection. Color scale denotes the number of sections occupied by a given clone. Scale bar is 200 μm.
Example of two slides stained for Tomato used for 3D reconstruction. Scale bars are 200 μm.
Projection of the 3D reconstructed clones. Scale bar indicates 200 μm.
Projection of the 3D reconstructed clones that do not contact borders and therefore are fully embedded within the Z plan analyzed. Scale bar indicates 200 μm.
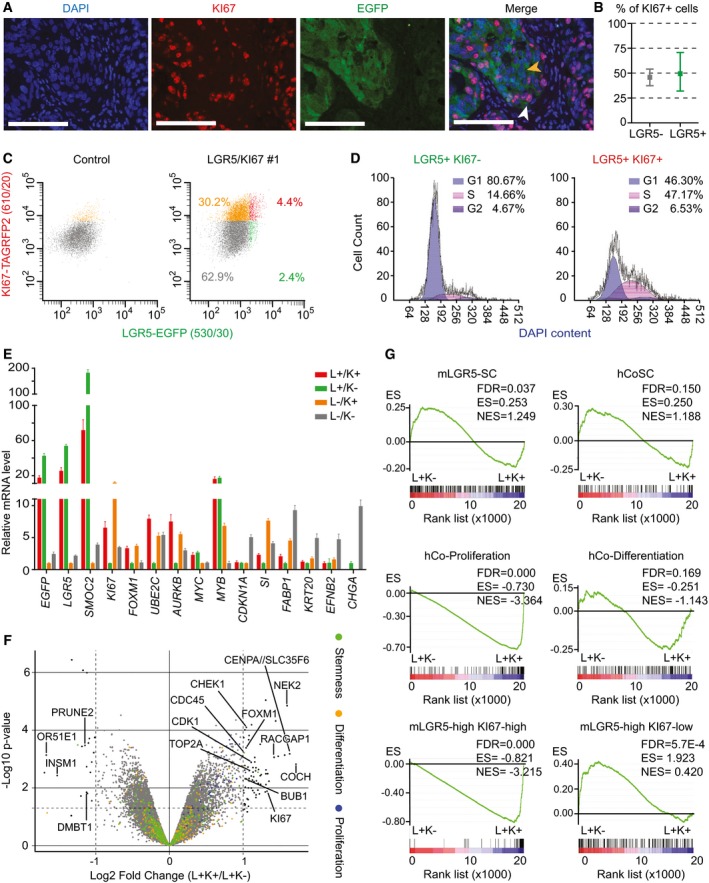
Representative immunofluorescence image of PDO#7‐LGR5‐EGFP#1 stained with KI67 antibody. White arrowheads point to double‐positive cells; yellow arrowheads point to LGR5+/KI67− cells. Scale bars indicate 100 μm.
Quantification of KI67+ cells within the LGR5+ and LGR5− compartments (n = 2,749 LGR5+ cells, 1,798 LGR5− cells assessed). Data is represented as the 95% confidence intervals of the measurements.
Representative FACS profiles from PDO#7‐LGR5‐EGFP/KI67‐TagRFP2 disaggregated xenografts. Only EPCAM+/DAPI− cells are shown. The four represented populations are: LGR5‐EGFP−, KI67‐RFP− (gray), LGR5‐EGFP−, KI67‐RFP+ (orange), LGR5‐EGFP+, KI67‐RFP+ (red) and LGR5‐EGFP+, KI67‐RFP− (green).
Cell cycle analysis LGR5‐EGFP+ and KI67‐RFP‐positive or KI67‐RFP‐negative sorted populations. 5,363 and 5,398 cells were analyzed in each case.
RT–qPCR analysis of proliferation, stem, and differentiation marker genes in the cell populations defined by EGFP/TagRFP levels. K indicates KI67, and L indicates LGR5. Values show mean ± standard deviation (s.d.) of three measurements.
Volcano plot representing gene expression profile of L+K+ versus L+K− purified populations from LGR5‐EGFP/KI67‐TagRFP2 PDO#7 clone #1. Green dots indicate genes belonging to the human colon stem cell signature, orange dots represent genes belonging to the differentiated cell signature, and blue dots depict genes of the crypt proliferative progenitor signature. Well described genes involved in proliferation are indicated. P‐values and fold changes computed by fitting a linear model with the R package limma.
GSEA comparing LGR5‐EGFP+ cells positive or negative for KI67‐RFP for the signatures used in Fig 2 as well as for signatures derived from mouse crypt LGR5‐high/KI67‐high or LGR5‐high/KI67‐low (Basak et al, 2014). Note that the only signatures that are differentially expressed between the two populations correspond to proliferative cells derived from either human crypts of from KI67‐RFP mice. In contrast, the signature of mouse LGR5‐EGFP+/KI67‐RFP− is significantly enriched in LGR5‐EGFP+/KI67‐RFP− tumor cells.
Comment in
-
Colorectal cancer-initiating cells caught in the act.EMBO Mol Med. 2017 Jul;9(7):856-858. doi: 10.15252/emmm.201707858. EMBO Mol Med. 2017. PMID: 28559443 Free PMC article.
References
-
- Barker N, Ridgway RA, van Es JH, van de Wetering M, Begthel H, van den Born M, Danenberg E, Clarke AR, Sansom OJ, Clevers H (2009) Crypt stem cells as the cells‐of‐origin of intestinal cancer. Nature 457: 608–611 - PubMed
-
- Barker N, van Es JH, Kuipers J, Kujala P, van den Born M, Cozijnsen M, Haegebarth A, Korving J, Begthel H, Peters PJ et al (2007) Identification of stem cells in small intestine and colon by marker gene Lgr5. Nature 449: 1003–1007 - PubMed
-
- Calon A, Lonardo E, Berenguer‐Llergo A, Espinet E, Hernando‐Momblona X, Iglesias M, Sevillano M, Palomo‐Ponce S, Tauriello DV, Byrom D et al (2015) Stromal gene expression defines poor‐prognosis subtypes in colorectal cancer. Nat Genet 47: 320–329 - PubMed
-
- Clevers H (2011) The cancer stem cell: premises, promises and challenges. Nat Med 17: 313–319 - PubMed
Publication types
MeSH terms
Substances
LinkOut - more resources
Full Text Sources
Other Literature Sources
Medical
Molecular Biology Databases
Research Materials
