Genetic Disruption of Adenosine Kinase in Mouse Pancreatic β-Cells Protects Against High-Fat Diet-Induced Glucose Intolerance
- PMID: 28468960
- PMCID: PMC5482077
- DOI: 10.2337/db16-0816
Genetic Disruption of Adenosine Kinase in Mouse Pancreatic β-Cells Protects Against High-Fat Diet-Induced Glucose Intolerance
Erratum in
-
Erratum. Genetic Disruption of Adenosine Kinase in Mouse Pancreatic β-Cells Protects Against High-Fat Diet-Induced Glucose Intolerance. Diabetes 2017;66:1928-1938.Diabetes. 2017 Dec;66(12):3145. doi: 10.2337/db17-er12f. Epub 2017 Oct 10. Diabetes. 2017. PMID: 29017999 Free PMC article. No abstract available.
Abstract
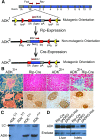
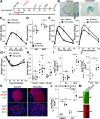
Islet β-cells adapt to insulin resistance through increased insulin secretion and expansion. Type 2 diabetes typically occurs when prolonged insulin resistance exceeds the adaptive capacity of β-cells. Our prior screening efforts led to the discovery that adenosine kinase (ADK) inhibitors stimulate β-cell replication. Here, we evaluated whether ADK disruption in mouse β-cells affects β-cell mass and/or protects against high-fat diet (HFD)-induced glucose dysregulation. Mice targeted at the Adk locus were bred to Rip-Cre and Ins1-Cre/ERT1Lphi mice to enable constitutive (βADKO) and conditional (iβADKO) disruption of ADK expression in β-cells, respectively. Weight gain, glucose tolerance, insulin sensitivity, and glucose-stimulated insulin secretion (GSIS) were longitudinally monitored in normal chow (NC)-fed and HFD-fed mice. In addition, β-cell mass and replication were measured by immunofluorescence-based islet morphometry. NC-fed adult βADKO and iβADKO mice displayed glucose tolerance, insulin tolerance and β-cell mass comparable to control animals. By contrast, HFD-fed βADKO and iβADKO animals had improved glucose tolerance and increased in vivo GSIS. Improved glucose handling was associated with increased β-cell replication and mass. We conclude that ADK expression negatively regulates the adaptive β-cell response to HFD challenge. Therefore, modulation of ADK activity is a potential strategy for enhancing the adaptive β-cell response.
© 2017 by the American Diabetes Association.
Figures


Similar articles
-
Amelioration of high fat diet-induced glucose intolerance by blockade of Smad4 in pancreatic beta-cells.Exp Clin Endocrinol Diabetes. 2015 Apr;123(4):221-6. doi: 10.1055/s-0034-1395583. Epub 2014 Dec 11. Exp Clin Endocrinol Diabetes. 2015. PMID: 25502579
-
Deletion of ABCB10 in beta-cells protects from high-fat diet induced insulin resistance.Mol Metab. 2022 Jan;55:101403. doi: 10.1016/j.molmet.2021.101403. Epub 2021 Nov 23. Mol Metab. 2022. PMID: 34823065 Free PMC article.
-
Metabolic Effects of Selective Deletion of Group VIA Phospholipase A2 from Macrophages or Pancreatic Islet Beta-Cells.Biomolecules. 2020 Oct 17;10(10):1455. doi: 10.3390/biom10101455. Biomolecules. 2020. PMID: 33080873 Free PMC article.
-
β Cell-specific deletion of guanylyl cyclase A, the receptor for atrial natriuretic peptide, accelerates obesity-induced glucose intolerance in mice.Cardiovasc Diabetol. 2018 Jul 17;17(1):103. doi: 10.1186/s12933-018-0747-3. Cardiovasc Diabetol. 2018. PMID: 30016962 Free PMC article.
-
Taurine supplementation prevents morpho-physiological alterations in high-fat diet mice pancreatic β-cells.Amino Acids. 2012 Oct;43(4):1791-801. doi: 10.1007/s00726-012-1263-5. Epub 2012 Mar 15. Amino Acids. 2012. PMID: 22418865
Cited by
-
Endothelial adenosine kinase deficiency ameliorates diet-induced insulin resistance.J Endocrinol. 2019 Aug;242(2):159-172. doi: 10.1530/JOE-19-0126. J Endocrinol. 2019. PMID: 31189131 Free PMC article.
-
Generation of highly potent DYRK1A-dependent inducers of human β-Cell replication via Multi-Dimensional compound optimization.Bioorg Med Chem. 2020 Jan 1;28(1):115193. doi: 10.1016/j.bmc.2019.115193. Epub 2019 Nov 11. Bioorg Med Chem. 2020. PMID: 31757680 Free PMC article.
-
Deletion of pancreatic β-cell adenosine kinase improves glucose homeostasis in young mice and ameliorates streptozotocin-induced hyperglycaemia.J Cell Mol Med. 2019 Jul;23(7):4653-4665. doi: 10.1111/jcmm.14216. Epub 2019 May 1. J Cell Mol Med. 2019. PMID: 31044530 Free PMC article.
-
Adenosine kinase: An epigenetic modulator in development and disease.Neurochem Int. 2021 Jul;147:105054. doi: 10.1016/j.neuint.2021.105054. Epub 2021 May 5. Neurochem Int. 2021. PMID: 33961946 Free PMC article. Review.
-
VMAT2 Safeguards β-Cells Against Dopamine Cytotoxicity Under High-Fat Diet-Induced Stress.Diabetes. 2020 Nov;69(11):2377-2391. doi: 10.2337/db20-0207. Epub 2020 Aug 21. Diabetes. 2020. PMID: 32826296 Free PMC article.
References
-
- Weir GC, Bonner-Weir S. Five stages of evolving beta-cell dysfunction during progression to diabetes. Diabetes 2004;53(Suppl. 3):S16–S21 - PubMed
-
- Butler AE, Janson J, Bonner-Weir S, Ritzel R, Rizza RA, Butler PC. Beta-cell deficit and increased beta-cell apoptosis in humans with type 2 diabetes. Diabetes 2003;52:102–110 - PubMed
-
- Jonas JC, Sharma A, Hasenkamp W, et al. . Chronic hyperglycemia triggers loss of pancreatic beta cell differentiation in an animal model of diabetes. J Biol Chem 1999;274:14112–14121 - PubMed
Publication types
MeSH terms
Substances
Grants and funding
LinkOut - more resources
Full Text Sources
Other Literature Sources
Medical
Molecular Biology Databases
Miscellaneous

