. 2017 Jul 1;28(13):1768-1781.
doi: 10.1091/mbc.E16-06-0412. Epub 2017 May 3.

Regulation of circular dorsal ruffles, macropinocytosis, and cell migration by RhoG and its exchange factor, Trio

Affiliations

Regulation of circular dorsal ruffles, macropinocytosis, and cell migration by RhoG and its exchange factor, Trio

Alejandra Valdivia et al. Mol Biol Cell. .

Abstract

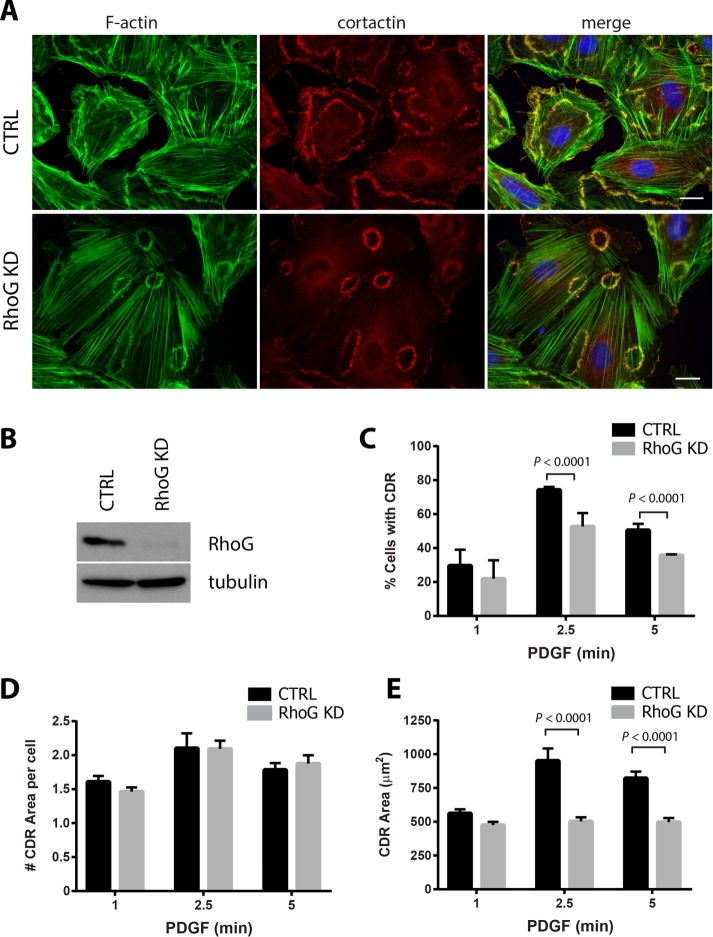
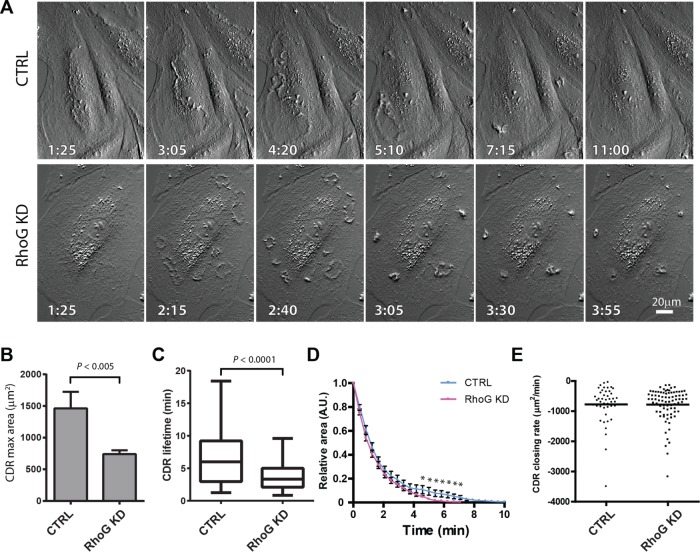
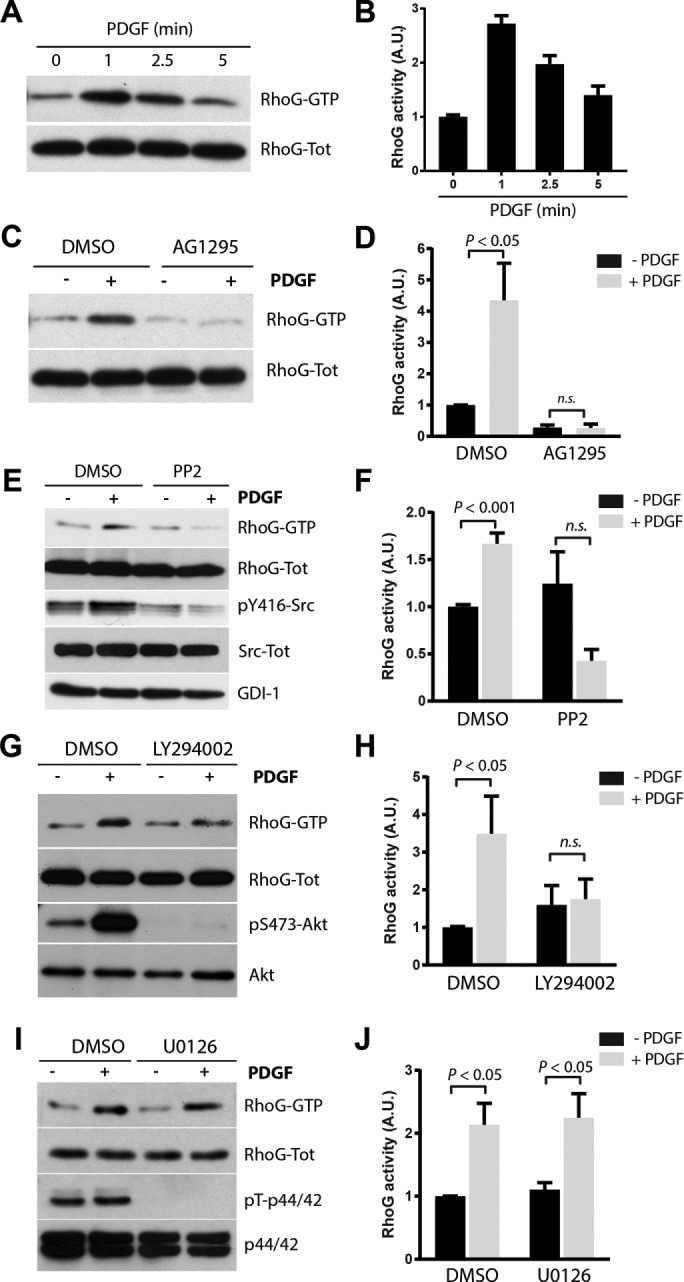
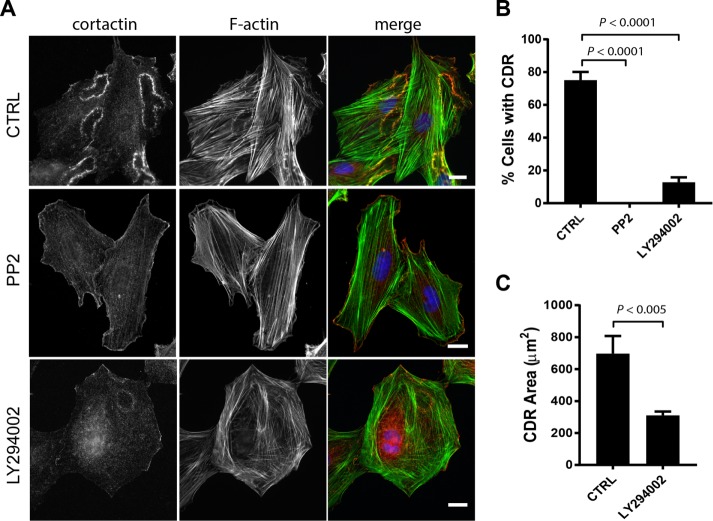
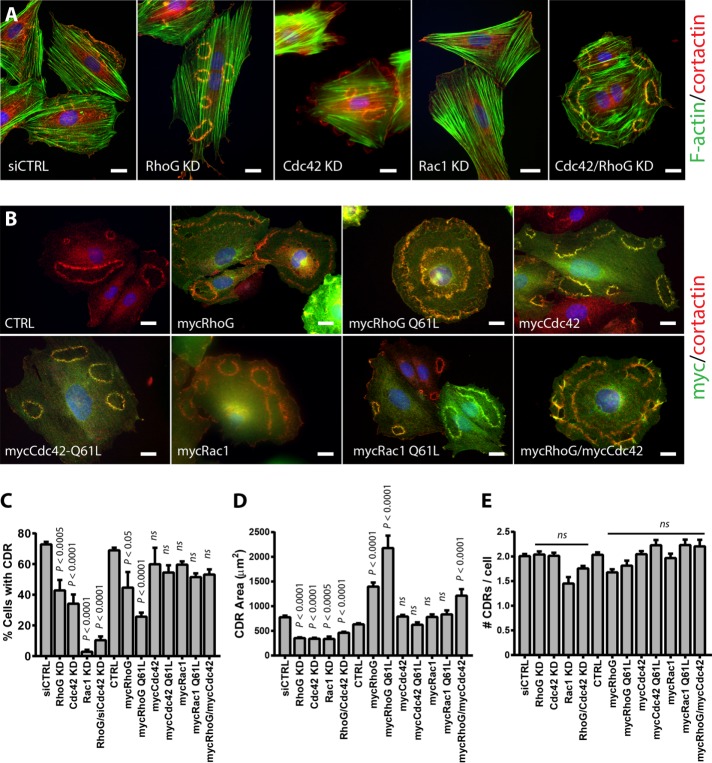
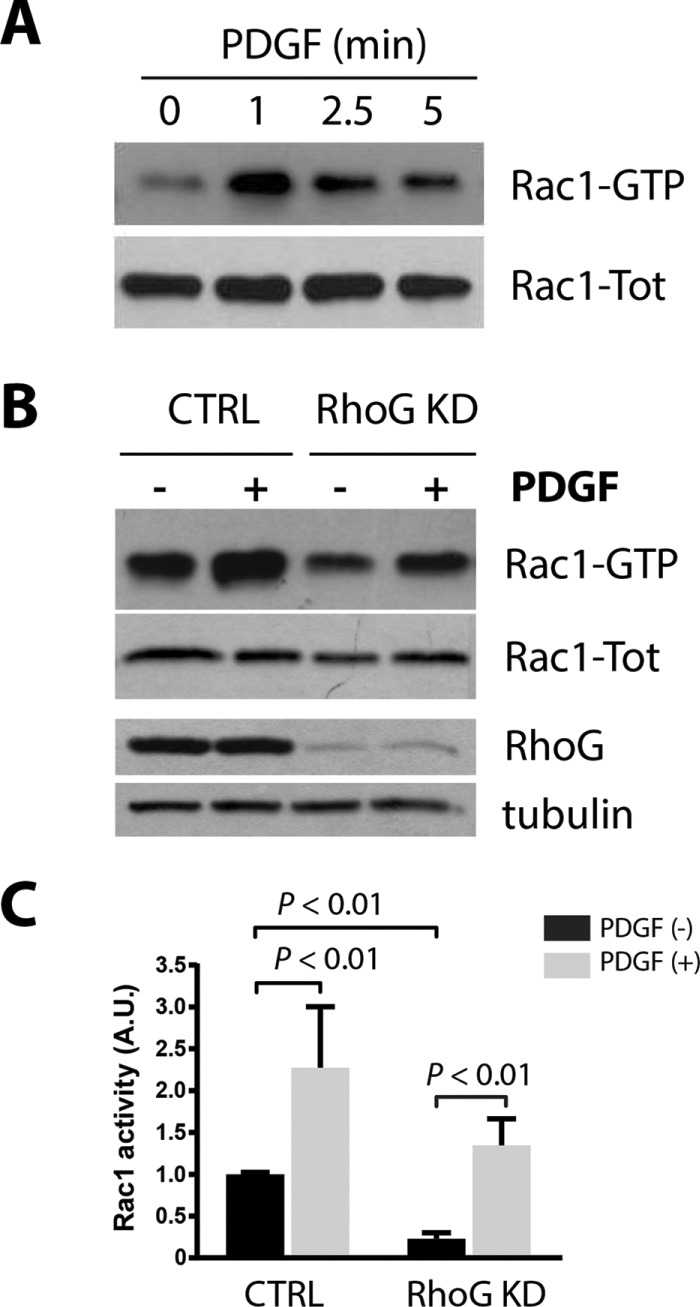
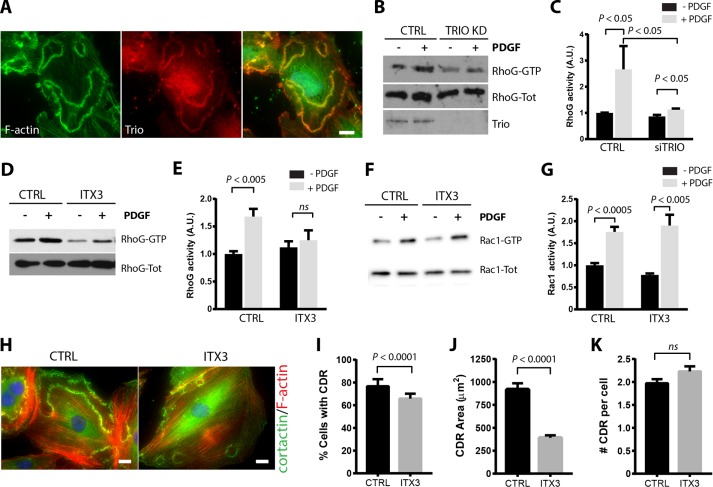
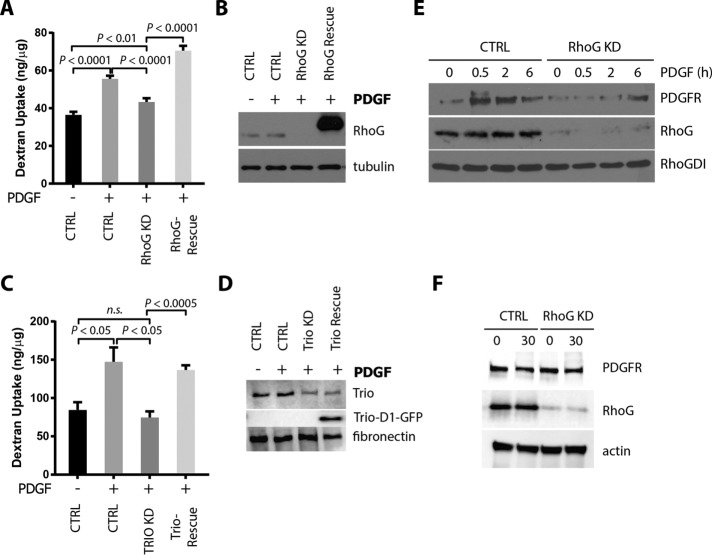
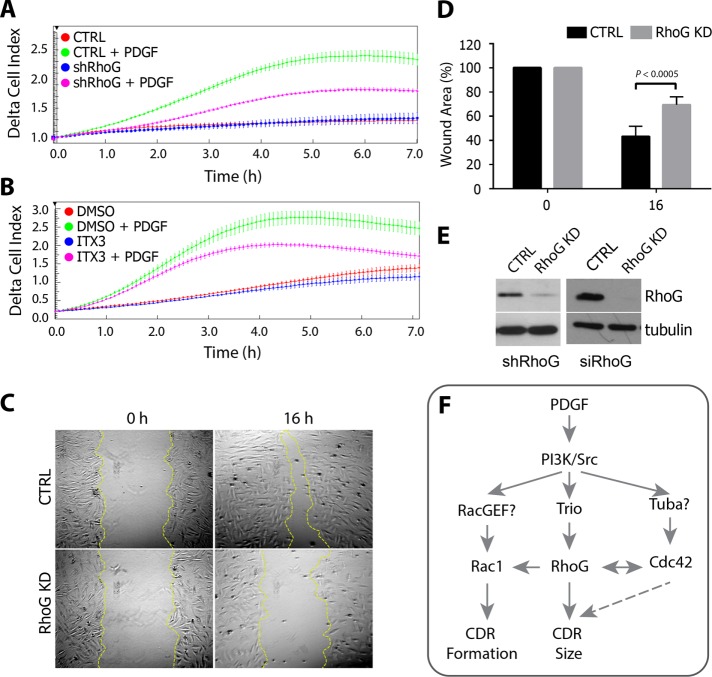
Circular dorsal ruffles (CDRs) are actin-rich structures that form on the dorsal surface of many mammalian cells in response to growth factor stimulation. CDRs represent a unique type of structure that forms transiently and only once upon stimulation. The formation of CDRs involves a drastic rearrangement of the cytoskeleton, which is regulated by the Rho family of GTPases. So far, only Rac1 has been consistently associated with CDR formation, whereas the role of other GTPases in this process is either lacking or inconclusive. Here we show that RhoG and its exchange factor, Trio, play a role in the regulation of CDR dynamics, particularly by modulating their size. RhoG is activated by Trio downstream of PDGF in a PI3K- and Src-dependent manner. Silencing RhoG expression decreases the number of cells that form CDRs, as well as the area of the CDRs. The regulation of CDR area by RhoG is independent of Rac1 function. In addition, our results show the RhoG plays a role in the cellular functions associated with CDR formation, including macropinocytosis, receptor internalization, and cell migration. Taken together, our results reveal a novel role for RhoG in the regulation of CDRs and the cellular processes associated with their formation.


Figures

FIGURE 1:
FIGURE 1:
PDGF-induced CDR formation is affected by RhoG silencing. (A) A7r5 cells were transfected with siRNA against RhoG (RhoG KD) or with a nontargeting siRNA (CTRL). After 72 h, cells were serum starved for 2 h and stimulated with PDGF-BB (20 ng/ml) for 1, 2.5, and 5 min. Cells were fixed and processed for immunofluorescence using cortactin (red) as marker of dorsal ruffles, Alexa 488–phalloidin (green) to stain F-actin, and Hoechst (blue) to visualize nuclei. Representative images of the 2.5-min time point. Scale bar, 20 μm. (B) KD efficiency was tested for each experiment by immunoblot in cell lysates 72 h after transfection. (C) Number of cells with CDRs expressed as percentage of cells that stained positive for at least one CDR. (D) Average number of CDRs per cell (in cells positive for CDRs). (E) Average CDR area. Black bars, CTRL cells; gray bars, RhoG KD. Results are shown as mean ± SEM from three independent experiments (≥100 cells per condition/experiment).
FIGURE 2:
FIGURE 2:
Dynamics of CDR formation in live cells. A7r5 cells transfected with siRNA targeting RhoG (RhoG KD) or with a nontargeting siRNA (CTRL) were analyzed by time-lapse microscopy immediately after the addition of 20 ng/ml PDFG-BB. Pictures were taken at intervals of 35 s, and CDR properties were evaluated using ImageJ. (A) A representative series for CTRL and RhoG KD after formation and disassembly of CDRs. Scale bar, 20 μm. (B) Average maximal area that each CDR reached during the total time recorded. (C) Average CDR lifetime. (D) Maximum area of each CDR was standardized to 1, and CDR disassembly was then plotted vs. time. Complete disassembly is achieved significantly faster in average CTRL cells than with RhoG KD (*p < 0.0001) but with similar kinetics. Results for A–C are expressed as mean ± SEM from two independent experiments (a combined total of 72 cells were analyzed in CTRL, and 82 cells were analyzed in RhoG KD). (E) For each CDR, the disassembly rate was calculated from the slope of a linear regression calculated for each CDR disassembly event. The difference between these two sets of data is not significant.
FIGURE 3:
FIGURE 3:
PDGF induces RhoG activation. (A) A7r5 cells were serum starved for 2 h and then stimulated with PDGF-BB (20 ng/ml) for 1, 2.5, and 5 min. Active RhoG (RhoG-GTP) was then precipitated from total lysates using GST-ELMO and immunoblotted with RhoG antibodies. (B) Quantification of three independent assays. (C) Cells pretreated with 10 μM AG1295 to inhibit PDGFR before PDGF-BB stimulation. (D) Quantification of three independent assays. Serum-starved cells were pretreated with 10 μM PP2 (E), 25 μM LY294002 (G), or 10 μM U0126 (I) for 30 min and then stimulated with PDGF for 1 min. Active RhoG (RhoG-GTP) was then measured as in A. Phospho–Tyr-416 Src, phospho–Ser-473 Akt, and phospho–Thr-202/Tyr-204 p44/42 antibodies were used as control to determine the efficiency of the inhibitors. Total Src, Akt, p44/42 and RhoGDI were used as loading controls (F, H, and J). Quantification of at least three independent assays for PP2, LY294002, and U0126, respectively. For all experiments, RhoG activity is calculated as the ratio of active (RhoG-GTP)/total RhoG signal (RhoG-Tot) and expressed in arbitrary units (A.U.). All results are shown as mean ± SEM of at least three independent experiments.
FIGURE 4:
FIGURE 4:
Effect of Src and PI3K inhibition on CDR formation. (A) A7r5 cells were serum starved for 2 h and then treated with 10 μM PP2 or 25 μM LY294002 for 30 min, followed by a 2.5-min treatment with PDGF-BB (20 ng/ml). Cells were then fixed and processed for immunofluorescence using cortactin (green) as marker of dorsal ruffles, Alexa 594–phalloidin (red) and Hoechst (blue). Scale bar, 20 μm. (B) Number of cells with CDRs expressed as percentage of cells that stained positive for at least one CDR. Results are shown as mean ± SEM from three independent experiments (≥200 cells per condition/experiment). (C) Average CDR area (shown only for CTRL and LY294002 treatment because PP2-treated cells did not form CDRs). Results are shown as mean ± SEM from three independent experiments (≥200 CDRs).
FIGURE 5:
FIGURE 5:
Role of Rac1 and Cdc42 in CDR formation. (A) A7r5 cells were transfected with siRNA targeting RhoG (RhoG KD), Cdc42 (Cdc42 KD), Rac1 (Rac KD), or Cdc42 and RhoG combined (Cdc42/RhoG KD). Control cells were transfected with a nontargeting siRNA (siCTRL). (B) Cells were infected with a myc-tagged adenovirus control (CTRL) or with adenovirus encoding wild-type mycRhoG, mycCdc42, or mycRac or their constitutively active forms (mycRhoG Q61L, mycCdc42 Q61L, or mycRac Q61L). After 72 h, the cells were serum starved for 2 h and stimulated with PDGF-BB (20 ng/ml) for 2.5 min. In A, cells were then fixed and processed for immunofluorescence using cortactin (green) as marker of dorsal ruffles, Alexa 594–phalloidin (red), and Hoechst (blue), and in B, with cortactin (red), myc (green), and Hoechst (blue). Scale bar, 20 μM. (C–E) The experiments shown in A and B were quantified as follows: (C) percentage of cells with CDRs, (D) average CDR area, and (E) average number of CDR per cell (in cells positive for CDRs). Results are mean ± SEM from three independent experiments (≥100 cells per condition/experiment).
FIGURE 6:
FIGURE 6:
RhoG silencing effect on Rac1 activation. (A) A7r5 cells were serum starved for 2 h and then stimulated with PDGF-BB (20 ng/ml) for 1, 2.5, and 5 min. Active Rac1 (Rac1-GTP) was then precipitated from total lysates using GST-PBD and immunoblotted with Rac1 antibodies. (B) A7r5 cells were transfected with siRNA targeting RhoG (RhoG KD) or with a nontargeting siRNA (CTRL). After 72 h, cells were serum starved for 2 h and then treated with PDGF-BB (20 ng/ml) for 1 min. Active Rac1 (Rac1-GTP) was precipitated from total lysates using GST-PBD and immunoblotted with the indicated antibodies. Tubulin was used as loading control. (C) Quantification of three independent assays. Rac-GTP is calculated as a ratio of active (Rac1-GTP)/total Rac1 (Rac1-Tot) signal and expressed in arbitrary units (A.U.).
FIGURE 7:
FIGURE 7:
Trio regulates RhoG activation and CDR formation. (A) A7r5 cells were serum starved for 2 h and stimulated with PDGF-BB (20 ng/ml) for 2.5 min. Cells were then fixed and processed for immunofluorescence using Trio antibody (red), Alexa 488–phalloidin (green), and Hoechst (blue) to stain the nucleus. Scale bar, 20 μm. (B) A7r5 cells transfected with a siRNA targeting Trio (Trio KD) or nontargeting siRNA (CTRL) were serum starved for 2 h and then stimulated with PDGF-BB (20 ng/ml) for 1 min. Active RhoG (RhoG-GTP) was precipitated from total lysates using GST-ELMO and immunoblotted for RhoG. (C) Quantification of at least three independent assays. RhoG-GTP is calculated as the ratio of active/total RhoG signal and expressed in arbitrary units (A.U.). (D) Serum-starved A7r5 cells were preincubated with the Trio inhibitor ITX3 (100 μM) or with DMSO (CTRL) and then stimulated with PDGF-BB (20 ng/ml) for 1 min. Active RhoG (RhoG-GTP) was precipitated from total lysates using GST-ELMO and immunoblotted with the indicated antibodies. (E) Quantification of at least three independent assays. RhoG-GTP is calculated as the ratio of active/total RhoG signal and expressed in arbitrary units (A.U.). (F) Serum-starved A7r5 cells were preincubated with the Trio inhibitor ITX3 (100 μM) or with DMSO (CTRL) and then stimulated with PDGF-BB (20 ng/ml) for 1 min. Active Rac1 (Rac-GTP) was precipitated from total lysates using GST-PBD and immunoblotted with the indicated antibodies. (G) Quantification of at least three independent assays. Active Rac1 (Rac1-GTP) is calculated as the ratio of active/total Rac1 signal and expressed in arbitrary units (A.U.). (H) A7r5 cells were preincubated with ITX3 (100 μM) or DMSO (CTRL) and stimulated with PDGF-BB (20 ng/ml) for 2.5 min. Cells were fixed and processed for immunofluorescence using cortactin (green) as marker of dorsal ruffles, Alexa 594–phalloidin (red), and Hoechst (blue). Scale bar, 20 μm. Quantification of (I) percentage of cells with CDRs, (J) average area of each CDR, and (K) number of CDRs per cell (in cells positive for CDRs). Black bars, CTRL; gray bars, ITX3. Results are mean ± SEM from three independent experiments (≥100 cells per condition/experiment).
FIGURE 8:
FIGURE 8:
RhoG regulates macropinocytosis. A7r5 cells were transfected with the indicated siRNAs. RhoG or Trio expression was then rescued with adenovirus infection of mycRhoG or TrioD1-GFP, respectively. After 2 h of serum starvation, cells were incubated with 250 μg/ml Alexa Fluor 594–conjugated dextran (10,000 molecular weight) with or without 20 ng/ml PDGF-BB for 60 min. Cells were then lysed, and dextran internalization was measured at 590/617 nm in a fluorometer. Dextran concentration in each sample was extrapolated by a dextran standard curve, normalized by the amount of protein in each condition, and expressed as nanograms of dextran/microgram of protein. Results are shown as mean ± SEM from three independent experiments. (A) Effects of RhoG KD and rescue on dextran internalization. (B) The efficiency of RhoG KD and rescue was analyzed by immunoblotting with the indicated antibodies. (C) Effects of Trio KD and rescue on dextran internalization. (D) The efficiency of Trio KD and rescue (Trio-D1-GFP) was analyzed by immunoblotting with the indicated antibodies. (E) Internalization of PDGFR was assessed by protection to trypsin digestion assay as described in Materials and Methods. Cells transfected with siRNA targeting RhoG (RhoG KD) or a nontargeting control (CTRL) were serum starved for 2 h and stimulated with 20 ng/ml PDGF-BB for the indicated times. After trypsin digestion, cell lysates were analyzed by immunoblot for the indicated antibodies. PDGFR observed in this assay corresponds to the internalized fraction of receptor (protected from trypsin). RhoG blot shows the efficiency of knockdown. RhoGDI was used as a loading control. (F) To rule out changes in total levels of PDGFR between CTRL and RhoG KD, cells were treated as in E, incubated for 30 min with PDGF, and processed for immunoblotting without trypsin treatment.
FIGURE 9:
FIGURE 9:
RhoG and Trio regulate chemotaxis toward PDGF. (A) Real-time migration was performed with an xCELLigence RTCA DP System using CIM-plate 16. RhoG KD (shRhoG) or control (CTRL) cells were seeded on the upper part of the chamber and allowed to migrate toward a lower chamber containing 20 ng/ml PDFG-BB. (B) Alternatively, cells were allowed to migrate as described in the presence of 100 μM ITX3 or the equivalent volume of DMSO. Impedance measure every 5 min during the first 6 h of migration expressed as delta cell index, with each point corresponding to the average of three or four wells (±SD). Each graph is representative of three independent experiments. (C) Analysis of wound closure in a confluent monolayer of control or RhoG siRNA–transfected A7r5 cells (RhoG KD). Cells were imaged at different time points to monitor wound closure. Representative images for control (CTRL) and RhoG KD cells (RhoG KD) at 0 and 16 h after wounding. (D) Wound area at 0 and 16 h (error bars represent SEM; n = 3). (E) KD efficiency for A (left, shRNA-mediated KD) and C and D (right, siRNA-mediated KD) was analyzed by SDS–PAGE and Western blotting. (F) Working model. RhoG functions both upstream of Rac1 and contributes to regulate the formation of CDRs and independently of Rac1, where it functions downstream of Trio to regulate the size of the CDRs formed. Cdc42 also controls CDR formation and size, probably downstream of the Cdc42 GEF Tuba.

Similar articles

Cited by

References

    1. Abercrombie M, Heaysman JE, Pegrum SM. The locomotion of fibroblasts in culture. II. “Ruffling.”. Exp Cell Res. 1970;60:437–444. - PubMed
    1. Allard J, Mogilner A. Traveling waves in actin dynamics and cell motility. Curr Opin Cell Biol. 2013;25:107–115. - PMC - PubMed
    1. Andrae J, Gallini R, Betsholtz C. Role of platelet-derived growth factors in physiology and medicine. Genes Dev. 2008;22:1276–1312. - PMC - PubMed
    1. Bass MD, Williamson RC, Nunan RD, Humphries JD, Byron A, Morgan MR, Martin P, Humphries MJ. A syndecan-4 hair trigger initiates wound healing through caveolin- and RhoG-regulated integrin endocytosis. Dev Cell. 2011;21:681–693. - PMC - PubMed
    1. Bellanger JM, Astier C, Sardet C, Ohta Y, Stossel TP, Debant A. The Rac1- and RhoG-specific GEF domain of Trio targets filamin to remodel cytoskeletal actin. Nat Cell Biol. 2000;2:888–892. - PubMed

MeSH terms

LinkOut - more resources