. 2017 Jul 1;118(1):634-646.
doi: 10.1152/jn.00618.2016. Epub 2017 May 3.

Ube3a loss increases excitability and blunts orientation tuning in the visual cortex of Angelman syndrome model mice

Affiliations

Ube3a loss increases excitability and blunts orientation tuning in the visual cortex of Angelman syndrome model mice

Michael L Wallace et al. J Neurophysiol. .

Abstract

Angelman syndrome (AS) is a neurodevelopmental disorder caused by loss of the maternally inherited allele of UBE3AUbe3aSTOP/p+ mice recapitulate major features of AS in humans and allow conditional reinstatement of maternal Ube3a with the expression of Cre recombinase. We have recently shown that AS model mice exhibit reduced inhibitory drive onto layer (L)2/3 pyramidal neurons of visual cortex, which contributes to a synaptic excitatory/inhibitory imbalance. However, it remains unclear how this loss of inhibitory drive affects neural circuits in vivo. Here we examined visual cortical response properties in individual neurons to explore the consequences of Ube3a loss on intact cortical circuits and processing. Using in vivo patch-clamp electrophysiology, we measured the visually evoked responses to square-wave drifting gratings in L2/3 regular-spiking (RS) neurons in control mice, Ube3a-deficient mice, and mice in which Ube3a was conditionally reinstated in GABAergic neurons. We found that Ube3a-deficient mice exhibited enhanced pyramidal neuron excitability in vivo as well as weaker orientation tuning. These observations are the first to show alterations in cortical computation in an AS model, and they suggest a basis for cortical dysfunction in AS.NEW & NOTEWORTHY Angelman syndrome (AS) is a severe neurodevelopmental disorder caused by the loss of the gene UBE3A Using electrophysiological recording in vivo, we describe visual cortical dysfunctions in a mouse model of AS. Aberrant cellular properties in AS model mice could be improved by reinstating Ube3a in inhibitory neurons. These findings suggest that inhibitory neurons play a substantial role in the pathogenesis of AS.

Keywords: Angelman syndrome; Ube3a; autism; visual cortex.


Figures

Fig. 1.
Fig. 1.
Reinstatement of Ube3a in Gad2-Cre+ inhibitory neurons normalizes intrinsic excitability and membrane resistance in L2/3 RS neurons of Ube3aSTOP/p+ mice. A: sagittal brain sections from control, Ube3aSTOP/p+, and Ube3aSTOP/p+::Gad2-Cre mice immunostained for UBE3A. B: schematic of in vivo whole cell recording configuration. C: sample image of a L2/3 pyramidal neuron that was recorded, filled with neurobiocytin, and stained post hoc. D: sample recordings from L2/3 regular-spiking (RS) pyramidal neuron in response to increasing current injections (scale bar 40 mV, 100 ms). E: average frequency vs. current curves from whole cell recordings in control (n = 42 cells), Ube3aSTOP/p+ (n = 34), and Ube3aSTOP/p+:: Gad2-Cre (n = 31) mice. Note that all significance values are post hoc comparisons between Ube3aSTOP/p+ group and either control (black asterisk) or Ube3aSTOP/p+::Gad2-Cre (green asterisk) groups. F: membrane resistance measured during a DOWN state in RS neurons from control (n = 39), Ube3aSTOP/p+ (n = 31), and Ube3aSTOP/p+:: Gad2-Cre (n = 29) mice. G: membrane potential during a DOWN state in L2/3 RS neurons from control (n = 42), Ube3aSTOP/p+ (n = 32), and Ube3aSTOP/p+:: Gad2-Cre (n = 30) mice. H: depth from the pial surface of all RS cells recorded in L2/3 from control (n = 42), Ube3aSTOP/p+ (n = 31), and Ube3aSTOP/p+:: Gad2-Cre (n = 29) mice. *P < 0.05, **P < 0.01 , ***P < 0.001 with post hoc test for significance.
Fig. 2.
Fig. 2.
Global Ube3a deletion does not affect spontaneous spiking rates and oscillatory activity in L2/3 RS neurons. A: schematic of recording configuration during spontaneous activity (note that animal is presented with a gray screen stimulus). B: sample recording of a spontaneously active L2/3 RS neuron (top) and an example of automated detection of UP/DOWN states (bottom) (scale bars = 1 s, 25 mV). C: spontaneous spiking activity rates for all RS neurons recorded in L2/3 of control (n = 41), Ube3aSTOP/p+ (n = 31), and Ube3aSTOP/p+::Gad2-Cre (n = 30) mice (note that points at “0.001/0” represent neurons that did not exhibit spontaneous spiking activity during the recording session) (Kruskal-Wallis test, P = 0.315). D: standard deviation of the membrane voltage for all RS neurons recorded in L2/3 for control (n = 28), Ube3aSTOP/p+ (n = 19), and Ube3aSTOP/p+::Gad2-Cre (n = 21) mice (ANOVA, P = 0.59). E: UP state frequency for control (n = 28), Ube3aSTOP/p+ (n = 19), and Ube3aSTOP/p+::Gad2-Cre (n = 21) mice (Kruskal-Wallis test, P = 0.446). F: UP state duration for control (n = 28), Ube3aSTOP/p+ (n = 19), and Ube3aSTOP/p+::Gad2-Cre (n = 21) mice (ANOVA, P = 0.161).
Fig. 3.
Fig. 3.
Spectral analysis of spontaneous UP/DOWN states in L2/3 RS neurons. A: schematic of recording configuration during spontaneous activity (note that animal is presented with a gray screen stimulus). B: sample recording of a spontaneously active L2/3 RS neuron (top) and corresponding spectrogram (bottom) (scale bar = 1 s, 20 mV). C: average power spectrum of spontaneous activity of individual L2/3 RS neurons for control (n = 24), Ube3aSTOP/p+ (n = 19), and Ube3aSTOP/p+::Gad2-Cre (n = 18) mice. Frequency ranges are defined as delta (0.5–4 Hz), theta (4.5–8 Hz), alpha (8.5–12 Hz), beta (12.5–29.5 Hz), and gamma (30–80 Hz) (2-way ANOVA, P = 0.462). D: average power spectrum of UP states of individual L2/3 RS neurons for control (n = 24), Ube3aSTOP/p+ (n = 19), and Ube3aSTOP/p+::Gad2-Cre (n = 18) mice (2-way ANOVA, P = 0.58). E: average power spectrum of DOWN states of individual L2/3 RS neurons for control (n = 24), Ube3aSTOP/p+ (n = 19), and Ube3aSTOP/p+::Gad2-Cre (n = 18) mice (2-way ANOVA, P = 0.53).
Fig. 4.
Fig. 4.
Spectral power changes induced with visual stimulation. A: sample recording of a L2/3 RS neuron during 1 s of visual stimulation (shaded region, top) and corresponding spectrogram of recording (bottom). B: average change in power with visual stimulation at different frequency bands for control (n = 31), Ube3aSTOP/p+ (n = 26), and Ube3aSTOP/p+::Gad2-Cre (n = 23) mice (2-way ANOVA, P = 0.542). Frequency ranges are defined as delta (2–4 Hz), theta (4.5–8 Hz), alpha (8.5–12 Hz), beta (12.5–29.5 Hz), and gamma (30–80 Hz). C: average change in power with visual stimulation for all frequencies for control (n = 31), Ube3aSTOP/p+ (n = 26), and Ube3aSTOP/p+:: Gad2-Cre (n = 23) mice.
Fig. 5.
Fig. 5.
Contrast sensitivity is unchanged in Ube3aSTOP/p+ mice. A: sample recording from a L2/3 RS neuron of visually evoked responses to drifting gratings of increasing contrast (scale bar 150 ms, 20 mV). Blue shaded region indicates the zone representing the “Area” measurement or subthreshold synaptic response to visual stimulation. B: average contrast sensitivity curves for spiking responses fit with a hyperbolic ratio equation for control (n = 12), Ube3aSTOP/p+ (n = 11), and Ube3aSTOP/p+::Gad2-Cre (n = 15) mice. C: average contrast exponent for spiking responses fit with a hyperbolic ratio equation in control (n = 12), Ube3aSTOP/p+ (n = 11), and Ube3aSTOP/p+:: Gad2-Cre (n = 15) mice (Kruskal-Wallis test, P = 0.311). D: average semisaturation contrast (C50) for spiking responses fit with a hyperbolic ratio equation in control (n = 12), Ube3aSTOP/p+ (n = 11), and Ube3aSTOP/p+::Gad2-Cre (n = 15) mice (Kruskal-Wallis test, P = 0.300). E: average contrast sensitivity curves for subthreshold responses fit with a hyperbolic ratio equation for control (n = 41), Ube3aSTOP/p+ (n = 31), and Ube3aSTOP/p+::Gad2-Cre (n = 30) mice. F: average contrast exponent for subthreshold responses fit with a hyperbolic ratio equation in control (n = 41), Ube3aSTOP/p+ (n = 31), and Ube3aSTOP/p+::Gad2-Cre (n = 30) mice (Kruskal-Wallis test, P = 0.800). G: average semisaturation contrast (C50) for subthreshold responses fit with a hyperbolic ratio equation in control (n = 41), Ube3aSTOP/p+ (n = 31), and Ube3aSTOP/p+::Gad2-Cre (n = 30) mice (Kruskal-Wallis test, P = 0.238).
Fig. 6.
Fig. 6.
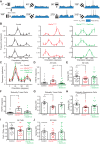
Broader orientation tuning in L2/3 regular spiking neurons of Ube3aSTOP/p+ mice. A: sample recording from a L2/3 RS neuron to drifting gratings of different orientations. Blue shaded region indicates the zone representing the “Area” measurement or subthreshold synaptic response to visual stimulation (note that this neuron did not show significant subthreshold F1 modulation) (scale bar 200 ms, 20 mV). B: sample tuning curves and spiking responses to visual stimuli of different orientations (3 sample neurons per group) for control (left, black), Ube3aSTOP/p+ (center, red), and Ube3aSTOP/p+::Gad2-Cre (right, green) mice. Spiking responses are represented as mean ± SE of at least 6 presentations of each orientation. Tuning curve for sample recording (A) is top rightmost curve of the samples from the Ube3aSTOP/p+::Gad2-Cre group. C: average tuning curves from control (n = 35), Ube3aSTOP/p+ (n = 27), and Ube3aSTOP/p+::Gad2-Cre (n = 27) mice. D: half-width at half-height (HWHH) measurements made from Gaussian fits of spiking orientation tuning curves from control (n = 35), Ube3aSTOP/p+ (n = 27), and Ube3aSTOP/p+::Gad2-Cre (n = 27) mice (Kruskal-Wallis test, P = 0.041). E: orientation selectivity index (OSI) measured from spiking orientation tuning curves from all recorded cells in control (n = 35), Ube3aSTOP/p+ (n = 27), and Ube3aSTOP/p+:: Gad2-Cre (n = 27) mice (ANOVA, P = 0.026). F: HWHH measurements made from Gaussian fits of spiking orientation tuning curves for robustly tuned cells in control (n = 15), Ube3aSTOP/p+ (n = 10), and Ube3aSTOP/p+::Gad2-Cre (n = 8) mice (Kruskal-Wallis test, P = 0.044). G: OSI measured from spiking responses from cells that were well fit by sum-of-two-Gaussian tuning curves [i.e., normalized residuals of the fit were <0.0125; control (n = 16), Ube3aSTOP/p+ (n = 10), and Ube3aSTOP/p+::Gad2-Cre (n = 8), Kruskal-Wallis test, P = 0.031]. H: OSI measured from spiking orientation tuning curves from cells that robustly responded to at least 1 orientation compared with all others [i.e., ANOVA post-hoc test must be P < 0.05; control (n = 22), Ube3aSTOP/p+ (n = 18), and Ube3aSTOP/p+:: Gad2-Cre (n = 20), ANOVA, P = 0.045]. I: preferred-to-orthogonal ratio from spiking orientation tuning curves from all recorded cells in control (n = 35), Ube3aSTOP/p+ (n = 27), and Ube3aSTOP/p+:: Gad2-Cre (n = 27) mice (Kruskal-Wallis test, P = 0.151). J: direction selectivity index (DSI) measured from spiking orientation tuning curves from all recorded cells in control (n = 35), Ube3aSTOP/p+ (n = 27), and Ube3aSTOP/p+::Gad2-Cre (n = 27) mice (ANOVA, P = 0.294). *P < 0.05 with post hoc test for significance.
Fig. 7.
Fig. 7.
Subthreshold orientation tuning is unchanged in Ube3aSTOP/p+ mice. A: illustration of the measurements made for the subthreshold analysis of visual responses. F0 is the mean subthreshold membrane potential, F1 is the difference between the peak and trough of the subthreshold membrane potential, and blue shaded region corresponds to the Area (V × s) measurement. All measurements are made during presentation of the visual stimulus. B: sample recording from a L2/3 RS neuron to drifting gratings in its preferred and orthogonal orientations. Blue shaded region indicates the zone representing the “Area” measurement or subthreshold synaptic response to visual stimulation. The recordings are averages of 6 presentations of the same orientation and low-pass filtered at 100 Hz. (note that this neuron had significant subthreshold F1 modulation to the preferred orientation) (scale bar 200 ms, 5 mV). C: histograms of subthreshold F1/F0 measurements at the neuron’s preferred orientation (F1/F0Pref). D: orientation selectivity index measured from subthreshold (Area) orientation tuning curves from control (n = 42), Ube3aSTOP/p+ (n = 32), and Ube3aSTOP/p+::Gad2-Cre (n = 30) mice (Kruskal-Wallis test, P = 0.774). E: orientation selectivity index measured from subthreshold F1 from control (n = 35), Ube3aSTOP/p+ (n = 27), and Ube3aSTOP/p+::Gad2-Cre (n = 27) mice (Kruskal-Wallis test, P = 0.85). F: direction selectivity index measured from subthreshold (Area) orientation tuning curves from control (n = 42), Ube3aSTOP/p+ (n = 32), and Ube3aSTOP/p+::Gad2-Cre (n = 30) mice (ANOVA, P = 0.393).

Similar articles

Cited by

References

    1. Albrecht DG, Hamilton DB. Striate cortex of monkey and cat: contrast response function. J Neurophysiol 48: 217–237, 1982. - PubMed
    1. Atallah BV, Bruns W, Carandini M, Scanziani M. Parvalbumin-expressing interneurons linearly transform cortical responses to visual stimuli. Neuron 73: 159–170, 2012. doi:10.1016/j.neuron.2011.12.013. - DOI - PMC - PubMed
    1. Beltramo R, D’Urso G, Dal Maschio M, Farisello P, Bovetti S, Clovis Y, Lassi G, Tucci V, De Pietri Tonelli D, Fellin T. Layer-specific excitatory circuits differentially control recurrent network dynamics in the neocortex. Nat Neurosci 16: 227–234, 2013. doi:10.1038/nn.3306. - DOI - PubMed
    1. Brainard DH. The Psychophysics Toolbox. Spat Vis 10: 433–436, 1997. doi:10.1163/156856897X00357. - DOI - PubMed
    1. Carandini M, Ferster D. Membrane potential and firing rate in cat primary visual cortex. J Neurosci 20: 470–484, 2000. - PMC - PubMed

Publication types

MeSH terms

Substances