. 2017 Sep 1;118(3):1439-1456.
doi: 10.1152/jn.00986.2016. Epub 2017 May 3.

Regulation of axonal regeneration following spinal cord injury in the lamprey

Affiliations

Regulation of axonal regeneration following spinal cord injury in the lamprey

Jessica A Benes et al. J Neurophysiol. .

Abstract

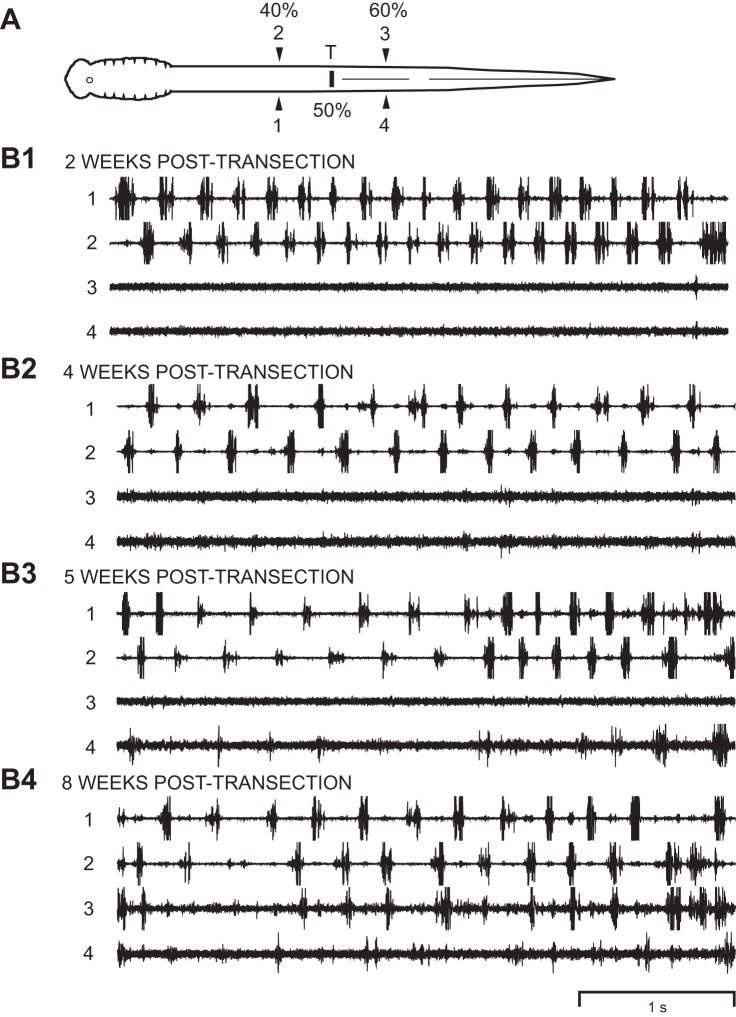
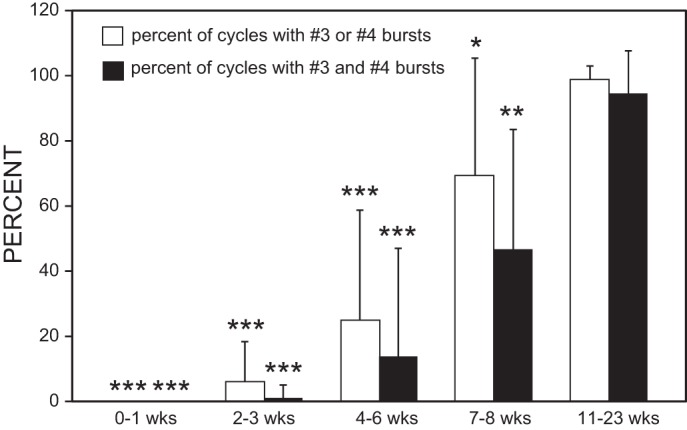
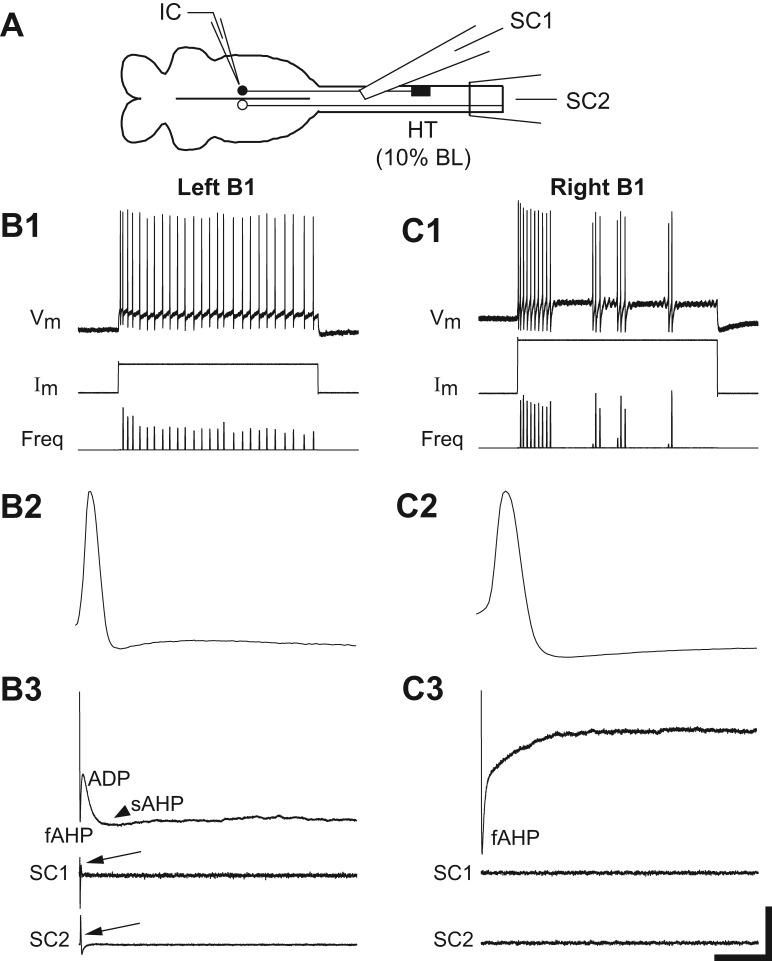
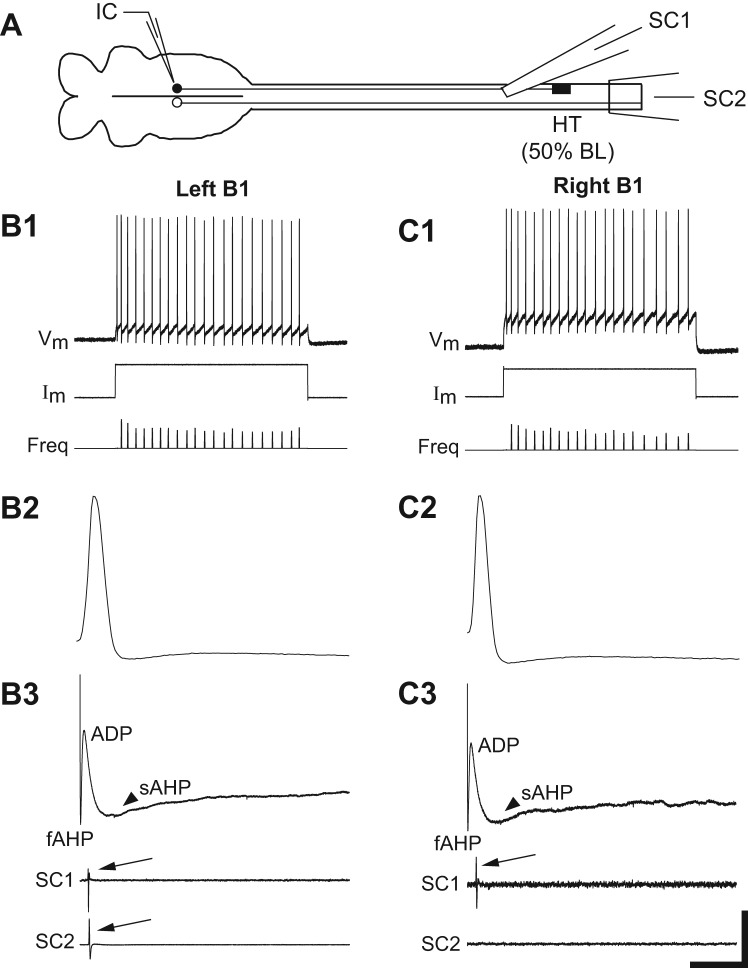
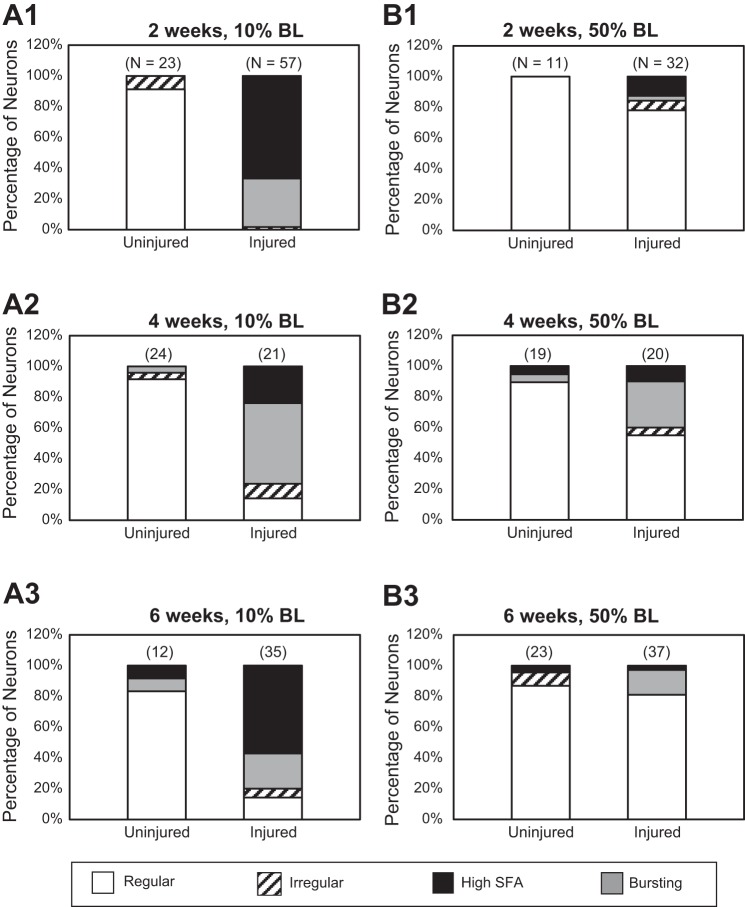
Following rostral spinal cord injury (SCI) in larval lampreys, injured descending brain neurons, particularly reticulospinal (RS) neurons, regenerate their axons, and locomotor behavior recovers in a few weeks. However, axonal regeneration of descending brain neurons is mostly limited to relatively short distances, but the mechanisms for incomplete axonal regeneration are unclear. First, lampreys with rostral SCI exhibited greater axonal regeneration of descending brain neurons, including RS neurons, as well as more rapid recovery of locomotor muscle activity right below the lesion site, compared with animals with caudal SCI. In addition, following rostral SCI, most injured RS neurons displayed the "injury phenotype," whereas following caudal SCI, most injured neurons displayed normal electrical properties. Second, following rostral SCI, at cold temperatures (~4-5°C), axonal transport was suppressed, axonal regeneration and behavioral recovery were blocked, and injured RS neurons displayed normal electrical properties. Cold temperatures appear to prevent injured RS neurons from detecting and/or responding to SCI. It is hypothesized that following rostral SCI, injured descending brain neurons are strongly stimulated to regenerate their axons, presumably because of elimination of spinal synapses and reduced neurotrophic support. However, when these neurons regenerate their axons and make synapses right below the lesion site, restoration of neurotrophic support very likely suppress further axonal regeneration. In contrast, caudal SCI is a weak stimulus for axonal regeneration, presumably because of spared synapses above the lesion site. These results may have implications for mammalian SCI, which can spare synapses above the lesion site for supraspinal descending neurons and propriospinal neurons.NEW & NOTEWORTHY Lampreys with rostral spinal cord injury (SCI) exhibited greater axonal regeneration of descending brain neurons and more rapid recovery of locomotor muscle activity below the lesion site compared with animals with caudal SCI. In addition, following rostral SCI, most injured reticulospinal (RS) neurons displayed the "injury phenotype," whereas following caudal SCI, most injured neurons had normal electrical properties. We hypothesize that following caudal SCI, the spared synapses of injured RS neurons might limit axonal regeneration and behavioral recovery.

Keywords: axotomy; locomotion; neurotrophic factors; reticulospinal neurons.


Figures

Fig. 1.
Fig. 1.
A: diagrams of 3 experimental animal groups for retrograde anatomical labeling experiments. At various recovery times following spinal transections (T) at 10% body length (BL; normalized distance from anterior head; A1), 30% BL (A2), or 50% BL (A3), HRP was applied to the spinal cords of experimental animals at 20%, 40%, or 60% BL, respectively. For normal animals, HRP was applied at 20%, 40%, and 60% BL (not shown). B, top: diagram of brain (left) and upper spinal cord (right) showing contours around 11 cell groups of descending brain neurons, of which ~80% are reticulospinal (RS) neurons (see Davis and McClellan 1994a for detailed description of cell groups). Reticular cell groups are mesencephalic reticular nucleus (MRN) and anterior (ARRN), middle (MRRN), and posterior (PRRN) rhombencephalic reticular nuclei. Non-reticular cell groups are diencephalic group (Di) and anterolateral (ALV), dorsolateral (DLV), and posterolateral (PLV) vagal groups. The aARRN, lARRN, and mARRN are the anterior, lateral, and medial subdivisions of the ARRN, respectively, whereas the aMRRN and pMRRN are the anterior and posterior subdivisions of the MRRN, respectively. Bottom, enlargement of several reticular nuclei showing large, identified RS neurons: M cells in MRN, I cells in ARRN, and B cells in MRRN are called Müller cells, which have ipsilateral descending axons, and Mauthner (Mau) and auxiliary Mauthner (AM) cells are located in MRRN and have contralateral projecting descending axons. In top and bottom diagrams, unidentified RS neurons and non-RS neurons are omitted for simplicity.
Fig. 2.
Fig. 2.
Percentages of retrogradely labeled descending brain neurons (means and SDs) for normal animals (open bars) and experimental animals (filled bars) at various recovery times following HRP application to the spinal cord at 20% BL (A), 40% BL (B), or 60% BL (C; see Fig. 1A). In experimental animals, spinal cord transections were made at 10% BL (A), 30% BL (B), or 50% BL (C). Percentages were determined by normalization to the mean numbers of labeled neurons for normal animals in the same group (see numbers above open bars). Statistics: *P ≤ 0.05; **P ≤ 0.01; ***P ≤ 0.001 compared with percent labeling at same recovery time in A. †P ≤ 0.05 compared with percent labeling at same recovery time in B (Kruskal-Wallis with Dunn’s multiple comparisons posttest).
Fig. 3.
Fig. 3.
Comparison of axonal regeneration of descending brain (B) neurons and descending propriospinal (PS) neurons following rostral or caudal spinal transections (T). A and B: at 6-wk recovery times following spinal transections at 20% BL (rostral; A) or 50% BL (caudal; B), HRP was applied to the spinal cord at 30% or 60% BL, respectively. The PS neurons were counted in a spinal cord region equivalent to 10% BL (~10 mm) above the spinal transection sites (shaded areas: 10–20% BL for rostral spinal transections, 40–50% BL for caudal transections). Labeled neurons in these experimental animals are expressed as a percentage of the mean numbers of labeled B and PS neurons in normal animals in which HRP was applied at 30% or 60% BL. C: following spinal cord transections at 20% BL, 22.3 ± 13.7% and 31.7 ± 20.4% of the normal numbers of B neurons (filled bars) and PS neurons (open bars), respectively, were labeled that projected to 30% BL (left pair of bars), and these percentages were not statistically different (n = 6 animals). Following spinal transections at 50% BL, 2.8 ± 4.2% and 35.3 ± 21.7% of the normal numbers of B and PS neurons, respectively, were labeled that projected to 60% BL (right pair of bars), and these percentages were significantly different (n = 14 animals). Statistics: ***P < 0.001 (Kruskal-Wallis with Dunn’s multiple comparisons posttest).
Fig. 4.
Fig. 4.
Recovery of locomotor muscle burst activity following rostral spinal transections. A: diagram of larval lamprey with a rostral spinal transection at 10% BL (T) and muscle recording electrodes at 20% BL (channels 1 and 2) and 40% BL (channels 3 and 4). B1–B4: at 2-wk recovery times, there was some very weak muscle activity below the lesion site (channels 1 and 2; channel gains were increased to show this weak activity). With increasing recovery times (4–8 wk), swimming movements gradually recovered and were accompanied by recovery of locomotor muscle burst activity at progressively more caudal distances below the spinal lesion site. At 8-wk recovery times, muscle activity was characterized by left-right alternation (12 and 34) as well as a rostrocaudal phase lag (14 and 23; see Table 3), similar to those for normal animals (n = 29; not shown; see Benthall et al. 2017; Davis et al. 1993; McClellan et al. 2016).
Fig. 5.
Fig. 5.
Recovery of locomotor muscle burst activity following caudal spinal transections. A: diagram of animal with a caudal spinal transection at 50% BL (T) and muscle recording electrodes at 40% BL (channels 1 and 2) and 60% BL (channels 3 and 4). B1–B4: at 2-wk recovery times during swimming-like movements, left-right alternating muscle burst activity was present above the spinal lesion site (12), but there was little or no muscle activity below the lesion site (channels 3 and 4). With increasing recovery times (4–8 wk), some locomotor muscle burst activity began to appear below the spinal lesion site (Fig. 6, Table 3). However, even at 8 wk, muscle burst activity below the lesion site was weak or absent. Note that the thicker traces for channels 3 and 4 indicate higher gains and weaker activity for these recording channels.
Fig. 6.
Fig. 6.
Plot of percentages of cycles (means and SD) that displayed locomotor muscle burst activity at 60% BL (recording channels 3 and 4 in Fig. 5A), below a caudal spinal lesion site at 50%, vs. recovery time. Open bars indicate the percentage of cycles in which there was locomotor burst activity on the right (channel 3) or left side (channel 4) at 60% BL. Filled bars indicate the percentage of cycles in which there was locomotor burst activity at 60% BL on both right and left sides in the same cycle. In contrast, at 3 wk following rostral spinal transections (Fig. 4A), right-left alternating burst activity was reliably present (i.e., 100%) right below the spinal lesion site (Table 3). Statistics: *P ≤ 0.05; **P ≤ 0.01; ***P ≤ 0.001 compared with 100% (1-sample t-test or Wilcoxon rank sum test).
Fig. 7.
Fig. 7.
A: diagram (not to scale) of isolated brain (left) and upper spinal cord (right) showing right spinal hemi-transection (HT) at 10% BL, intracellular recording micropipette (IC), and extracellular recording electrodes above (SC1) and below (SC2) the HT. Because Müller cells have ipsilateral descending axons, most identified RS neurons on the right side of the brain (filled circle) were injured due to the HT, whereas most left neurons (open circle) were uninjured (see McClellan et al. 2008). B and C: recordings from uninjured “B1” neuron (B; see Fig. 1B) and injured B1 neuron (C) in the same brain at 2 wk following a right spinal HT. B1 and C1: the uninjured B1 neuron fired a smooth train of action potentials (Vm) in response to depolarizing current pulses (Im), whereas the injured B1 neuron fired short repetitive bursts. Freq, instantaneous firing frequency. B2 and C2: evoked action potentials. B3 and C3: for the uninjured B1 neuron, the main depolarizing phase of action potentials was followed by 3 sequential afterpotentials: fAHP, ADP, and sAHP (arrowhead; see methods). In contrast, action potentials in the injured B1 neuron were followed by only the fAHP. Action potentials in the uninjured B1 neuron elicited orthodromic responses (arrows) above (SC1) and below (SC2) the spinal HT, whereas the injured B1 neuron did not elicit orthodromic responses, possibly because of axonal dieback. Scale bars: 50 mV/6.5 nA/32 Hz and 3 s (B1, C1); 40 mV/3 ms (B2, C2); and 5.5 mV/80 ms (B3, C3).
Fig. 8.
Fig. 8.
A: diagram (not to scale) of isolated brain (left) and upper spinal cord (right) showing right spinal HT at 50% BL (see legend for Fig. 7). Most identified RS neurons (Müller cells) on the right side of the brain (filled circle) were injured due to the HT, whereas most left RS neurons (open circle) were uninjured (see McClellan et al. 2008). B and C: recordings from uninjured (B) and injured (C) “B1” neurons in the same brain at 2 wk following right spinal HT. B1 and C1: uninjured and injured B1 neurons both fired a smooth train of action potentials (Vm) in response to depolarizing current pulses (Im). Freq, instantaneous firing frequency. B2 and C2: evoked action potentials. B3 and C3: for both uninjured and injured B1 neurons, the main depolarizing phase of action potentials was followed by 3 sequential afterpotentials: fAHP, ADP, and sAHP (arrowheads; see methods). Action potentials in the uninjured B1 neuron elicited orthodromic responses (arrows) above (SC1) and below (SC2) the spinal HT, whereas the injured B1 neuron elicited orthodromic responses (arrow) only above (SC1) the HT. Scale bars: 50 mV/6.5 nA/32 Hz and 3 s (B1, C1); 40 mV/3 ms (B2, C2); and 2.6 mV/80 ms (B3, C3).
Fig. 9.
Fig. 9.
A: animals with right spinal HTs at 10% BL (rostral; see Fig. 7A). Graphs show percentages of uninjured and injured RS neurons displaying different firing patterns (regular, irregular, high SFA, or bursting; see methods) at recovery times of 2 (A1), 4 (A2), and 6 wk (A3). B: animals with right spinal HTs at 50% BL (caudal; see Fig. 8A). Graphs show percentages of uninjured and injured RS neurons displaying different firing patterns at recovery times of 2 (B1), 4 (B2), and 6 wk (B3). Numbers above each bar indicate the total number of neurons for each condition: recovery times (2, 4, or 6 wk) and locations of right spinal HT (10% or 50% BL).
Fig. 10.
Fig. 10.
A: diagram of isolated brain/spinal cord preparation from an animal that recovered at ~4–5°C for 4 wk following a right spinal HT at 10% BL showing intracellular micropipette (IC) and extracellular electrodes above (SC1) and below (SC2) the HT. Identified RS neurons on the right side of the brain (filled circle) were injured due to the HT, whereas left neurons (open circle) were uninjured (see McClellan et al. 2008). B1 and C1: uninjured and injured RS neurons, respectively, in the same brain both fired a smooth train of action potentials (Vm) in response to depolarizing current pulses (Im). Freq, instantaneous firing frequency. B2 and C2: action potentials, recorded from the same neurons as in B1 and C1, were followed by 3 similar sequential afterpotentials: fAHP, ADP, and sAHP. For the uninjured RS neuron (B2), orthodromic responses (arrows) were recorded above (SC1) and below (SC2) the spinal HT, whereas for the injured RS neuron (C2), orthodromic responses (arrow) only occurred above the HT.

Similar articles

Cited by

References

    1. Benes JA. The Effects of Axotomy on the Biophysical Properties of Reticulospinal Neurons in Larval Lamprey (Dissertation). Columbia, MO: University of Missouri, 2006.
    1. Benítez-Temiño B, De La Cruz RR, Pastor AM. Firing properties of axotomized central nervous system neurons recover after graft reinnervation. J Comp Neurol 444: 324–344, 2002. doi:10.1002/cne.10147. - DOI - PubMed
    1. Benthall KN, Hough RA, McClellan AD. Descending propriospinal neurons mediate restoration of locomotor function following spinal cord injury. J Neurophysiol 117: 215–229, 2017. doi:10.1152/jn.00544.2016. - DOI - PMC - PubMed
    1. Bradbury EJ, McMahon SB. Spinal cord repair strategies: why do they work? Nat Rev Neurosci 7: 644–653, 2006. doi:10.1038/nrn1964. - DOI - PubMed
    1. Brimijoin S, Olsen J, Rosenson R. Comparison of the temperature-dependence of rapid axonal transport and microtubules in nerves of the rabbit and bullfrog. J Physiol 287: 303–314, 1979. doi:10.1113/jphysiol.1979.sp012660. - DOI - PMC - PubMed

Publication types

LinkOut - more resources