. 2017 May 4;2(9):e92872.
doi: 10.1172/jci.insight.92872.

Broadly neutralizing antibodies with few somatic mutations and hepatitis C virus clearance

Affiliations

Broadly neutralizing antibodies with few somatic mutations and hepatitis C virus clearance

Justin R Bailey et al. JCI Insight. .

Abstract

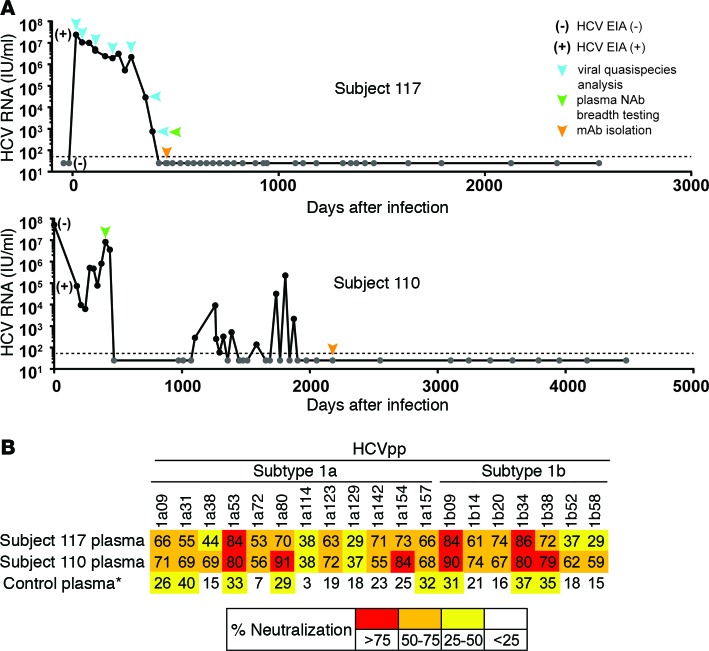
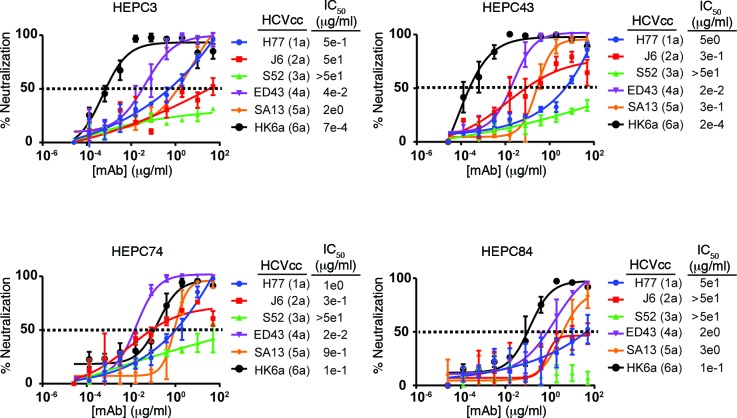
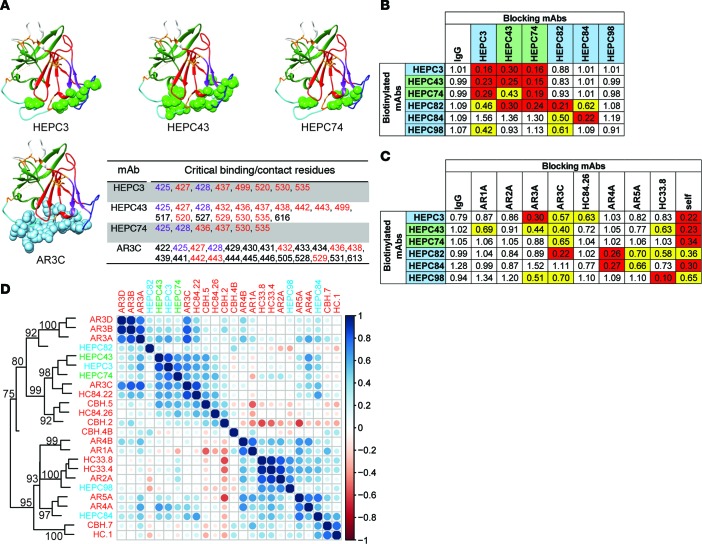
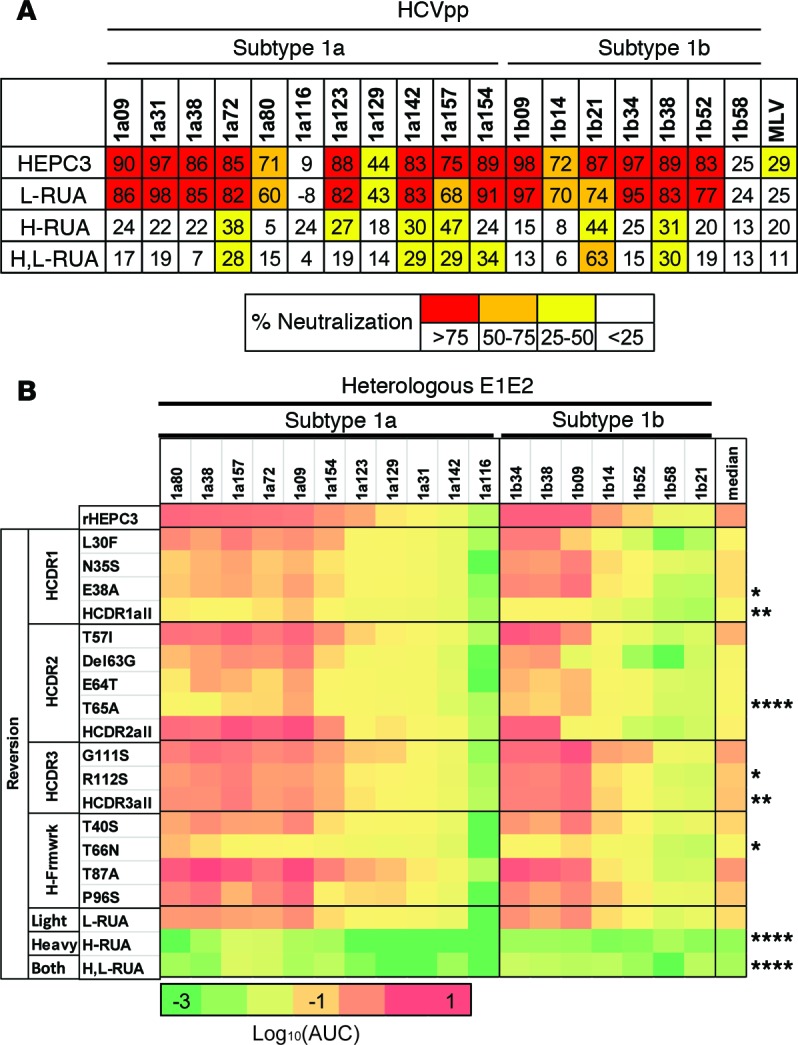
Here, we report the isolation of broadly neutralizing mAbs (bNAbs) from persons with broadly neutralizing serum who spontaneously cleared hepatitis C virus (HCV) infection. We found that bNAbs from two donors bound the same epitope and were encoded by the same germline heavy chain variable gene segment. Remarkably, these bNAbs were encoded by antibody variable genes with sparse somatic mutations. For one of the most potent bNAbs, these somatic mutations were critical for antibody neutralizing breadth and for binding to autologous envelope variants circulating late in infection. However, somatic mutations were not necessary for binding of the bNAb unmutated ancestor to envelope proteins of early autologous transmitted/founder viruses. This study identifies a public B cell clonotype favoring early recognition of a conserved HCV epitope, proving that anti-HCV bNAbs can achieve substantial neutralizing breadth with relatively few somatic mutations, and identifies HCV envelope variants that favored selection and maturation of an anti-HCV bNAb in vivo. These data provide insight into the molecular mechanisms of immune-mediated clearance of HCV infection and present a roadmap to guide development of a vaccine capable of stimulating anti-HCV bNAbs with a physiologic number of somatic mutations characteristic of vaccine responses.

Keywords: Infectious disease.


Conflict of interest statement

Conflict of interest: The authors have declared that no conflict of interest exists.

Figures

Figure 1
Figure 1. Identification of subjects who spontaneously cleared HCV and possess broadly neutralizing antibodies in plasma.
(A) HCV viral loads of two subjects who spontaneously cleared HCV infection sampled periodically from the time of initial infection through viral clearance. The dashed line indicates limit of detection (LOD) of the viral load assay, which is 50 IU/ml. Values below the LOD are set at 25 IU/ml and marked with gray circles. Plasma samples that were HCV antibody negative or positive by commercial antibody-binding assay (EIA) are indicated by - and +, respectively. The green triangles represent plasma samples tested for neutralizing breadth against the panel of 19 genotype 1 HCV pseudoparticle (HCVpp). The yellow triangles represent time points from which anti-HCV mAbs were isolated. The blue triangles represent plasma samples from which the viral quasispecies was sequenced by single-genome amplification. (B) Neutralizing breadth of plasma from the two subjects tested against a diverse panel of genotype 1a or 1b HCVpp. Values shown are the percentage of neutralization achieved by a 1:100 dilution of plasma, tested in duplicate. *For comparison, the median neutralization of each HCVpp from 42 subjects with persistent HCV infection, matched with subjects who cleared for duration of infection (Control plasma), is also shown.
Figure 2
Figure 2. Intragenotypic neutralizing breadth of anti-HCV mAbs isolated from two subjects who spontaneously cleared HCV infection.
Neutralizing breadth of mAbs against a diverse panel of genotype 1a or 1b HCV pseudoparticles (HCVpp). Neutralization patterns for the 5 most broadly neutralizing mAbs are shown; data for the remaining 10 mAbs are shown in Supplemental Figure 1. mAbs marked with blue were isolated from subject 117 and mAbs marked with green were isolated from subject 110. Values shown are the percentage of neutralization achieved by 50 μg/ml mAb. Values are means of two independent experiments, each performed in duplicate. For reference, previously described bNAbs AR4A and AR3C were tested in parallel against the same HCVpp panel.
Figure 3
Figure 3. Cross-genotypic neutralizing breadth of anti-HCV mAbs.
Neutralizing breadth of mAbs against a panel of genotype 1–6 replication competent hepatitis C viruses (HCVcc). The 4 mAbs with greatest neutralizing breadth in Figure 2 were tested. The name of each HCVcc strain is indicated, with the viral subtype in parenthesis. Values shown are the means of two independent experiments, each performed in triplicate, and error bars represent standard deviations between experiments. The half-maximal inhibitory concentration (IC50) of each mAb/HCVcc combination is shown. Curves with neutralization exceeding 50% at only the highest mAb concentration (50 μg/ml) were assigned an IC50 of 50 μg/ml.
Figure 4
Figure 4. Epitope mapping of anti-HCV bNAbs.
(A) Critical binding residues for bNAbs based on relative binding to alanine-scanning mutants spanning the full H77 E1E2 sequence. Binding residues are marked with green spheres superimposed on the H77 E2 core structure (31). For reference, contact residues for mAb AR3C, identified by Kong et al., are indicated with blue spheres. Additional mAbs are shown in Supplemental Figure 3. In the table, critical binding or contact residues shared by at least two mAbs are highlighted in red, and those shared by all 4 mAbs in purple. (B and C) Competition binding between mAbs. The 6 most broadly neutralizing mAbs from s117 (blue) and s110 (green) are shown, with additional mAbs shown in Supplemental Figure 4. Relative binding of 2 μg/ml of the biotinylated mAbs to strain 1a53 E1E2 in the presence or absence of blocking mAbs at a concentration of 20 μg/ml. Combinations resulting in relative binding <0.7 or <0.35 are marked in yellow or red, respectively. (B) Competition binding between newly identified mAbs and each other. Values represent the average of two independent experiments performed in duplicate. (C) Competition binding between newly identified mAbs and reference bNAbs. Values represent the average of replicates from one experiment, except for AR3C, which was tested in duplicate in two independent experiments. (D) Clustering of the 6 most broadly neutralizing mAbs (blue or green) with reference bNAbs (red) based upon neutralization profiling. For each mAb, neutralization of each of 19 HCV pseudoparticles was measured, generating a neutralization profile, and pairwise Spearman correlations were measured between these neutralization profiles. Circles at each intersection were scaled by the magnitude of the correlation between the indicated mAbs. Hierarchical clustering analysis using these pairwise correlations is depicted as a tree. Numbers at tree nodes are approximately unbiased (AU) test values (49), indicating strength of support for a particular cluster.
Figure 5
Figure 5. Role of somatic mutations in neutralization and binding of heterologous E1E2 proteins.
(A) Neutralization of a heterologous genotype 1 HCV pseudoparticle (HCVpp) panel by HEPC3, HEPC3 with reversion of all somatic mutations in the light chain variable region to the germline encoded amino acids (L-RUA), HEPC3 with reversion of all somatic mutations in the heavy chain variable region (H-RUA), or HEPC3 with reversion of all somatic mutations in both light and heavy chain variable regions (H,L-RUA) at a concentration of 50 μg/ml mAb, measured in duplicate. (B) Binding of serial dilutions of the indicated mAbs to genotype 1 E1E2 proteins, measured by ELISA. The individual reversion or combination of reversions introduced into HEPC3 is indicated on the vertical axis. The heatmap was generated using log10 (area under the curve) of binding of each mAb/E1E2 dilution series, which was measured in duplicate. Asterisks indicate significant differences between binding of each mAb to all E1E2 variants relative to binding of HEPC3 to the same E1E2 variants, measured by 1-way ANOVA with adjustment for multiple comparisons (*P < 0.05, **P < 0.005, ****P < 0.0001).
Figure 6
Figure 6. HCV strain–specific effects of bNAb somatic mutations.
(A) Binding of serial dilutions of HEPC3 or the indicated HEPC3 mAb variants to 4 different genotype 1 E1E2 protein variants, measured by ELISA. Values are means of duplicate wells, and error bars indicate standard deviations. (B) Kinetic binding analysis of HEPC3 and HEPC3 mAb variants and soluble J6 strain (genotype 2a) E2 protein. Dissociation constants (KD) for each mAb are shown. Error bars represent the standard error of the mean, which was calculated using a global fit mode that includes several analyte concentrations. Single amino acid reversions in HEPC3 are grouped by their location in HCDR1, HCDR2, HCDR3, or framework regions (Frm).
Figure 7
Figure 7. Longitudinal evolution of autologous E1E2 genes.
Maximum likelihood phylogenetic tree of E1E2 nucleotide sequences amplified by single-genome amplification from plasma of subject 117 at 7 longitudinal time points throughout the course of infection. Sequences are color-coded by date of sampling. Transmitted/founder (T/F) sequences inferred by phylogeny and date of sampling and variants cloned for protein expression are indicated. The outgroup is composed of genotype 1a sequences from the heterologous E1E2 panel (Figure 2). Bootstrap values greater than 80 are indicated.
Figure 8
Figure 8. Role of somatic mutations in binding of autologous E1E2 proteins.
Binding of serial dilutions of HEPC3, HEPC3 with all heavy chain somatic mutations reverted to the germline-encoded amino acid (HEPC3 H-RUA), or HEPC3 with all somatic mutations reverted to the germline-encoded amino acid (HEPC3 H,L-RUA) to 21 unique autologous E1E2 proteins. Proteins are color-coded by date of sampling. Values are the means of duplicate wells, and error bars indicate standard deviations. Median binding of an isotype control antibody to all E1E2 variants is shown as a control for nonspecific binding.

Similar articles

Cited by

References

    1. Mohd Hanafiah K, Groeger J, Flaxman AD, Wiersma ST. Global epidemiology of hepatitis C virus infection: new estimates of age-specific antibody to HCV seroprevalence. Hepatology. 2013;57(4):1333–1342. - PubMed
    1. Cox AL. MEDICINE. Global control of hepatitis C virus. Science. 2015;349(6250):790–791. - PubMed
    1. Zibbell JE, et al. Increases in hepatitis C virus infection related to injection drug use among persons aged ≤30 years - Kentucky, Tennessee, Virginia, and West Virginia, 2006-2012. MMWR Morb Mortal Wkly Rep. 2015;64(17):453–458. - PMC - PubMed
    1. Conrad C, et al. Community Outbreak of HIV Infection Linked to Injection Drug Use of Oxymorphone--Indiana, 2015. MMWR Morb Mortal Wkly Rep. 2015;64(16):443–444. - PMC - PubMed
    1. Suryaprasad AG, et al. Emerging epidemic of hepatitis C virus infections among young nonurban persons who inject drugs in the United States, 2006-2012. Clin Infect Dis. 2014;59(10):1411–1419. - PubMed