

GDF15 is elevated in mice following retinal ganglion cell death and in glaucoma patients
- PMID: 28469085
- PMCID: PMC5414567
- DOI: 10.1172/jci.insight.91455
GDF15 is elevated in mice following retinal ganglion cell death and in glaucoma patients
Abstract
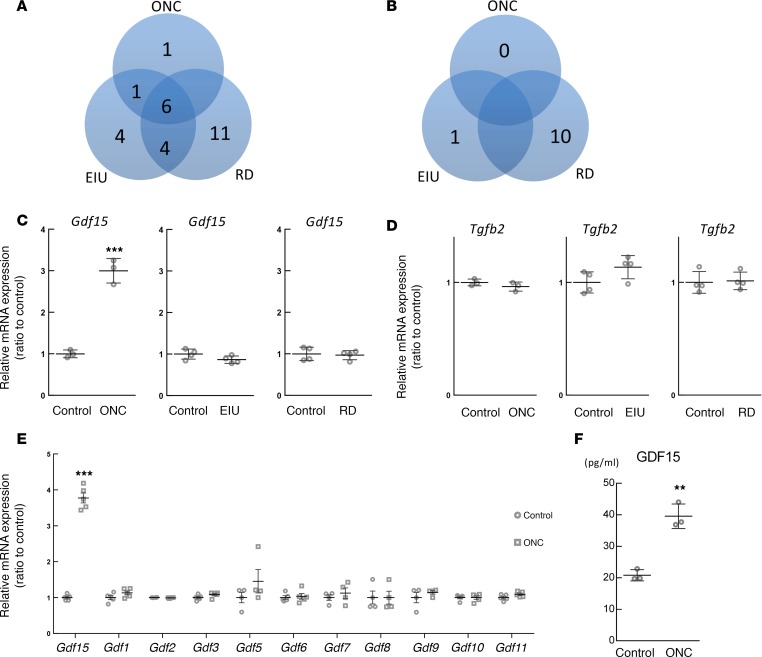
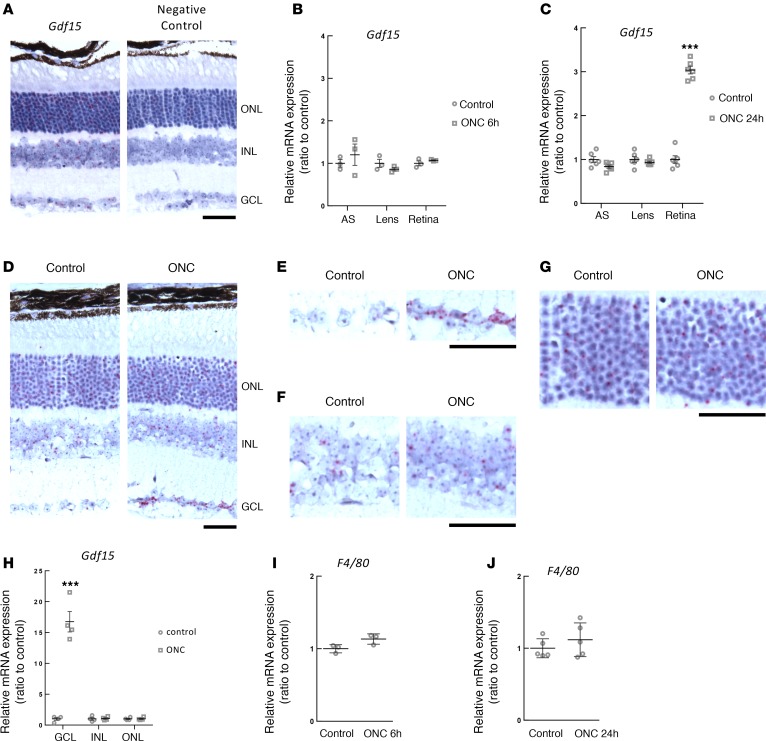
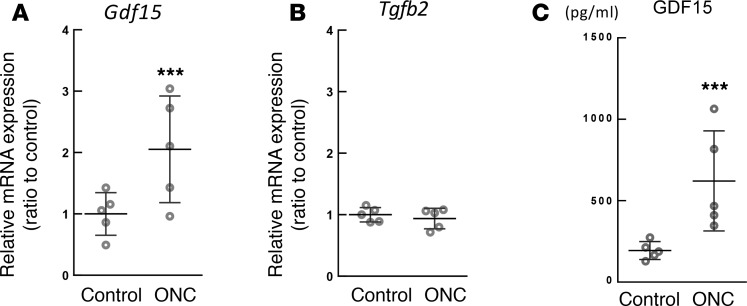
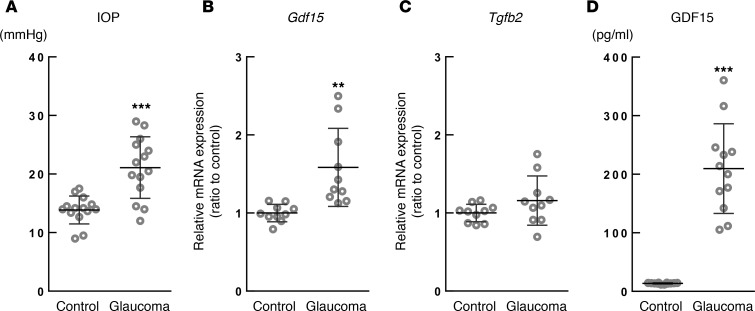
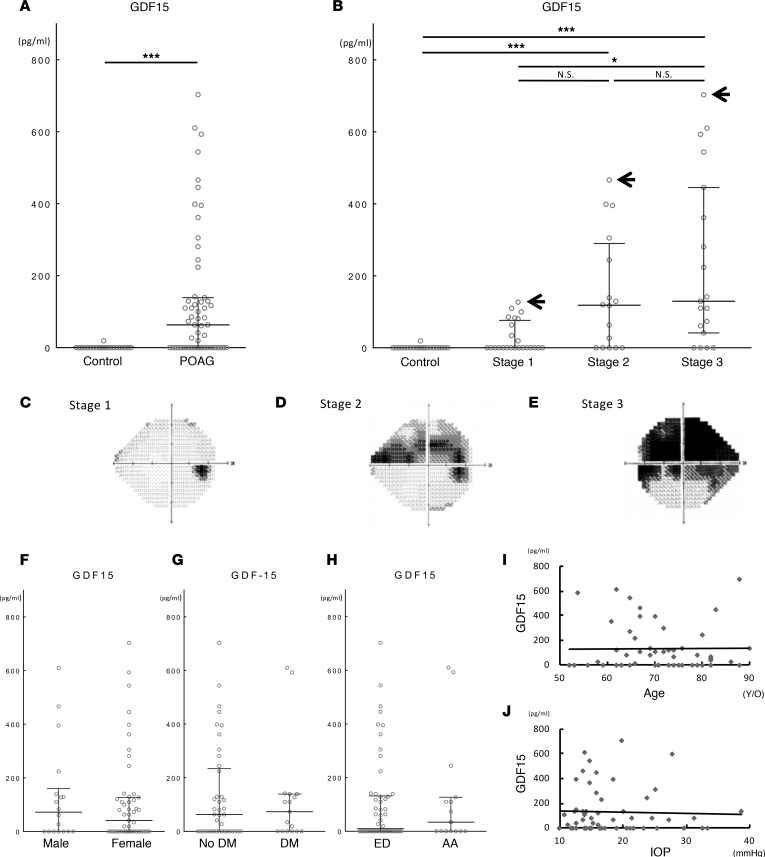
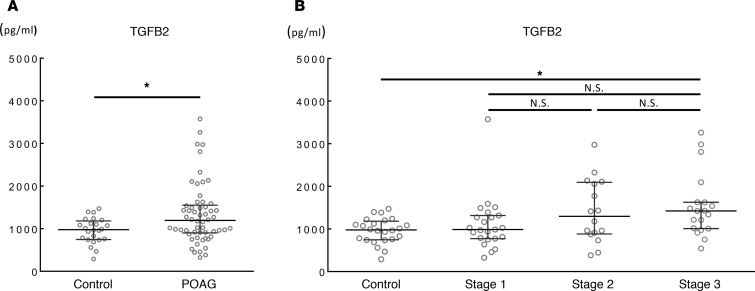
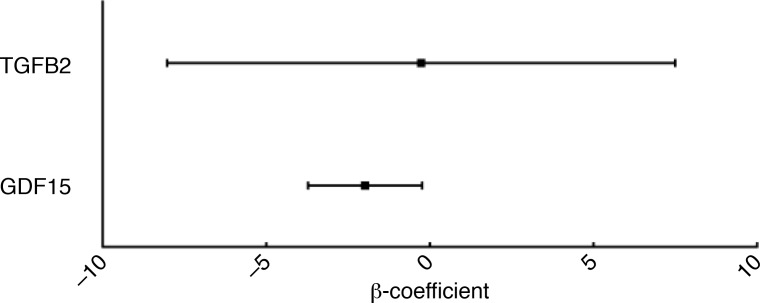
Glaucoma is the second leading cause of blindness worldwide. Physicians often use surrogate endpoints to monitor the progression of glaucomatous neurodegeneration. These approaches are limited in their ability to quantify disease severity and progression due to inherent subjectivity, unreliability, and limitations of normative databases. Therefore, there is a critical need to identify specific molecular markers that predict or measure glaucomatous neurodegeneration. Here, we demonstrate that growth differentiation factor 15 (GDF15) is associated with retinal ganglion cell death. Gdf15 expression in the retina is specifically increased after acute injury to retinal ganglion cell axons and in a murine chronic glaucoma model. We also demonstrate that the ganglion cell layer may be one of the sources of secreted GDF15 and that GDF15 diffuses to and can be detected in aqueous humor (AH). In validating these findings in human patients with glaucoma, we find not only that GDF15 is increased in AH of patients with primary open angle glaucoma (POAG), but also that elevated GDF15 levels are significantly associated with worse functional outcomes in glaucoma patients, as measured by visual field testing. Thus, GDF15 maybe a reliable metric of glaucomatous neurodegeneration, although further prospective validation studies will be necessary to determine if GDF15 can be used in clinical practice.
Keywords: Ophthalmology.
Conflict of interest statement
Figures
Similar articles
-
Increased Aqueous Humor GDF15 Is Associated with Worse Visual Field Loss in Pseudoexfoliative Glaucoma Patients.Transl Vis Sci Technol. 2020 Sep 15;9(10):16. doi: 10.1167/tvst.9.10.16. eCollection 2020 Sep. Transl Vis Sci Technol. 2020. PMID: 32983624 Free PMC article.
-
Longitudinal Growth Differentiation Factor 15 (GDF15) and Long-term Intraocular Pressure Fluctuation in Glaucoma: A Pilot Study.J Ophthalmic Vis Res. 2021 Jan 20;16(1):21-27. doi: 10.18502/jovr.v16i1.8245. eCollection 2021 Jan-Mar. J Ophthalmic Vis Res. 2021. PMID: 33520124 Free PMC article.
-
Monitoring Neurodegeneration in Glaucoma: Therapeutic Implications.Trends Mol Med. 2018 Jan;24(1):7-17. doi: 10.1016/j.molmed.2017.11.004. Epub 2017 Dec 7. Trends Mol Med. 2018. PMID: 29233479 Free PMC article. Review.
-
Elevated Levels of Growth/Differentiation Factor-15 in the Aqueous Humor and Serum of Glaucoma Patients.J Clin Med. 2022 Jan 29;11(3):744. doi: 10.3390/jcm11030744. J Clin Med. 2022. PMID: 35160195 Free PMC article.
-
[Aiming for zero blindness].Nippon Ganka Gakkai Zasshi. 2015 Mar;119(3):168-93; discussion 194. Nippon Ganka Gakkai Zasshi. 2015. PMID: 25854109 Review. Japanese.
Cited by
-
Season of Birth and Cardiovascular Mortality in Atrial Fibrillation: A Population-Based Cohort Study.J Cardiovasc Dev Dis. 2021 Dec 10;8(12):177. doi: 10.3390/jcdd8120177. J Cardiovasc Dev Dis. 2021. PMID: 34940532 Free PMC article.
-
Human Retinal Organoids Provide a Suitable Tool for Toxicological Investigations: A Comprehensive Validation Using Drugs and Compounds Affecting the Retina.Stem Cells Transl Med. 2022 Mar 17;11(2):159-177. doi: 10.1093/stcltm/szab010. Stem Cells Transl Med. 2022. PMID: 35298655 Free PMC article.
-
Plasma GDF-15 concentration is not elevated in open-angle glaucoma.PLoS One. 2021 May 28;16(5):e0252630. doi: 10.1371/journal.pone.0252630. eCollection 2021. PLoS One. 2021. PMID: 34048486 Free PMC article.
-
Heat Shock Protein Upregulation Supplemental to Complex mRNA Alterations in Autoimmune Glaucoma.Biomolecules. 2022 Oct 21;12(10):1538. doi: 10.3390/biom12101538. Biomolecules. 2022. PMID: 36291747 Free PMC article.
-
HDAC5 promotes optic nerve regeneration by activating the mTOR pathway.Exp Neurol. 2019 Jul;317:271-283. doi: 10.1016/j.expneurol.2019.03.011. Epub 2019 Mar 22. Exp Neurol. 2019. PMID: 30910408 Free PMC article.
References
Grants and funding
- R01 EY021515/EY/NEI NIH HHS/United States
- P30 EY002687/EY/NEI NIH HHS/United States
- T32 EY013360/EY/NEI NIH HHS/United States
- R01 EY019287/EY/NEI NIH HHS/United States
- P30 DK056341/DK/NIDDK NIH HHS/United States
- R01 DK104995/DK/NIDDK NIH HHS/United States
- T32 GM007200/GM/NIGMS NIH HHS/United States
- R01 DE022000/DE/NIDCR NIH HHS/United States
- UL1 TR000448/TR/NCATS NIH HHS/United States
- TL1 TR000449/TR/NCATS NIH HHS/United States
- KL2 TR000450/TR/NCATS NIH HHS/United States
- UL1 TR002345/TR/NCATS NIH HHS/United States
- R01 NS082446/NS/NINDS NIH HHS/United States
LinkOut - more resources
Full Text Sources
Other Literature Sources
