. 2017 May 4;2(9):e92102.
doi: 10.1172/jci.insight.92102.

Transcriptional dissection of melanoma identifies a high-risk subtype underlying TP53 family genes and epigenome deregulation

Affiliations

Transcriptional dissection of melanoma identifies a high-risk subtype underlying TP53 family genes and epigenome deregulation

Brateil Badal et al. JCI Insight. .

Abstract

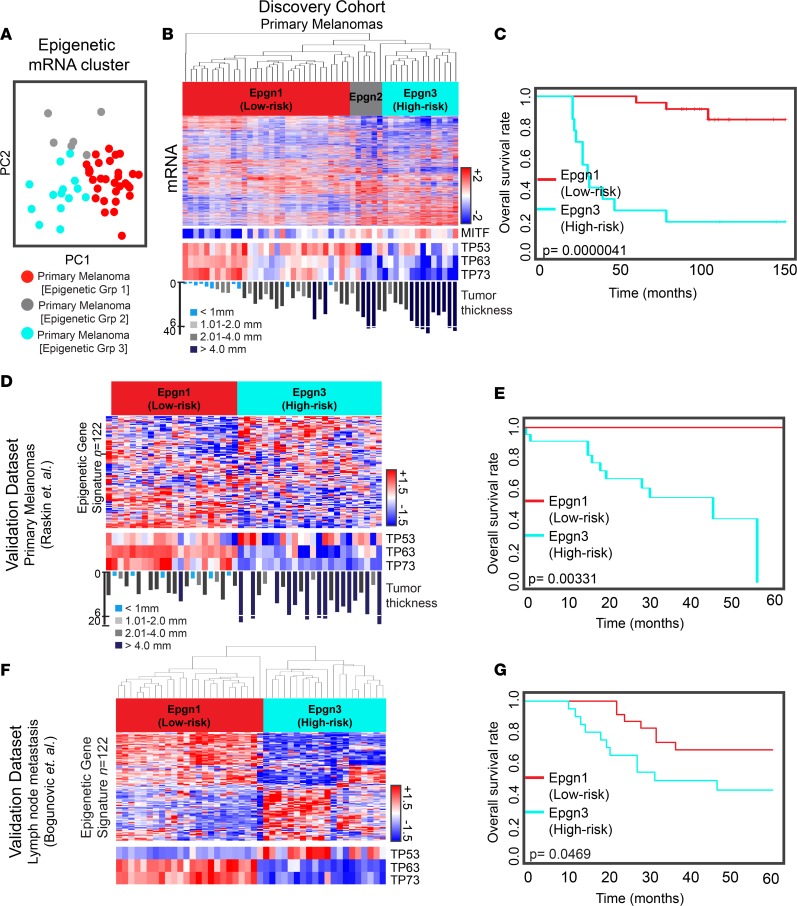
Background: Melanoma is a heterogeneous malignancy. We set out to identify the molecular underpinnings of high-risk melanomas, those that are likely to progress rapidly, metastasize, and result in poor outcomes.

Methods: We examined transcriptome changes from benign states to early-, intermediate-, and late-stage tumors using a set of 78 treatment-naive melanocytic tumors consisting of primary melanomas of the skin and benign melanocytic lesions. We utilized a next-generation sequencing platform that enabled a comprehensive analysis of protein-coding and -noncoding RNA transcripts.

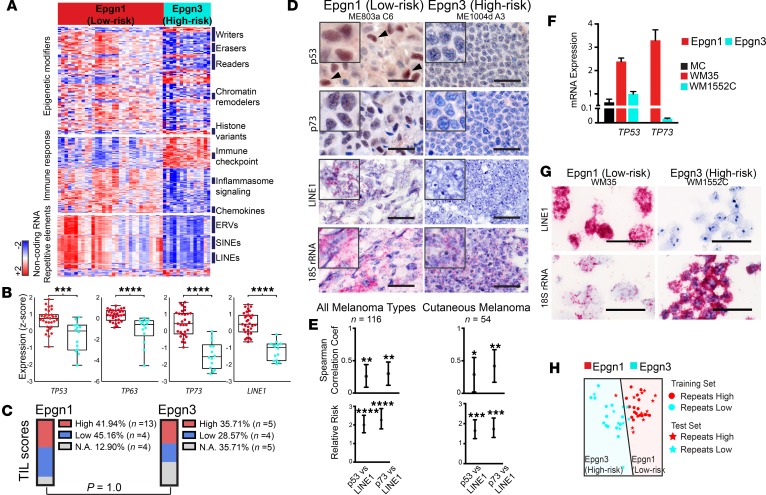
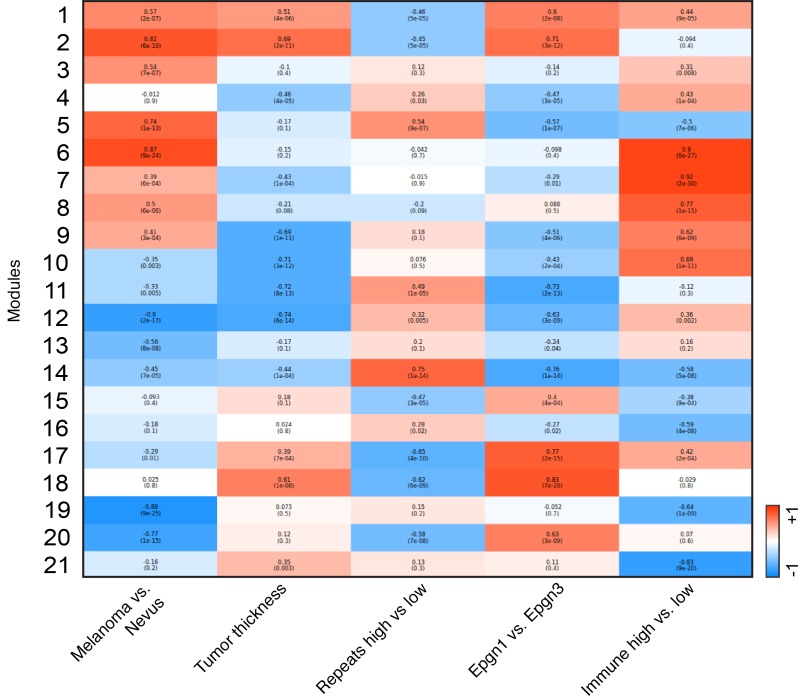
Results: Gene expression changes unequivocally discriminated between benign and malignant states, and a dual epigenetic and immune signature emerged defining this transition. To our knowledge, we discovered previously unrecognized melanoma subtypes. A high-risk primary melanoma subset was distinguished by a 122-epigenetic gene signature ("epigenetic" cluster) and TP53 family gene deregulation (TP53, TP63, and TP73). This subtype associated with poor overall survival and showed enrichment of cell cycle genes. Noncoding repetitive element transcripts (LINEs, SINEs, and ERVs) that can result in immunostimulatory signals recapitulating a state of "viral mimicry" were significantly repressed. The high-risk subtype and its poor predictive characteristics were validated in several independent cohorts. Additionally, primary melanomas distinguished by specific immune signatures ("immune" clusters) were identified.

Conclusion: The TP53 family of genes and genes regulating the epigenetic machinery demonstrate strong prognostic and biological relevance during progression of early disease. Gene expression profiling of protein-coding and -noncoding RNA transcripts may be a better predictor for disease course in melanoma. This study outlines the transcriptional interplay of the cancer cell's epigenome with the immune milieu with potential for future therapeutic targeting.

Funding: National Institutes of Health (CA154683, CA158557, CA177940, CA087497-13), Tisch Cancer Institute, Melanoma Research Foundation, the Dow Family Charitable Foundation, and the Icahn School of Medicine at Mount Sinai.

Keywords: Dermatology; Oncology.


Conflict of interest statement

Conflict of interest: The authors have declared that no conflict of interest exists.

Figures

Figure 1
Figure 1. Gene expression–based classification of primary melanomas and benign melanocytic nevi.
(A) Schematic diagram summarizing the study design. (B) Tumor thickness distribution of the primary melanoma cases of the discovery cohort (blue line) versus the primary melanomas of TCGA (yellow line). (C) The top bar indicates subtypes: nevus (light blue) and primary melanoma clusters (dark blue). In the heatmap, expression scores are median centered and clustered by complete linkage hierarchical clustering. Each row indicates a differentially expressed gene and each column represents a tumor sample. The heatmap is color coded on the basis of median-centered log2 gene expression levels. The bars at the bottom represent molecular parameters (nonsynonymous mutational load and BRAFV600E genotype) and clinical characteristics of the patient cohort using AJCC staging and classification for melanoma (age, gender, tumor thickness, ulceration, stage at diagnosis, and patient outcome at last follow-up). The variables are color coded as indicated. (D) Principal component analysis of the melanocytic tumors (nevus, light blue; primary melanoma, dark blue). (E) Gene expression classifier distinguishing nevus and primary melanoma groups.
Figure 2
Figure 2. Transcriptomic profiling identifies dysregulated epigenetic and immune response processes underlying melanoma initiation.
(A) Volcano plot showing differentially expressed genes between primary melanoma (n = 51) and nevus (n = 27) samples using cutoffs of Benjamini-Hochberg–corrected P ≤ 0.005 and a linear fold change ±1.5. Protein-coding mRNA with counts greater than 10 per million in at least 2 samples were considered. Downregulated (n = 2,350) and upregulated genes (n = 2,289) are indicated. (B) Top functional pathways disrupted between primary melanoma and nevus cases using the Database for Annotation, Visualization and Integrated Discovery (DAVID). (C) Examples of known oncogenic signaling pathways deregulated during malignant transformation. Heatmaps represent supervised hierarchical clustering of gene signatures that were differentially expressed between primary melanoma and nevus groups. Tumors are ordered based on the clusters identified and shown in Figure 1C (x axis), and genes are ordered according to functional categories (y axis). Examples are color coded as upregulated (pink) or downregulated (blue) in primary melanomas. (D) Tumor-infiltrating lymphocyte (TIL) scores on H&E examination of nevus versus melanoma samples (P < 0.0001, Fisher’s exact test). N.A., not available. (E) Heatmaps represent immune and inflammatory processes deregulated between primary melanomas and nevi. Immune cell lineage–specific transcript signatures, in particular TIL and myeloid cell populations involved in innate (dendritic cells, macrophages, NK cells, and neutrophils) and adaptive (B and T, Th1, Th2, CD8+ T cells) arms of the immune system, differentially expressed between benign and malignant categories. Several upregulated immune checkpoint molecules are highlighted. (F) The epigenetic gene signature that is differentially expressed between the primary melanoma and nevus groups is depicted. Genes encoding proteins that regulate chromatin structure are ordered on the y axis according to the functional groups: “writers” (histone acetyltransferase, histone methyltransferase, or protein arginine methyltransferase), “erasers” (histone deacetylase and histone demethylase), and “readers” (bromodomain, chromodomain, and Tudor domain–containing molecules), as well as DNA modifiers. For more detailed information, see the Methods.
Figure 3
Figure 3. “Epigenetic” transcriptomic clusters and TP53 family members identify a high-risk melanoma subtype.
(A) Principal component analysis of the discovery cohort. Colored circles indicate “epigenetic” (Epgn) primary melanoma subtypes (Epgn1, red; Epgn2, gray; and Epgn3, turquoise). (B) Unsupervised clustering of primary melanoma subtypes: Epgn1, Epgn2, and Epgn3. Heatmaps show differential expression of mRNA (top) and MITF, TP53, TP63, and TP73 (bottom). (C) Survival curves for Epgn1 and Epgn3 subgroups of the discovery cohort (P = 4.1e-06). (D) Validation of the Epgn1 and Epgn3 clusters utilizing the epigenetic gene signature (n = 122 genes) in an external data set of primary melanomas (n = 46) (Raskin et al., ref. 31). Expression levels of TP53, TP63, and TP73 (bottom) are indicated. (E) Survival curves for the Epgn1 and Epgn3 clusters of this data set (P = 3.31e-03) are depicted. (F) Validation of the Epgn1 and Epgn3 clusters in an external data set of melanoma metastases to the lymph nodes (n = 44) (Bogunovic et al., ref. 33). (G) Survival curves for the Epgn1 and Epgn3 clusters of this data set (P = 0.0469). Log-rank test was used for statistical analysis.
Figure 4
Figure 4. Noncoding repetitive element transcripts are repressed in high-risk melanomas.
(A) Heatmaps indicating differentially expressed protein-coding transcripts involved in epigenetic regulation and immune response between the Epgn1 and Epgn3 subtypes as well as noncoding repetitive element transcripts (retrotransposons). Tumors are ordered based on the clusters identified and shown in Figure 3B (x axis, Epgn1 and Epgn3), and genes are ordered according to functional categories or sequence homology in accordance with retrotransposon classification (y axis). ERV, endogenous retrovirus; SINE, short-interspersed nuclear element; LINE, long-interspersed nuclear element. (B) Box plots represent expression of TP53 family genes and LINE1 between the Epgn1 and Epgn3 groups (2-tailed Mann-Whitney test). (C) TIL scores on H&E examination of Epgn1 versus Epgn3 clusters (statistically not significant, 2-tailed Fisher’s exact test). N.A., not available. (D and E) Melanoma tissue arrays (n = 116) and those limited to primary cutaneous melanomas (n = 54) were assayed for p53 and p73 protein expression by immunohistochemistry and for LINE1 and 18S rRNA (housekeeping gene) transcripts by RNA in situ hybridization. Representative examples are depicted. Scale bar: 25 μm. Inset: 18 μm x 18 μm. Graphs show correlation coefficient and relative risk values for p53 versus LINE1 or p73 versus LINE1 expression (Spearman correlation). (F) Melanoma cell lines established from primary melanoma tumors (WM35, stage I and WM1552C, stage III) were obtained. TP53 and TP73 transcripts were examined by qPCR. Normal human primary melanocytes (MC) are shown as a reference (1-tailed Student’s t test). (G) Cell pellets were formalin-fixed and paraffin-embedded and assayed for endogenous elements (LINE1) by RNA in situ hybridization. 18S rRNA was employed as a housekeeping transcript. Representative examples are shown. Scale bar: 25 μm. (H) Gene expression classifier distinguishing low-risk Epgn1 and high-risk Epgn3 groups based on repetitive element expression.
Figure 5
Figure 5. Defining “immune” transcriptomic subclasses.
(A) Principal component analysis of two distinct primary melanoma subsets: immune “low” (n = 9) and immune “high” (n = 12). (B) TIL scores by H&E examination of immune “low” and “high” clusters (P = 0.035, Fisher’s exact test). N.A., not available. (C) Genes involved in Yap signaling (TEAD1, TEAD2, TEAD3, and TEAD4) and those involved in epigenetic processes are found to be differentially expressed between the immune “low” and “high” subgroups (2-tailed Mann-Whitney test). (D) Correlation matrix of differentially expressed genes with representative upregulated and downregulated immune genes across the primary melanoma samples of the discovery cohort (n = 51). Red indicates a positive correlation while blue indicates an anticorrelation. (E) Validation of the candidates (TEAD1 and LCMT1) was performed on an extension cohort of primary melanoma samples (n = 49) using qPCR. *P < 0.05, 2-tailed Student’s t test. The bar graph shows samples that were classified as either immune “low” or “high.”
Figure 6
Figure 6. Summary of the findings via coexpression network modeling.
Coexpression network analysis was built across tumor subtypes and biologically relevant variables (tumor thickness).

Similar articles

Cited by

References

    1. Shain AH, et al. The genetic evolution of melanoma from precursor lesions. N Engl J Med. 2015;373(20):1926–1936. doi: 10.1056/NEJMoa1502583. - DOI - PubMed
    1. Balch CM, et al. Final version of 2009 AJCC melanoma staging and classification. J Clin Oncol. 2009;27(36):6199–6206. doi: 10.1200/JCO.2009.23.4799. - DOI - PMC - PubMed
    1. Siegel RL, Miller KD, Jemal A. Cancer Statistics, 2017. CA Cancer J Clin. 2017;67(1):7–30. doi: 10.3322/caac.21387. - DOI - PubMed
    1. Han D, et al. Clinicopathologic predictors of sentinel lymph node metastasis in thin melanoma. J Clin Oncol. 2013;31(35):4387–4393. doi: 10.1200/JCO.2013.50.1114. - DOI - PubMed
    1. Dickson PV, Gershenwald JE. Staging and prognosis of cutaneous melanoma. Surg Oncol Clin N Am. 2011;20(1):1–17. doi: 10.1016/j.soc.2010.09.007. - DOI - PMC - PubMed