. 2017 May 3;7(1):1376.
doi: 10.1038/s41598-017-01299-x.

Serum MicroRNAs Reflect Injury Severity in a Large Animal Model of Thoracic Spinal Cord Injury

Affiliations

Serum MicroRNAs Reflect Injury Severity in a Large Animal Model of Thoracic Spinal Cord Injury

Seth Tigchelaar et al. Sci Rep. .

Abstract

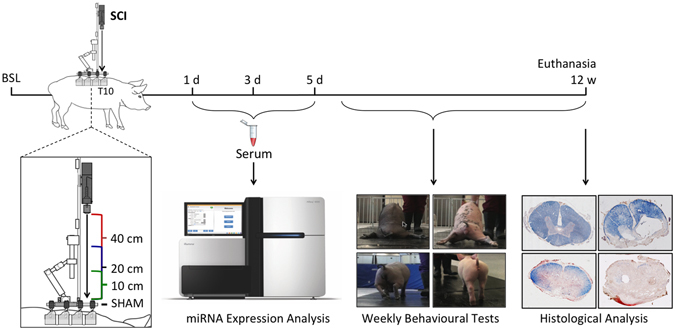
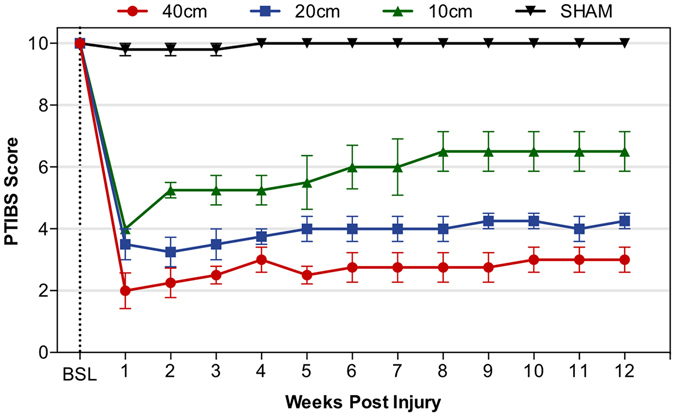
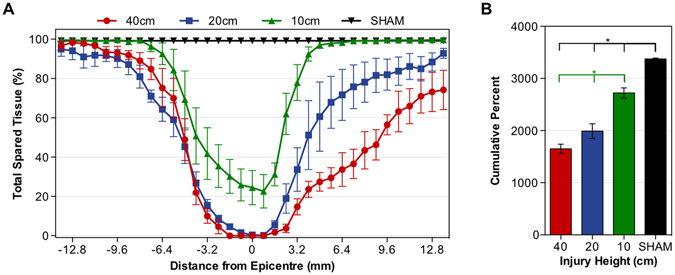
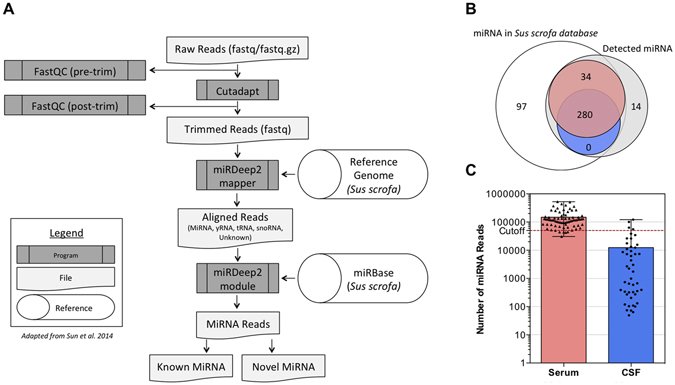
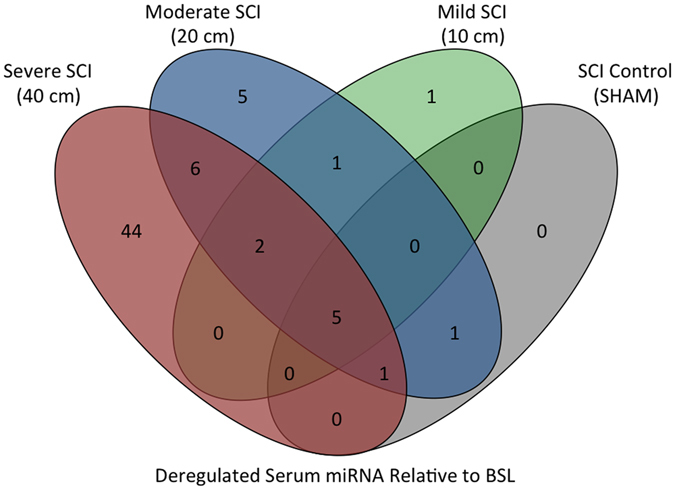
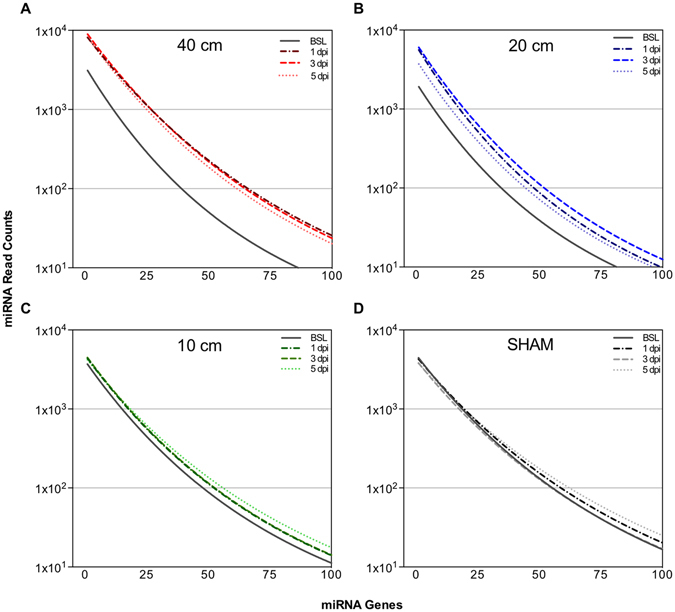
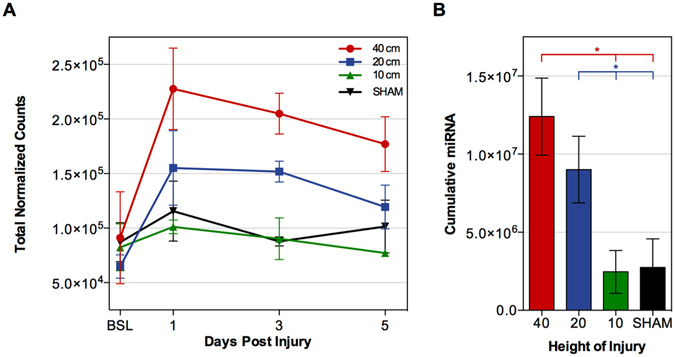
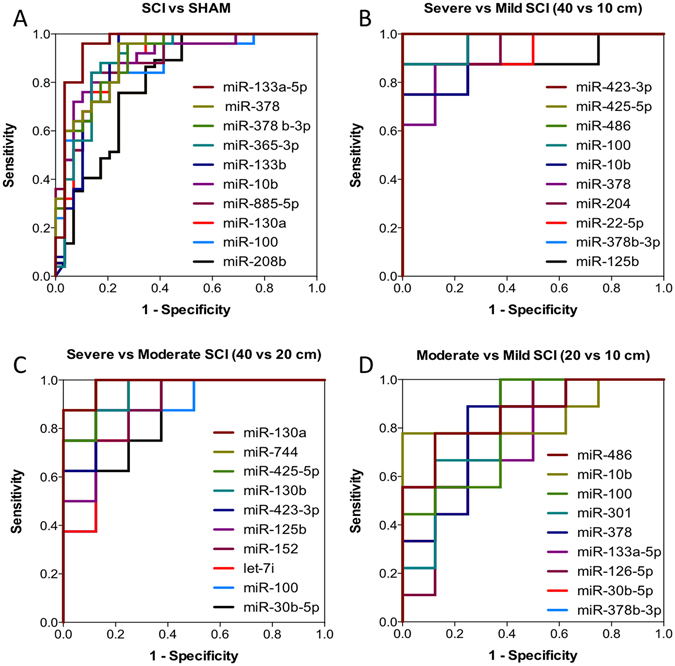
Therapeutic development for spinal cord injury is hindered by the difficulty in conducting clinical trials, which to date have relied solely on functional outcome measures for patient enrollment, stratification, and evaluation. Biological biomarkers that accurately classify injury severity and predict neurologic outcome would represent a paradigm shift in the way spinal cord injury clinical trials could be conducted. MicroRNAs have emerged as attractive biomarker candidates due to their stability in biological fluids, their phylogenetic similarities, and their tissue specificity. Here we characterized a porcine model of spinal cord injury using a combined behavioural, histological, and molecular approach. We performed next-generation sequencing on microRNAs in serum samples collected before injury and then at 1, 3, and 5 days post injury. We identified 58, 21, 9, and 7 altered miRNA after severe, moderate, and mild spinal cord injury, and SHAM surgery, respectively. These data were combined with behavioural and histological analysis. Overall miRNA expression at 1 and 3 days post injury strongly correlates with outcome measures at 12 weeks post injury. The data presented here indicate that serum miRNAs are promising candidates as biomarkers for the evaluation of injury severity for spinal cord injury or other forms of traumatic, acute, neurologic injury.


Conflict of interest statement

The authors declare that they have no competing interests.

Figures

Figure 1
Figure 1
Study Outline. Miniature Yucatan pigs received either SHAM laminectomy (black), or a contusion spinal cord injury using a weight dropped from 40 (red), 20 (blue), or 10 cm (green), followed by 5 minutes of compression. For miRNA expression profiling, CSF and serum samples were collected before injury (baseline (BSL)) and at 1, 3, and 5 days post injury (dpi). Functional recovery was assessed weekly for 12 weeks using Porcine Thoracic Injury Behaviour Scale (PTIBS). At 12 weeks post-injury, animals were euthanized and the spinal cord processed for spared white and gray matter quantification.
Figure 2
Figure 2
Effect of injury severity on locomotor recovery after spinal cord injury. Porcine Thoracic Injury Behaviour Scale (PTIBS) scores were measured before injury (baseline (BSL)) and weekly for 12 weeks post injury for the 40 (red), 20 (blue), 10 cm (green), and SHAM (black) groups. Datapoints represent mean ± SEM for n = 4 animals per group (see Table 1).
Figure 3
Figure 3
Effect of injury severity on tissue sparing 12 weeks after spinal cord injury. Spared tissue was measured using Eriochrome Cyanine stained sections from 13.6 mm rostral and 13.6 mm caudal to the site of injury. (A) The total spared tissue in percent, relative to the entire area of the spinal cord of the same section was calculated for the 40 (red), 20 (blue), 10 cm (green), and SHAM (black) groups. (B) The total amount of tissue sparing (cumulative percent) was calculated using the area under the curve of total spared tissue (%) for the 40 (red), 20 (blue), 10 cm (green), and SHAM (black) groups. Asterisks indicate sparing for which significant differences were found between groups with ANOVA. Data is presented as means ± SEM for n = 4 animals per group. SCI, spinal cord injury.
Figure 4
Figure 4
(A) Bioinformatic Pipeline. Raw reads were assessed for quality using FastQC before and after adapter trimming with the Cutadapt package. Trimmed reads were mapped to the pig (Sus scrofa) reference genome using the miRDeep2 mapper. Aligned reads were then mapped to the miRBase miRNA database using the miRDeep2 module. MiRDeep2 gives a matrix list of known and novel miRNA. (B) Detected miRNA. 314 out of the total 411 known Sus scrofa miRNA (white) were identified across all serum (red, 314 miRNA) and CSF (blue, 280 miRNA) samples, while 14 novel miRNA (grey) that do not yet exist in the Sus scrofa miRNA database were identified. (C) Number of miRNA reads for all samples. 60 serum samples (red) had over the cutoff of 50,000 miRNA reads, only 4 CSF (blue) samples had above 50,000 reads, and 11 CSF samples had over 10,000 miRNA reads.
Figure 5
Figure 5
Venn diagram showing numbers of deregulated serum miRNA after severe (40 cm, red), moderate (20 cm, blue), mild (10 cm, green) injury, or SHAM surgery (Non-CNS Injury control, black). Deregulated miRNA were determined by multiple t-tests, while adjusting the p-value using the Benjamini-Hochberg method.
Figure 6
Figure 6
Effect of Injury Severity on Global miRNA Expression. Smoothed lines showing the trend in global miRNA expression at BSL (solid lines), and at 1, 3, and 5 dpi (dashed lines) in each of the (A) 40 cm, (B) 20 cm, (C) 10 cm, and (D) SHAM groups. Datapoints represent the smoothed read counts for the top 100 miRNA genes for n = 4 animals per group and time point (see Table 1).
Figure 7
Figure 7
Effect of Injury Severity on total Systemic miRNA. (A) The total number of normalized miRNA counts in the 40 cm (red), 20 cm (blue), 10 cm (green), and SHAM (black) groups. Data points represent the average of the normalized total miRNA reads for n = 4 animals per group and time point (see Table 1). (B) The cumulative miRNA expression over time in the 40 cm (red), 20 cm (blue), 10 cm (green), and SHAM (black) groups. Asterisks indicate significant differences determined by ANOVA. Data is presented as means ± SEM.
Figure 8
Figure 8
The diagnostic accuracy of significantly deregulated serum miRNAs for SCI severity. Accuracy was assessed using the ROC Curve of the 10 miRNA with the highest diagnostic accuracy (AUC) and smallest p-value, at 1 and 3 dpi, to distinguish between (A). SCI and SHAM (non-CNS injury control), the AUC’s were miR-133a-5p (AUC = 0.95), miR-378 (AUC = 0.91), miR-378b-3p (AUC = 0.90), miR-365-3p (AUC = 0.89), miR-133b (AUC = 0.89), miR-10b (AUC = 0.88), miR-885-5p (AUC = 0.88), miR-130a (AUC = 0.88), miR-100 (AUC = 0.88), and miR-208b (AUC = 0.87) (B). Severe and mild SCI (40 vs 10 cm), the AUC’s were miR-423-3p (AUC = 1.00), miR-425-5p (AUC = 1.00), miR-486 (AUC = 1.00), miR-100 (AUC = 0.97), miR-10b (AUC = 0.94), miR-378 (AUC = 0.94), miR-204 (AUC = 0.92), miR-22-5p (AUC = 0.92), miR-378b-3p (AUC = 0.92), and miR-125b (AUC = 0.91) (C). Severe and Moderate SCI (40 vs 20 cm), the AUC’s were miR-130a (AUC = 0.98), miR-744 (AUC = 0.98), miR-425-5p (AUC = 0.97), miR-130b (AUC = 0.95), miR-423-3p (AUC = 0.95), miR-125b (AUC = 0.92), miR-152 (AUC = 0.92), let-7i (AUC = 0.89,), miR-100 (AUC = 0.88), and miR-30b-5p (AUC = 0.88) (D). Moderate and Mild SCI (20 vs 10 cm), the AUC’s were miR-486 (AUC = 0.86,), miR-10b (AUC = 0.85), miR-100 (AUC = 0.82), miR-301 (AUC = 0.82), miR-378 (AUC = 0.81), miR-133a-5p (AUC = 0.79), miR-126-5p (AUC = 0.79), miR-30b-5p (AUC = 0.79), and miR-378b-3p (AUC = 0.79).

References

    1. National spinal cord injury statistical center Spinal cord injury facts and figures at a glance. J Spinal Cord Med. 2014;37(2):243–4. - PMC - PubMed
    1. Geisler FH, et al. The sygen multicenter acute spinal cord injury study. Spine (Phila Pa 1976) 2001;26(24 Suppl):S87–98. doi: 10.1097/00007632-200112151-00015. - DOI - PubMed
    1. Bracken MB, et al. Administration of methylprednisolone for 24 or 48 hours or tirilazad mesylate for 48 hours in the treatment of acute spinal cord injury. Results of the third national acute spinal cord injury randomized controlled trial. National acute spinal cord injury study. JAMA. 1997;277(20):1597–604. doi: 10.1001/jama.1997.03540440031029. - DOI - PubMed
    1. Bracken MB, et al. Efficacy of methylprednisolone in acute spinal cord injury. JAMA. 1984;251(1):45–52. doi: 10.1001/jama.1984.03340250025015. - DOI - PubMed
    1. Bracken MB, et al. A randomized, controlled trial of methylprednisolone or naloxone in the treatment of acute spinal-cord injury. Results of the second national acute spinal cord injury study. N Engl J Med. 1990;322(20):1405–11. doi: 10.1056/NEJM199005173222001. - DOI - PubMed

Publication types