

Optical visualisation of thermogenesis in stimulated single-cell brown adipocytes
- PMID: 28469146
- PMCID: PMC5431191
- DOI: 10.1038/s41598-017-00291-9
Optical visualisation of thermogenesis in stimulated single-cell brown adipocytes
Abstract
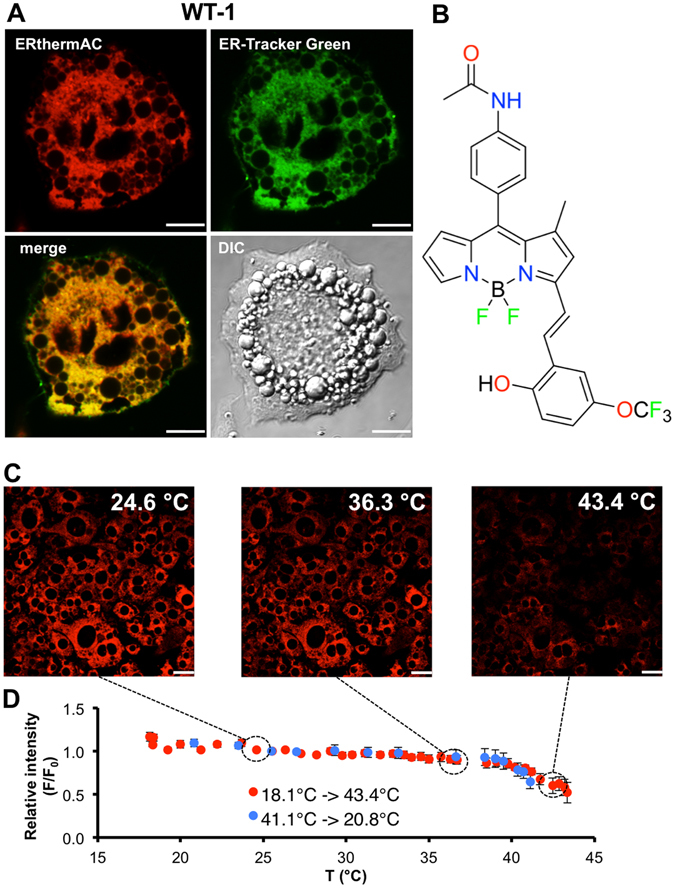
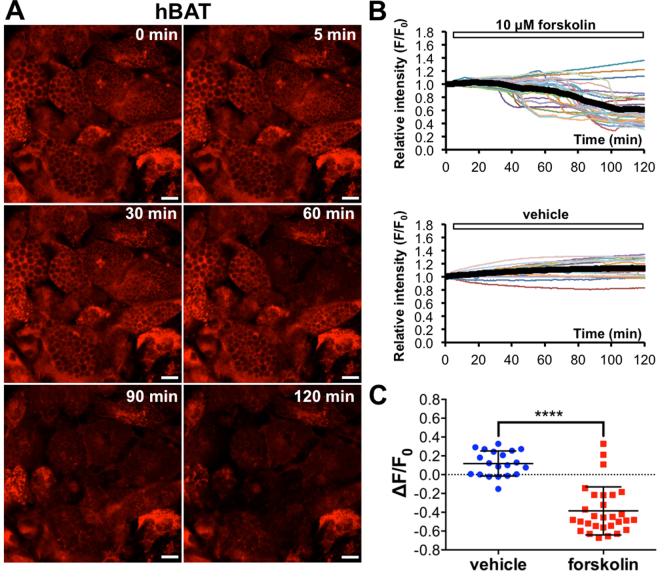
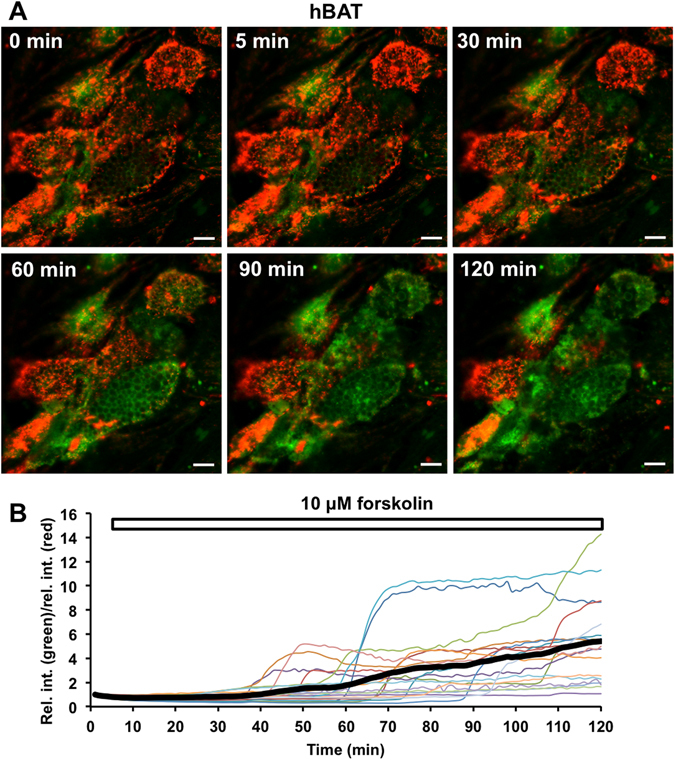
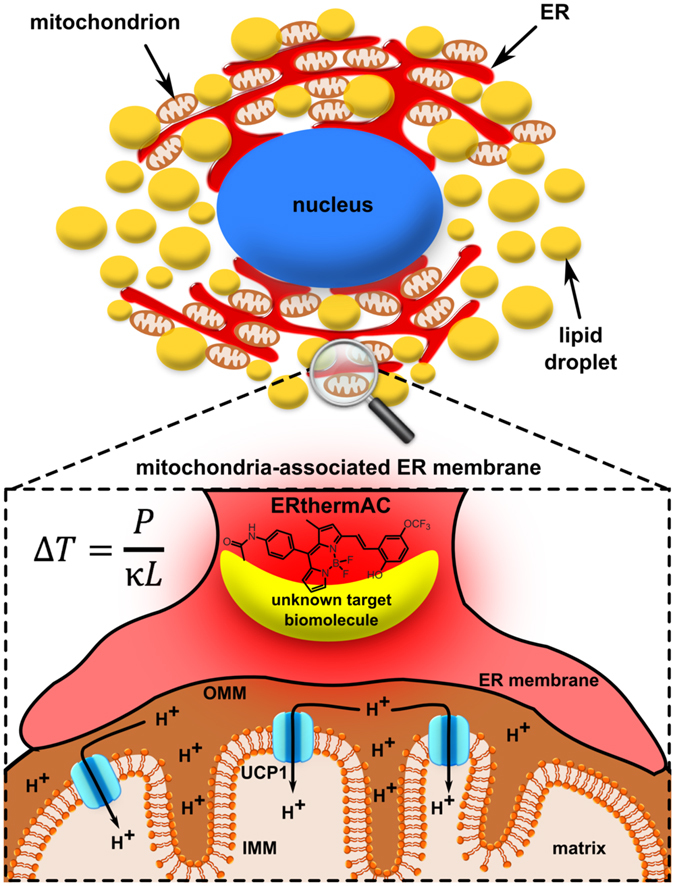
The identification of brown adipose deposits in adults has led to significant interest in targeting this metabolically active tissue for treatment of obesity and diabetes. Improved methods for the direct measurement of heat production as the signature function of brown adipocytes (BAs), particularly at the single cell level, would be of substantial benefit to these ongoing efforts. Here, we report the first application of a small molecule-type thermosensitive fluorescent dye, ERthermAC, to monitor thermogenesis in BAs derived from murine brown fat precursors and in human brown fat cells differentiated from human neck brown preadipocytes. ERthermAC accumulated in the endoplasmic reticulum of BAs and displayed a marked change in fluorescence intensity in response to adrenergic stimulation of cells, which corresponded to temperature change. ERthermAC fluorescence intensity profiles were congruent with mitochondrial depolarisation events visualised by the JC-1 probe. Moreover, the averaged fluorescence intensity changes across a population of cells correlated well with dynamic changes such as thermal power, oxygen consumption, and extracellular acidification rates. These findings suggest ERthermAC as a promising new tool for studying thermogenic function in brown adipocytes of both murine and human origins.
Conflict of interest statement
The authors declare that they have no competing interests.
Figures


Similar articles
-
Ca2+-associated triphasic pH changes in mitochondria during brown adipocyte activation.Mol Metab. 2017 May 31;6(8):797-808. doi: 10.1016/j.molmet.2017.05.013. eCollection 2017 Aug. Mol Metab. 2017. PMID: 28752044 Free PMC article.
-
Origins and early development of the concept that brown adipose tissue thermogenesis is linked to energy balance and obesity.Biochimie. 2017 Mar;134:62-70. doi: 10.1016/j.biochi.2016.09.007. Epub 2016 Sep 10. Biochimie. 2017. PMID: 27621146 Review.
-
Capsinoids and related food ingredients activating brown fat thermogenesis and reducing body fat in humans.Curr Opin Lipidol. 2013 Feb;24(1):71-7. doi: 10.1097/MOL.0b013e32835a4f40. Curr Opin Lipidol. 2013. PMID: 23298960 Review.
-
An OLTAM system for analysis of brown/beige fat thermogenic activity.Int J Obes (Lond). 2018 Apr;42(4):939-945. doi: 10.1038/ijo.2017.308. Epub 2018 Jan 23. Int J Obes (Lond). 2018. PMID: 29359735 Free PMC article.
-
β₁-Adrenergic receptors increase UCP1 in human MADS brown adipocytes and rescue cold-acclimated β₃-adrenergic receptor-knockout mice via nonshivering thermogenesis.Am J Physiol Endocrinol Metab. 2011 Dec;301(6):E1108-18. doi: 10.1152/ajpendo.00085.2011. Epub 2011 Aug 30. Am J Physiol Endocrinol Metab. 2011. PMID: 21878665
Cited by
-
Mitochondrial Thermogenesis Can Trigger Heat Shock Response in the Nucleus.ACS Cent Sci. 2024 Jun 3;10(6):1231-1241. doi: 10.1021/acscentsci.3c01589. eCollection 2024 Jun 26. ACS Cent Sci. 2024. PMID: 38947196 Free PMC article.
-
Characterization of transcript enrichment and detection bias in single-nucleus RNA-seq for mapping of distinct human adipocyte lineages.Genome Res. 2022 Feb;32(2):242-257. doi: 10.1101/gr.275509.121. Epub 2022 Jan 18. Genome Res. 2022. PMID: 35042723 Free PMC article.
-
CRISPR-engineered human brown-like adipocytes prevent diet-induced obesity and ameliorate metabolic syndrome in mice.Sci Transl Med. 2020 Aug 26;12(558):eaaz8664. doi: 10.1126/scitranslmed.aaz8664. Sci Transl Med. 2020. PMID: 32848096 Free PMC article.
-
Mice with R2509C-RYR1 mutation exhibit dysfunctional Ca2+ dynamics in primary skeletal myocytes.J Gen Physiol. 2022 Nov 7;154(11):e202213136. doi: 10.1085/jgp.202213136. Epub 2022 Oct 6. J Gen Physiol. 2022. PMID: 36200983 Free PMC article.
-
SERPINA3C ameliorates adipose tissue inflammation through the Cathepsin G/Integrin/AKT pathway.Mol Metab. 2022 Jul;61:101500. doi: 10.1016/j.molmet.2022.101500. Epub 2022 Apr 15. Mol Metab. 2022. PMID: 35436587 Free PMC article.
References
-
- Jansky, L. Shivering in Physiology and Pathophysiology of Temperature Regulation (ed. Blatteis, C.) 47–59 (World Scientific, Singapore, 1998).
-
- Himms-Hagen J. Nonshivering thermogenesis. Brain Res. 1984;12:151–160. - PubMed
Publication types
MeSH terms
Substances
Grants and funding
LinkOut - more resources
Full Text Sources
Other Literature Sources
Research Materials
