. 2017 May 3;7(1):1445.
doi: 10.1038/s41598-017-01387-y.

Impaired renal function and dysbiosis of gut microbiota contribute to increased trimethylamine-N-oxide in chronic kidney disease patients

Affiliations

Impaired renal function and dysbiosis of gut microbiota contribute to increased trimethylamine-N-oxide in chronic kidney disease patients

Kai-Yu Xu et al. Sci Rep. .

Abstract

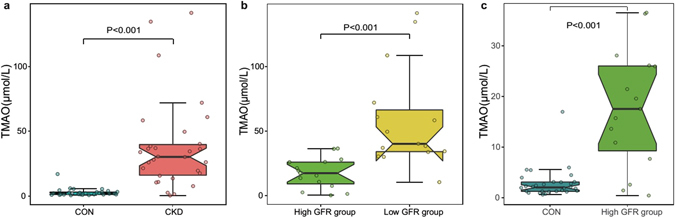
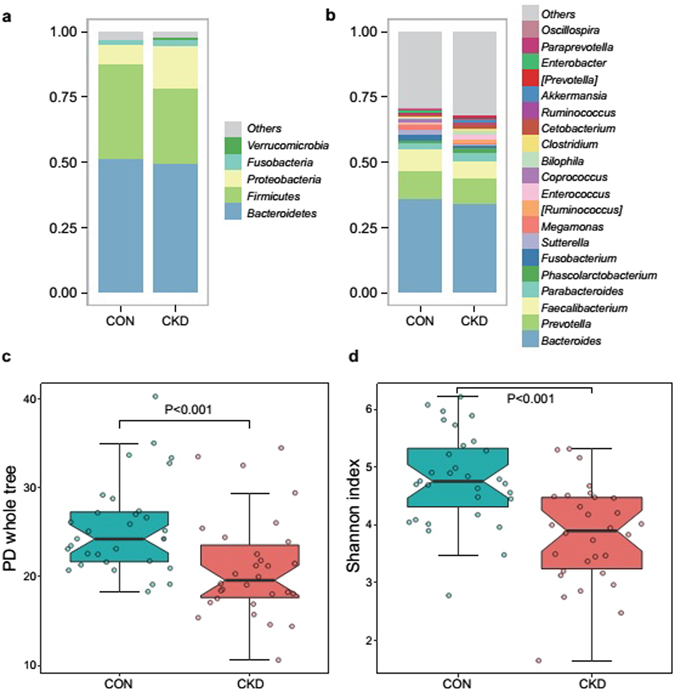
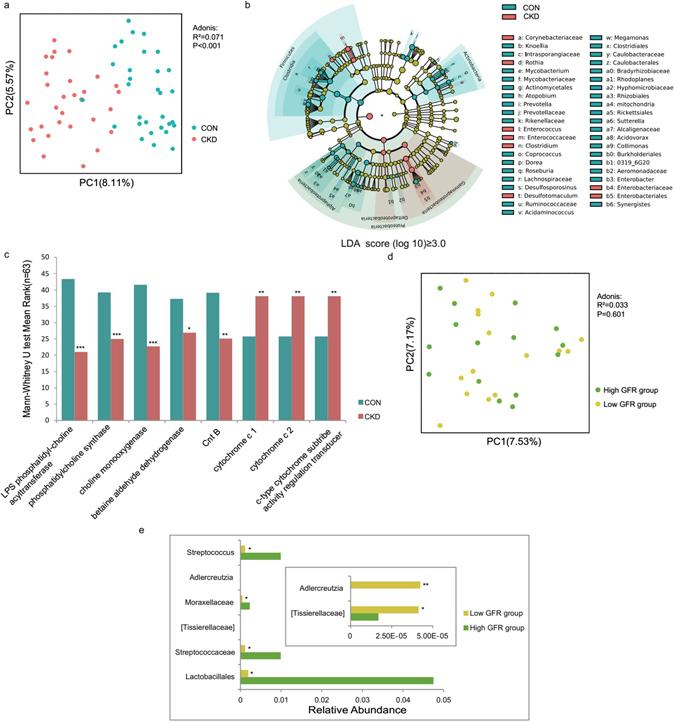
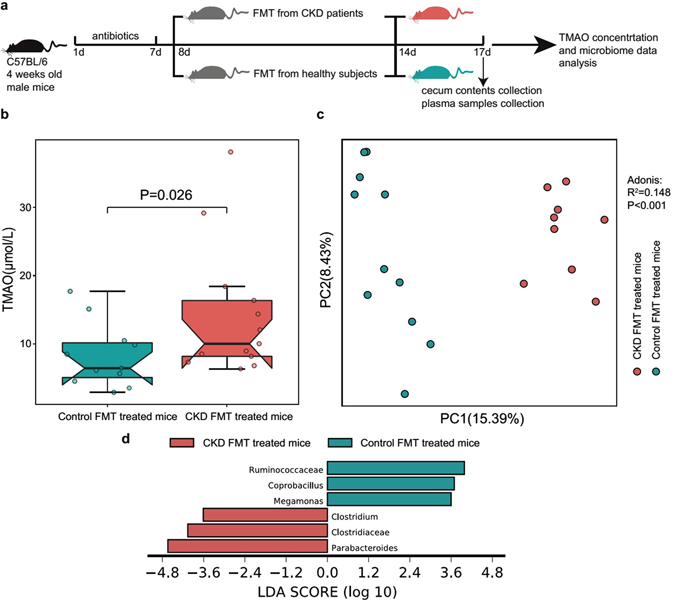
Chronic kidney disease (CKD) patients have an increased risk of cardiovascular diseases (CVDs). The present study aimed to investigate the gut microbiota and blood trimethylamine-N-oxide concentration (TMAO) in Chinese CKD patients and explore the underlying explanations through the animal experiment. The median plasma TMAO level was 30.33 μmol/L in the CKD patients, which was significantly higher than the 2.08 μmol/L concentration measured in the healthy controls. Next-generation sequence revealed obvious dysbiosis of the gut microbiome in CKD patients, with reduced bacterial diversity and biased community constitutions. CKD patients had higher percentages of opportunistic pathogens from gamma-Proteobacteria and reduced percentages of beneficial microbes, such as Roseburia, Coprococcus, and Ruminococcaceae. The PICRUSt analysis demonstrated that eight genes involved in choline, betaine, L-carnitine and trimethylamine (TMA) metabolism were changed in the CKD patients. Moreover, we transferred faecal samples from CKD patients and healthy controls into antibiotic-treated C57BL/6 mice and found that the mice that received gut microbes from the CKD patients had significantly higher plasma TMAO levels and different composition of gut microbiota than did the comparative mouse group. Our present study demonstrated that CKD patients had increased plasma TMAO levels due to contributions from both impaired renal functions and dysbiosis of the gut microbiota.


Conflict of interest statement

The authors declare that they have no competing interests.

Figures

Figure 1
Figure 1
CKD patients showed significantly elevated plasma TMAO concentrations. (a) Comparison of plasma TMAO levels between the CKD patient group and the control group. (b) Comparison of plasma TMAO levels between the high GFR group (GFR ≥ 7 ml/min/1.73 m2) and the low GFR group (GFR < 7 ml/min/1.73 m2). (c) Comparison of plasma TMAO levels between the high GFR group (GFR ≥ 7 ml/min/1.73 m2) and the control group. TMAO, trimethylamine N-oxide; CKD, chronic kidney disease; GFR, glomerular filtration rate. The results are based on a Mann-Whitney U test of the TMAO concentrations.
Figure 2
Figure 2
The healthy controls exhibited significantly greater bacterial diversity than the patients. The data represent the comparison of gut bacterial profiles between the healthy controls and CKD patients, including 31 healthy controls (blue) and 30 CKD patients (red). (a,b) Average relative abundances of the predominant bacterial taxa at the phylum level and the genus level in the CKD patient and control samples. (c,d) Comparison of α-diversity between the gut microbiota of the CKD patients and controls. We used two indices to represent the α-diversity (the Shannon index and the PD whole tree). PD indicates phylogenetic diversity. The Wilcoxon rank sum test was used to determine significance in α-diversity.
Figure 3
Figure 3
CKD patients showed obvious dysbiosis of the gut microbiome. The data represent the comparison of the gut bacterial profiles between the CKD patients and the healthy controls, including 31 healthy controls (blue) and 30 CKD patients (red). (a) Principal coordinate analysis illustrating the grouping patterns of the CKD patient group and the control group based on the unweighted UniFrac distances. Each closed circle represents a sample. Distances between any pair of samples represent their dissimilarities. (b) Significantly discriminative taxa between the patients and controls were determined using Linear Discriminant Analysis Effect Size (LEfSe). Only taxa meeting the LDA significance thresholds (>3) are shown. Different coloured regions represent different groups. From the interior to the exterior, each layer represents the phylum, class, order, family, and genus level. (c) Prediction of gene functions between the CKD patients and the controls. Different coloured bar charts represent different groups. (d) Comparison of gut bacterial profiles between two CKD patient subgroups: the high GFR group (GFR ≥ 7 ml/min/1.73 m2) and the low GFR group (GFR < 7 ml/min/1.73 m2). Principal coordinate analysis illustrating the grouping patterns of the CKD patients based on the unweighted UniFrac distances. The data represent 15 GFR high patients (green) and 15 GFR low patients (yellow). Each closed circle represents a sample. (e) Comparison of raw gut mcirobiome data between two CKD patient subgroups. Different coloured bar charts represent different groups. The Mann-Whitney U test was used to determine significance between groups. *P < 0.05; **P < 0.01; ***P < 0.001.
Figure 4
Figure 4
Transplantation of the CKD patient microbiota induces an increased TMAO level and dysbiosis of the gut microbiota in antibiotic-treated mice. The data represent 12 mice transplanted with healthy control faecal samples (blue) and 13 mice transplanted with CKD patient faecal samples (red). (a) Experimental design of the faecal microbiota transplantation (FMT) in antibiotic-treated mice. (b) Comparison of the plasma TMAO levels between the groups of mice after transplant with pooled faecal samples from the CKD patients and healthy controls. The Mann-Whitney U test was used to determine significance between groups. (c) Principal coordinate analysis illustrating the grouping patterns of the two groups of mice based on the unweighted UniFrac distances. Each open circle represents a sample. Distances between any pair of samples represent their dissimilarities. (d) Significantly discriminative taxa between the two group of mice were determined using Linear Discriminant Analysis Effect Size (LEfSe). Only taxa meeting the LDA significance thresholds (>3) are shown. Different coloured bars represent different groups.

Similar articles

Cited by

References

    1. Eckardt KU, et al. Evolving importance of kidney disease: from subspecialty to global health burden. Lancet. 2013;382:158–69. doi: 10.1016/S0140-6736(13)60439-0. - DOI - PubMed
    1. Liu M, et al. Cardiovascular disease and its relationship with chronic kidney disease. Eur Rev Med Pharmacol Sci. 2014;18:2918–26. - PubMed
    1. Segall L, Nistor I, Covic A. Heart failure in patients with chronic kidney disease: a systematic integrative review. Biomed Res Int. 2014;2014:937398–21. doi: 10.1155/2014/937398. - DOI - PMC - PubMed
    1. Hou FF. Cardiovascular risk in Chinese patients with chronic kidney diseases: where do we stand? Chin Med J (Engl) 2005;118:883–6. - PubMed
    1. Alani H, Tamimi A, Tamimi N. Cardiovascular co-morbidity in chronic kidney disease: Current knowledge and future research needs. World J Nephrol. 2014;3:156–68. doi: 10.5527/wjn.v3.i4.156. - DOI - PMC - PubMed

Publication types

MeSH terms