

Volcanic influence on centennial to millennial Holocene Greenland temperature change
- PMID: 28469185
- PMCID: PMC5431187
- DOI: 10.1038/s41598-017-01451-7
Volcanic influence on centennial to millennial Holocene Greenland temperature change
Erratum in
-
Author Correction: Volcanic influence on centennial to millennial Holocene Greenland temperature change.Sci Rep. 2018 Mar 6;8(1):4292. doi: 10.1038/s41598-018-21307-y. Sci Rep. 2018. PMID: 29511245 Free PMC article.
Abstract
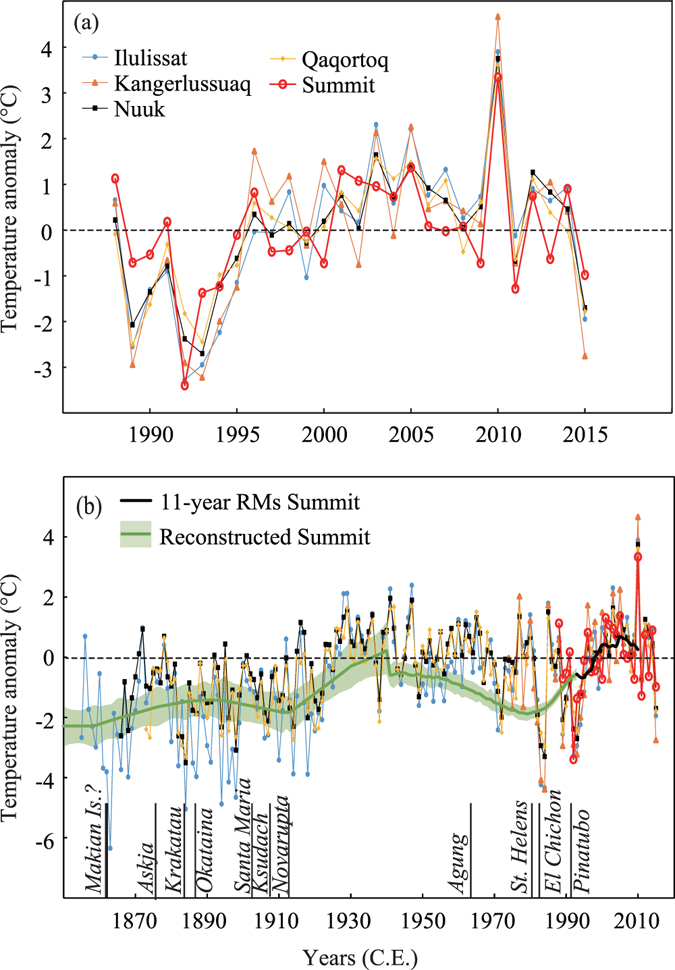
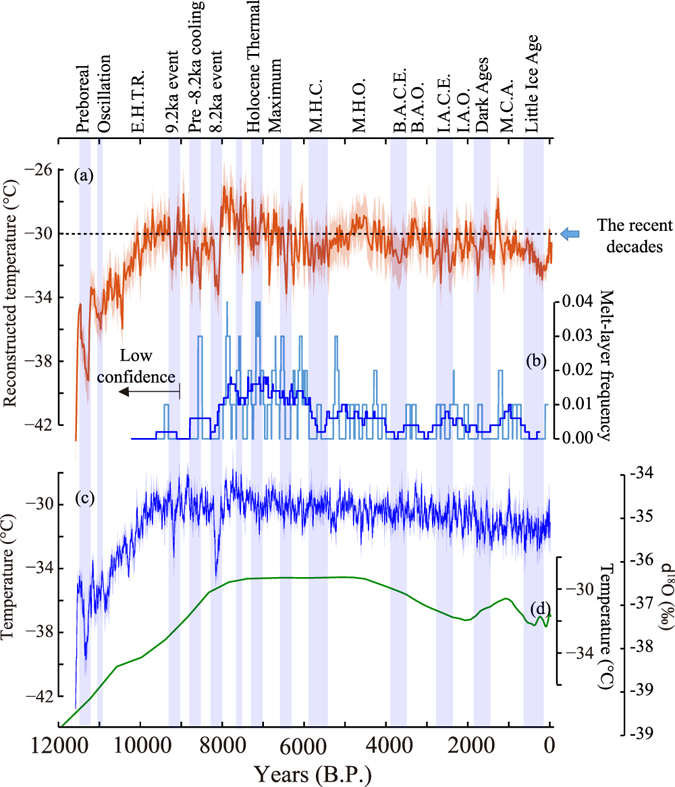
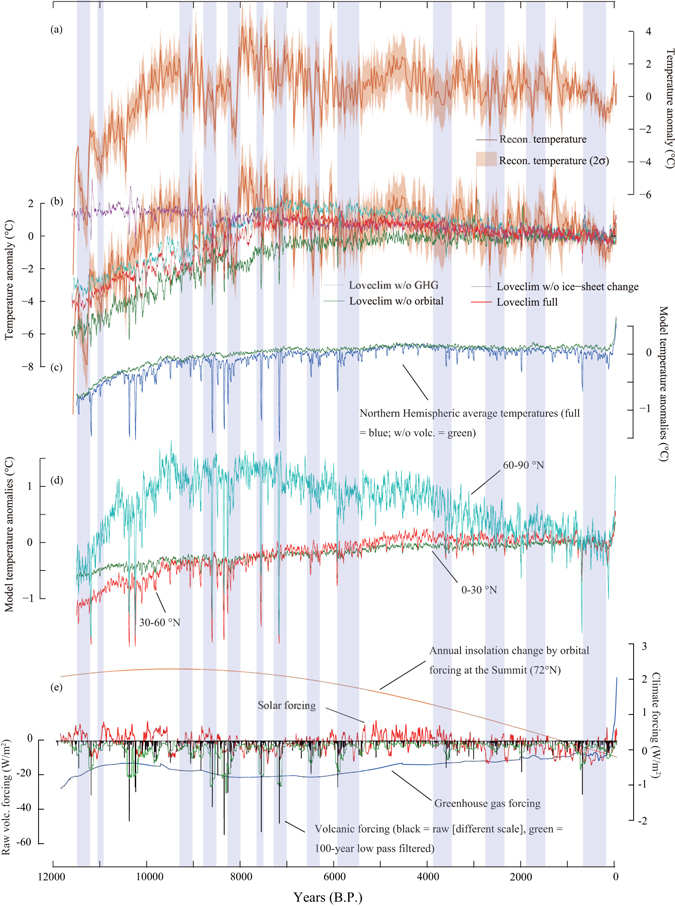
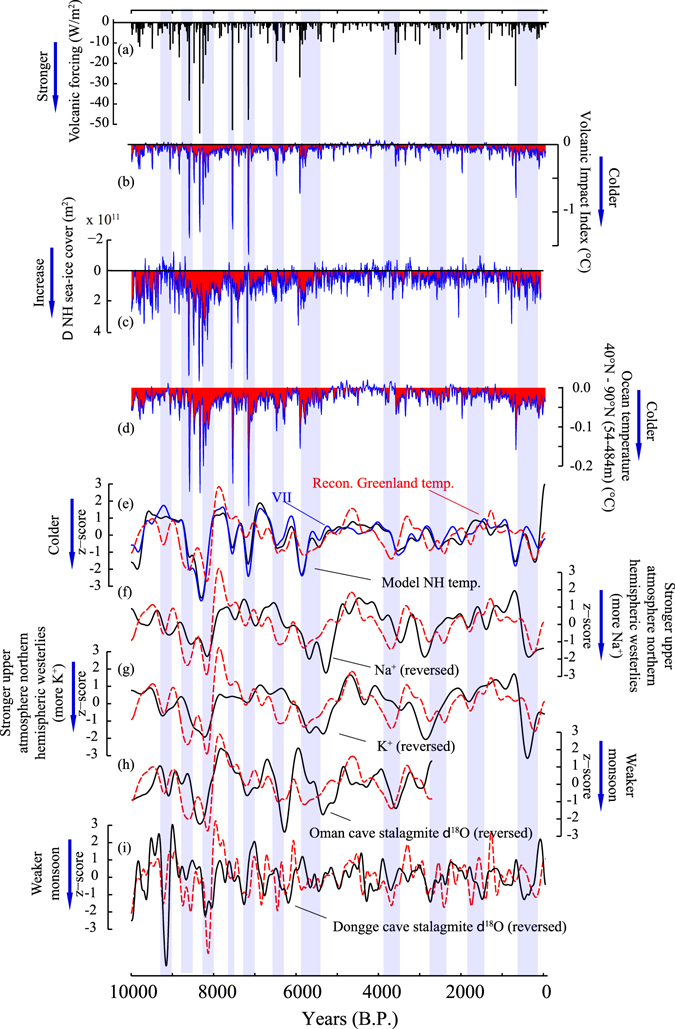
Solar variability has been hypothesized to be a major driver of North Atlantic millennial-scale climate variations through the Holocene along with orbitally induced insolation change. However, another important climate driver, volcanic forcing has generally been underestimated prior to the past 2,500 years partly owing to the lack of proper proxy temperature records. Here, we reconstruct seasonally unbiased and physically constrained Greenland Summit temperatures over the Holocene using argon and nitrogen isotopes within trapped air in a Greenland ice core (GISP2). We show that a series of volcanic eruptions through the Holocene played an important role in driving centennial to millennial-scale temperature changes in Greenland. The reconstructed Greenland temperature exhibits significant millennial correlations with K+ and Na+ ions in the GISP2 ice core (proxies for atmospheric circulation patterns), and δ18O of Oman and Chinese Dongge cave stalagmites (proxies for monsoon activity), indicating that the reconstructed temperature contains hemispheric signals. Climate model simulations forced with the volcanic forcing further suggest that a series of large volcanic eruptions induced hemispheric-wide centennial to millennial-scale variability through ocean/sea-ice feedbacks. Therefore, we conclude that volcanic activity played a critical role in driving centennial to millennial-scale Holocene temperature variability in Greenland and likely beyond.
Conflict of interest statement
The authors declare that they have no competing interests.
Figures
Similar articles
-
Holocene centennial to millennial shifts in North-Atlantic storminess and ocean dynamics.Sci Rep. 2018 Aug 24;8(1):12778. doi: 10.1038/s41598-018-29949-8. Sci Rep. 2018. PMID: 30143649 Free PMC article.
-
Centennial-scale Holocene climate variations amplified by Antarctic Ice Sheet discharge.Nature. 2017 Jan 5;541(7635):72-76. doi: 10.1038/nature20582. Epub 2016 Dec 12. Nature. 2017. PMID: 27951585
-
Abrupt changes in the Asian southwest monsoon during the Holocene and their links to the North Atlantic Ocean.Nature. 2003 Jan 23;421(6921):354-7. doi: 10.1038/nature01340. Nature. 2003. PMID: 12540924
-
Pollen from the Deep-Sea: A Breakthrough in the Mystery of the Ice Ages.Front Plant Sci. 2018 Jan 26;9:38. doi: 10.3389/fpls.2018.00038. eCollection 2018. Front Plant Sci. 2018. PMID: 29434616 Free PMC article. Review.
-
Climatic Impact of Volcanic Eruptions.ScientificWorldJournal. 2002 Apr 3;2:869-884. doi: 10.1100/tsw.2002.83. eCollection 2002. ScientificWorldJournal. 2002. PMID: 29973851 Free PMC article. Review.
Cited by
-
The Role of Summer Temperature on Aquatic Insect Diversity at Multi-Decadal Scales Within the Holocene.Glob Chang Biol. 2025 Aug;31(8):e70366. doi: 10.1111/gcb.70366. Glob Chang Biol. 2025. PMID: 40762390 Free PMC article.
-
Recurrent transitions to Little Ice Age-like climatic regimes over the Holocene.Clim Dyn. 2021;56(11-12):3817-3833. doi: 10.1007/s00382-021-05669-0. Epub 2021 Feb 6. Clim Dyn. 2021. PMID: 34776646 Free PMC article.
-
Geochemical ice-core constraints on the timing and climatic impact of Aniakchak II (1628 BCE) and Thera (Minoan) volcanic eruptions.PNAS Nexus. 2022 Apr 29;1(2):pgac048. doi: 10.1093/pnasnexus/pgac048. eCollection 2022 May. PNAS Nexus. 2022. PMID: 36713327 Free PMC article.
-
Nile waterscapes facilitated the construction of the Giza pyramids during the 3rd millennium BCE.Proc Natl Acad Sci U S A. 2022 Sep 13;119(37):e2202530119. doi: 10.1073/pnas.2202530119. Epub 2022 Aug 29. Proc Natl Acad Sci U S A. 2022. PMID: 36037388 Free PMC article.
-
Strong links between Saharan dust fluxes, monsoon strength, and North Atlantic climate during the last 5000 years.Sci Adv. 2021 Jun 25;7(26):eabe6102. doi: 10.1126/sciadv.abe6102. Print 2021 Jun. Sci Adv. 2021. PMID: 34172437 Free PMC article.
References
-
- Fleitmann D, et al. Holocene ITCZ and Indian monsoon dynamics recorded in stalagmites from Oman and Yemen (Socotra) Quaternary Sci. Rev. 2007;26:170–188. doi: 10.1016/j.quascirev.2006.04.012. - DOI
-
- Richerson, P. J. & Boyd, R. In The Origin of Human Social Institutions, Proceedings-British Academy Vol. 110 (ed. W. G. Runciman) 197–234 (Oxford University Press Inc., 2001).
-
- Mayewski PA, et al. Holocene climate variability. Quaternary Res. 2004;62:243–255. doi: 10.1016/j.yqres.2004.07.001. - DOI
-
- Kobashi T, et al. Modern solar maximum forced late twentieth century Greenland cooling. Geophys. Res. Lett. 2015;42:5992–5999. doi: 10.1002/2015GL064764. - DOI
-
- Severinghaus JP, Grachev A, Battle M. Thermal fractionation of air in polar firn by seasonal temperature gradients. Geochem. Geophy. Geosy. 2001;2:1048–n/a. doi: 10.1029/2000GC000146. - DOI
Publication types
LinkOut - more resources
Full Text Sources
Other Literature Sources
Miscellaneous
