. 2017 May 3;7(1):1406.
doi: 10.1038/s41598-017-01636-0.

Photoplethysmography for the Assessment of Haemorheology

Affiliations

Photoplethysmography for the Assessment of Haemorheology

Haneen Njoum et al. Sci Rep. .

Abstract

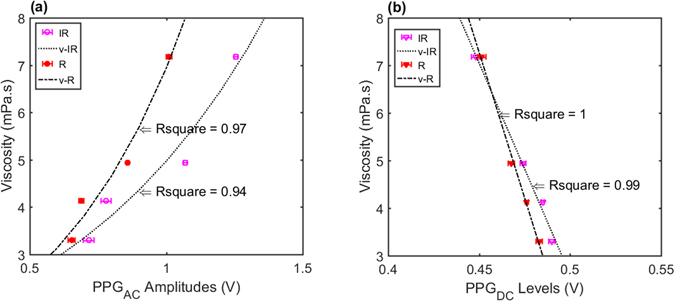
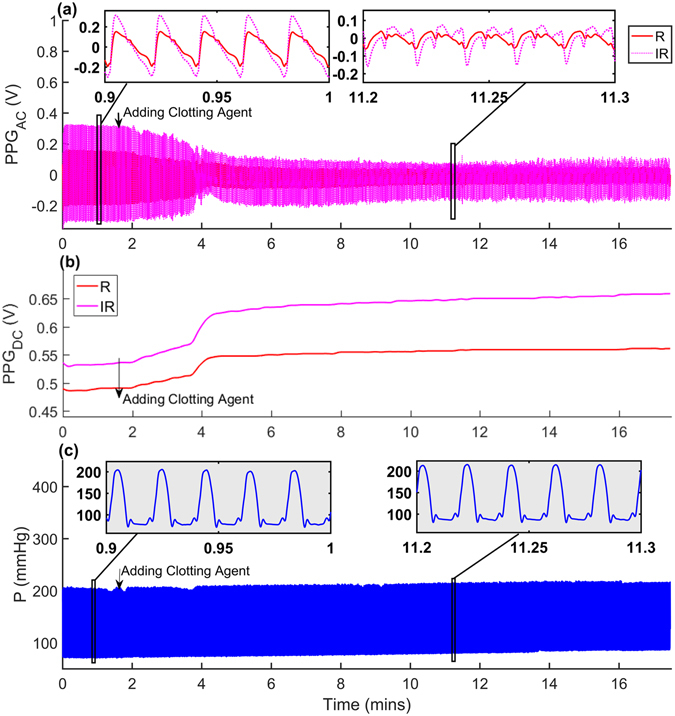
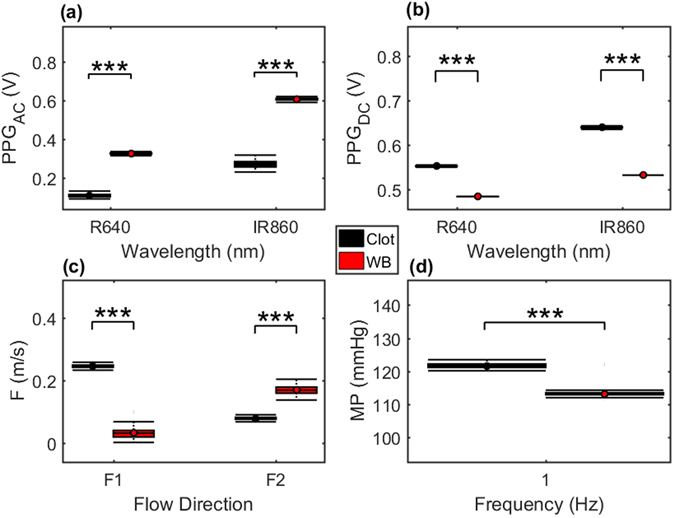
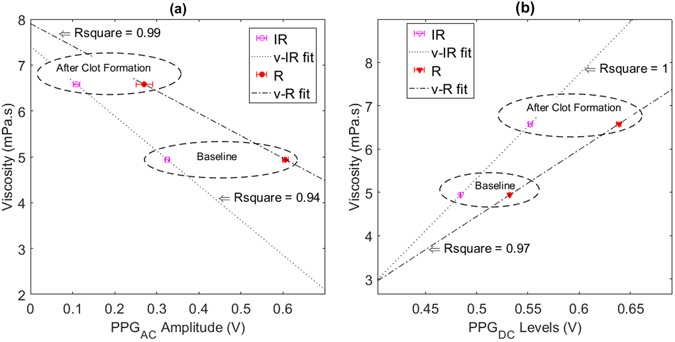
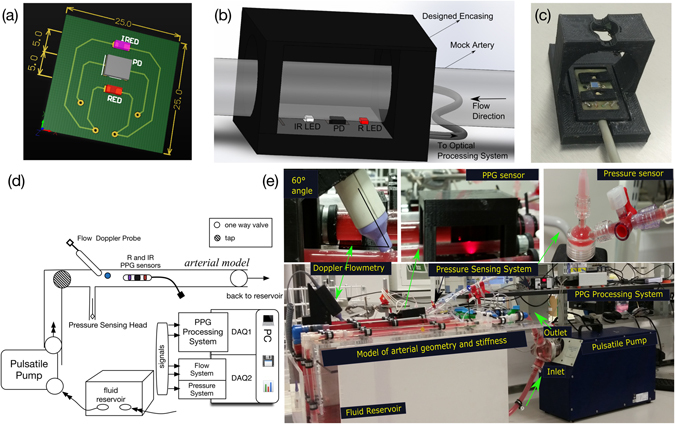
Haemorheology has been long identified as an early biomarker of a wide range of diseases, especially cardiovascular diseases. This study investigates for the first time the suitability of Photoplethysmography (PPG) as a non-invasive diagnostic method for haemorheological changes. The sensitivity of both PPG components (AC and DC) to changes in haemorheology were rigorously investigated in an in vitro experimental setup that mimics the human circulation. A custom-made reflectance PPG sensor, a pressure transducer and an ultrasonic Doppler flowmeter were used to map changes in flow dynamics and optical responses in an arterial model. The study investigated the effect of shear rates by varying fluid pumping frequencies using 4 set-points and the effect of clot formation using a chemical trigger. Both PPGAC amplitudes and PPGDC levels showed significant (p < 0.001) changes during the increase in shear rates and an immediate change after thromboplastin activation. The findings highlight that PPG has the potential to be used as a simple non-invasive method for the detection of blood characteristics, including disaggregation, radial migration and cross-linking fibrin formations. Such capability will enable the assessment of the effects of clotting-activators and anticoagulants (including non-pharmacological methods) and might aid in the early non-invasive assessment of cardiovascular pathologies.


Conflict of interest statement

The authors declare that they have no competing interests.

Figures

Figure 1
Figure 1
Optical Spectra and viscosity measurements. (a) Optical Spectra for a sample of whole equine blood and a fully clotted equine sample. (b) Shear controlled viscosity measurement, for whole equine blood and a fully clotted sample.
Figure 2
Figure 2
Equine blood microscopic images (a) showing aggregation of cells (coin-shape rouleaux formation) after samples were left to settle in the reservoir (magnification x400); (b) Sample images after pumping at varied shear rates (magnification x400); (c) Scanning Electronic Microscopic (SEM) images of a whole equine blood sample after two mins and; (d) SEM of whole equine blood sample after 20 mins of thromboplastin activation (magnification x5000), clearly showing erythrocytes and the development of Fibrinous Matrix.
Figure 3
Figure 3
Signals collected during circulating whole equine blood. Data was obtained at 190 seconds for each pumping frequency (0.7, 1, 1.5 and 1.9 Hz). (a) Red (R) and Infrared (IR) PPGAC signals. (b) R and IR PPGDC levels. (c) Pressure (P) signals and (d) shows forward (F1) and backward (F2) flow velocities.
Figure 4
Figure 4
Boxplots for pressure and PPG components. Signals were obtained at varying pumping frequencies while circulating whole equine blood in a pulsatile laminar flow at a stroke volume of 70. (a) Mean pressure values, (b) R and IR PPGDC levels, (c) R and IR PPGAC amplitudes. P-values obtained from multiple Sidak’s test are displayed using the 3-star system. n = 760.
Figure 5
Figure 5
Regression models relating measured viscosity values with PPG components. Models created for R and IR PPG signals obtained from the in vitro experimental setup while changing pumping frequencies at 4 set-points. (a) Exponential regression model for viscosity values versus the amplitudes of PPGAC. (b) Linear regression model for viscosity values versus levels of PPGDC.
Figure 6
Figure 6
Collected signals before and after clot formations. Showing the signal behaviour after the clotting agent was introduced after 80 seconds of baseline data collection. (a) InfraRed (IR) PPGAC, (b) IR PPGDC, (c) pressure signals. The pumping frequency was set to 1 Hz and the stroke volume to 70 ml.
Figure 7
Figure 7
Statistical comparisons for PPG and haemodynamic data before and after clot formation. Data is obtained from the in vitro setup while circulating whole equine blood (WB) and after adding the clotting agent (Clot). Data obtained at a stroke volume of 70 ml and a frequency of 1 Hz. (a) R and IR PPGAC amplitudes, (b) R and IR PPGDC levels, (c) forward (F1) and backward (F2) flow velocities, and (d) mean pressure values. Statistical significance summary is displayed using the 3-star system.
Figure 8
Figure 8
Regression models relating measured viscosity values with PPG components. Models created for R and IR PPG signals from the in vitro experimental setup before and after clot formation at a frequency of 1 Hz and a stroke volume of 70 ml. (a) Linear regression model for viscosity values (v) versus the amplitudes of PPGAC at both wavelengths. (b) Linear regression model for viscosity values (v) versus levels of PPGDC at both wavelengths.
Figure 9
Figure 9
In vitro setup design and implementation. (a) Sensor PCB design, (b) 3D model of sensor and encasing, (c) close-up picture of inner encasing and sensor, (d) schematic of the experimental setup (e) picture of the final experimental design.

References

    1. Piagnerelli M, Boudjeltia KZ, Vanhaeverbeek M, Vincent J-L. Red blood cell rheology in sepsis. Intensive Care Med. 2003;29:1052–1061. doi: 10.1007/s00134-003-1783-2. - DOI - PubMed
    1. Chien S, Usami S, Bertles JF. Abnormal rheology of oxygenated blood in sickle cell anemia. J. Clin. Invest. 1970;49:623–634. doi: 10.1172/JCI106273. - DOI - PMC - PubMed
    1. Li X, et al. Patient-specific blood rheology in sickle-cell anaemia. Interface Focus. 2016;6:20150065. doi: 10.1098/rsfs.2015.0065. - DOI - PMC - PubMed
    1. Le Dévéhat C, Vimeux M, Khodabandehlou T. Blood rheology in patients with diabetes mellitus. Clin. Hemorheol. Microcirc. 2004;30:297–300. - PubMed
    1. von Tempelhoff G-F, Nieman F, Heilmann L, Hommel G. Association between blood rheology, thrombosis and cancer survival in patients with gynecologic malignancy. Clin. Hemorheol. Microcirc. 2000;22:107–130. - PubMed

LinkOut - more resources