. 2017 May 3;7(1):1468.
doi: 10.1038/s41598-017-01563-0.

Deciphering pyritization-kerogenization gradient for fish soft-tissue preservation

Affiliations

Deciphering pyritization-kerogenization gradient for fish soft-tissue preservation

Gabriel L Osés et al. Sci Rep. .

Abstract

Soft-tissue preservation provides palaeobiological information that is otherwise lost during fossilization. In Brazil, the Early Cretaceous Santana Formation contains fish with integument, muscles, connective tissues, and eyes that are still preserved. Our study revealed that soft-tissues were pyritized or kerogenized in different microfacies, which yielded distinct preservation fidelities. Indeed, new data provided the first record of pyritized vertebrate muscles and eyes. We propose that the different taphonomic pathways were controlled by distinct sedimentation rates in two different microfacies. Through this process, carcasses deposited in each of these microfacies underwent different residence times in sulphate-reduction and methanogenesis zones, thus yielding pyritized or kerogenized soft-tissues, and a similar process has previously been suggested in studies of a late Ediacaran lagerstätte.


Conflict of interest statement

The authors declare that they have no competing interests.

Figures

Figure 1
Figure 1
Thin sections of the beige limestone (BL) and the grey limestone (GL) microfacies. Thin sections GP/L 21 (a,d), GP/L 19 (b), GP/L 18 (g), GP/L 172 (c), and GP/L 16 (e,f). (a) BL is composed of thin laminasets of diffuse dark clay laminae (detail in c), interlaminated with pale pure microspar laminae. Elongated to round organic matter-rich dark lenses are indistinctly scattered. This microfacies is interpreted as the laminated limestone (LL) Sm5 microfacies. (b) GL is composed of dark-grey undulated laminasets formed by thin laminae with fine blackish scattered material, likely clay/organic matter impurities, (detail in d). Laminasets are interlaminated with paler microspar-dominated laminae. Scattered non-oriented detrital quartz is indicated by arrow. GL microfacies is interpreted as Sm1, a clay-carbonate rythmite (CCR). Besides GL having significantly fewer dark lenses than BL, the clay/organic matter-rich laminasets are more frequent, regularly distributed, thicker and have more and closer-packed laminae. (c) Detail of BL dark laminae. (d) Detail of GL dark laminae, showing concentration of pyrite. (e) Thin section of GL depicting microspar-dominated level (top) and clay-rich laminaset (bottom). (f) Image in (e) with crossed-nicols showing neomorphic sparry crystals (arrows). (g) GL clay-rich level with peloids. Scale bars: (a)– 1 mm; (b)– 2 mm; (c)– 0.02 mm; (d)– 0.1 mm; (e)– 0.5 mm; (f)– 0.5 mm; (g)– 0. 2 mm.
Figure 2
Figure 2
SEM of Crato Member BL fish soft-tissues and microfabrics. The images of the analyzed specimens and the localization of micrographs are depicted in Supplementary Figure 3. (a) depicts poorly-preserved muscle fibres, like diagonal ridges, at caudal fin base (Supplementary Figure 3). (b) shows that fibres are composed of Fe oxide/hydroxide (Supplementary Figure 5) sub-spherical to spherical grains with more than 1 µm (and occasionally less than this size, indicated by arrow), locally merged and covered by a “fuzzy” coating. The area highlighted in (b), enlarged in (c), depicts Fe oxide/hydroxide honeycomb-like texture (Supplementary Figure 5). (d), Micrograph showing how muscles are attached to dorsal fin base via tendons and the way these muscles connect to those sub-parallel to column (Supplementary Figure 3). Inset details these observations. Microfabric composition is depicted in Supplementary Figure 5. (e) Micrograph of fish anteroposterior axis (below dorsal fin; Supplementary Figure 3). Images reveal how muscles attach to vertebra, revealing preserved tendons (dashed rectangle), and muscles connected to tendons (big rectangle). Scale bars: (a)– 50 µm; (b)– 10 µm; (c)– 5 µm; (d), (e)– 100 µm.
Figure 3
Figure 3
SEM of Crato Member BL fish soft-tissues, microfabrics and putative extracellular polymeric substances (EPS). The images of analyzed specimens and the localization of micrographs are depicted in Supplementary Figures 3, 4 and 6. (a,b) Micrographs of fish anteroposterior axis (below dorsal fin; Supplementary Figure 3) depicting fibre microfabric (Supplementary Figure 5). (c) depicts preserved eye (Supplementary Figure 6). (d) Shows eye microfabric. (e) (left) depicts fragmented and locally excavated muscle fibres subparallel to vertebral column. Gaps between fibres are occupied by wide, elongated, flat, soft-structures (sarcolemma), which also have orientations different from fibres. The same micrograph in the left is reproduced in the right with an interpretative drawing of the sarcolemma orientation. (f) Detail of sarcolemma (right). (g) shows myomeres with muscle fibres (Supplementary Figure 4). (h) Possible nucleus (arrow). (i), Putative EPS covering grains (Supplementary Figure 7) in left half of the figure. Scale bars: (a,e,h)– 20 µm; (b,f,i)– 5 µm; (c,g)– 500 µm; (d)– 10 µm.
Figure 4
Figure 4
Geochemistry of the Crato Member fossil fish from BL. (a) Specimen GP/2E 9014 from BL with points (P1, P2 – decayed soft-tissue area; P3 – bones; P4, P5 – matrix) analyzed in (b). (b) EDXRF results of the selected points in fossil depicted in (a). (c) Fossil GP/2E 7781 g. The dashed line indicates the approximate direction of thin section in (d). (d) Thin section (GP/L 20) of specimen in c depicting calcite cement filling vertebrae (1), vertebrae (2), and soft-tissues (3) around vertebrae. The red square delimits the area analyzed in (e). (e) Energy dispersive X-ray (EDS) maps of several elements distributed among the three main regions (1–3) in (d) Scale bars: (a)– 1 cm; (c)– 0.5 cm; (d)– 0.1 mm; (e)– 0.1 mm.
Figure 5
Figure 5
Thin section images and SEM of fish (Fig. 6a) with preserved carbonaceous soft-tissues. Thin sections GP/L 16 (ac,f,g) and GP/L 17 (d,e,hk). Dark opaque sinuous laminated, locally convolute muscle tissues (ac), composed of alternating, differently coloured light/dark bands (d,e). Muscle tissue is composed of dark fibres (b,c; arrows). (f) Degraded soft-tissues and bones. (g) SEM micrograph of muscle fibre detail. (h,i) Muscle fibres (mf) in cross-section, depicting endomysium/perimysium-like connective tissues (ct) and muscle bundles (dashed ellipsis). (j,k) Scales are interlayered with soft-tissues (black) and calcite cement. Scale bars: (ac,e,f,j,k)– 0.2 mm; (d)– 0.5 mm; (g)– 20 µm; (h)– 0.1 mm; (i)– 0.02 mm.
Figure 6
Figure 6
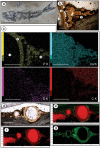
Geochemistry of the Crato Member fossil fish from GL. (a) Specimen GP/2E 9666 from grey limestones (GL). The approximate direction of thin section (in b) extraction is marked by dashed line. (b) Thin section (GP/L 16) of specimen in (a) showing calcite cement (1), vertebrae (2), and soft- tissues (3). (c) EDS maps of elemental distribution over areas (1–3) selected in (b). (d) Area mapped by SR-µXRF of the thin section GP/L 16. (eg) SR-µXRF maps. (e) Ca – red, Fe – green. (f) Ca – red, Cu – blue. (g) Zn. Colour brightness is proportional to element concentration, and both map horizontal and vertical scale axes are in mm. Elemental maps of all elements (except for Zn) are in Supplementary Figure 9. Scale bars: (a)– 1.5 cm; (b)– 0.5 mm; (c)– 1 mm; (d)– 2 mm.
Figure 7
Figure 7
Taphonomic proposal for pyritization and kerogenization in the Crato Member. The upper and lower diagrams show bacterial respiration processes (NR – Nitrate Reduction, MR – Manganese Reduction, IR – Iron Reduction, SR – Sulphate Reduction, M - Methanogenesis) on the left. The correspondent reactions are seen at figure bottom. Electron acceptor curves used in these respiration processes are depicted, showing electron acceptor depletion from right to left (indicated by arrow at figure top). Sediment depth is represented by vertical arrow. Either pyritized (upper diagram) or kerogenized (lower diagram) fossils are represented by an ellipsis, located in the correspondent simplified sediment geochemical zone (sulphidic or methanic). Curves of respiration geochemical products are depicted on the right, showing increase from left to right. We propose that BL (upper diagram) has been deposited at lower sedimentation rates than GL (lower diagram) microfacies, as evidenced by greater terrigenous clay/organic matter content and peloid levels in GL. Variable sedimentation rates are explained by transgressive-regressive climatic cycles. As a consequence, carcasses in BL have remained longer in the sulphidic zone, whereas carcasses in GL have both entered more rapidly and spent more time in the methanic zone, respectively yielding pyritized and kerogenized labile-tissues. In addition, variable cement contents in different carbonate microfacies plus clay in GL microfacies could have diminished sulphate percolation downwards, narrowing the sulphidic zone. The hypotheses we propose are based on refs and . Sedimentation rate (SR) representation is based on ref. . Microbial respiration process zonation and reactions, geochemical zonation, plus electron acceptor and geochemical product curves are based on ref. .

Similar articles

Cited by

References

    1. Seilacher A, Reif W-E, Westphal F. Sedimentological, ecological and temporal patterns of fossil lagerstätten. Philos. Trans. R. Soc. Lond. B Biol. Sci. 1985;311:5–23. doi: 10.1098/rstb.1985.0134. - DOI
    1. Martill, D. M., Bechly, G. & Loveridge, R. The Crato Fossil Beds of Brazil: Window To An Ancient World (Cambridge University Press, New York, 2007).
    1. Maldanis L, et al. Heart fossilization is possible and informs the evolution of cardiac outflow tract in vertebrates. eLife. 2016;5:1–12. doi: 10.7554/eLife.14698. - DOI - PMC - PubMed
    1. Pinheiro FL, Horn BLD, Schultz CL, de Andrade JAFG, Sucerquia PA. Fossilized bacteria in a Cretaceous pterosaur headcrest. Lethaia. 2012;45:495–499. doi: 10.1111/j.1502-3931.2012.00309.x. - DOI
    1. Fielding S, Martill DM, Naish D. Solnhofen-style soft-tissue preservation in a new species of turtle from the Crato Formation (early Cretaceous, Aptian) of north-east Brazil. Palaeontology. 2005;48:1301–1310. doi: 10.1111/j.1475-4983.2005.00508.x. - DOI

Publication types