

Interactive Toxicogenomics: Gene set discovery, clustering and analysis in Toxygates
- PMID: 28469246
- PMCID: PMC5431224
- DOI: 10.1038/s41598-017-01500-1
Interactive Toxicogenomics: Gene set discovery, clustering and analysis in Toxygates
Abstract
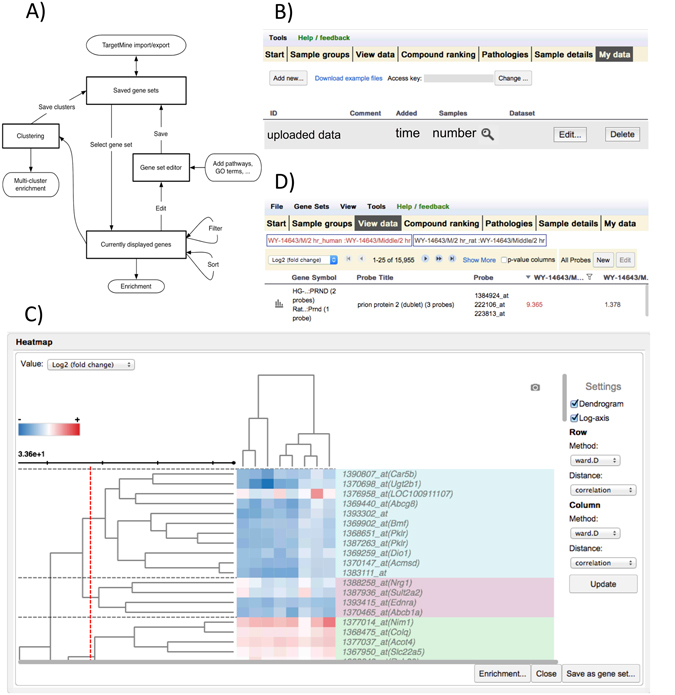
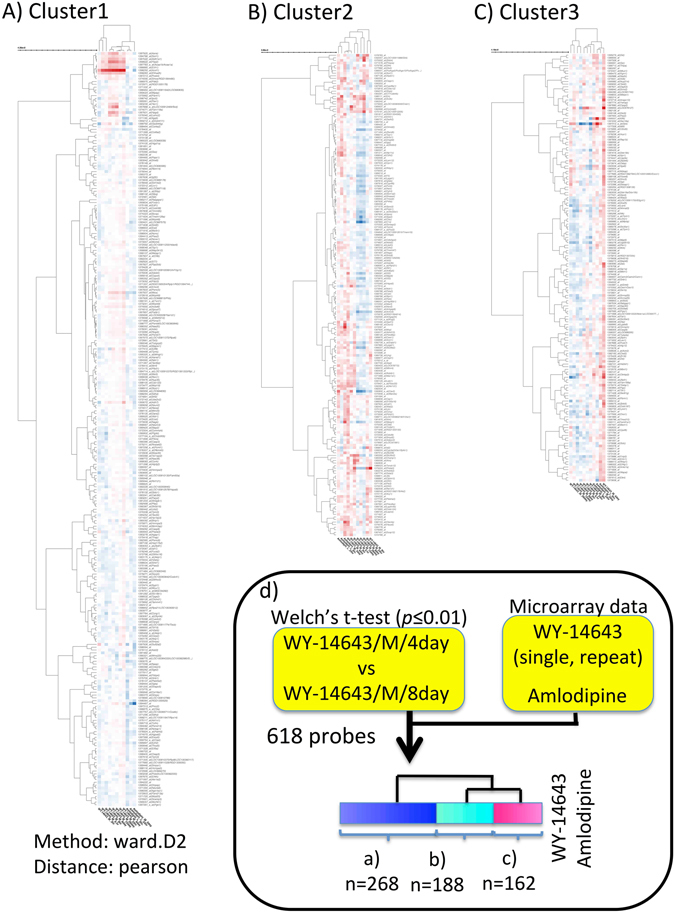
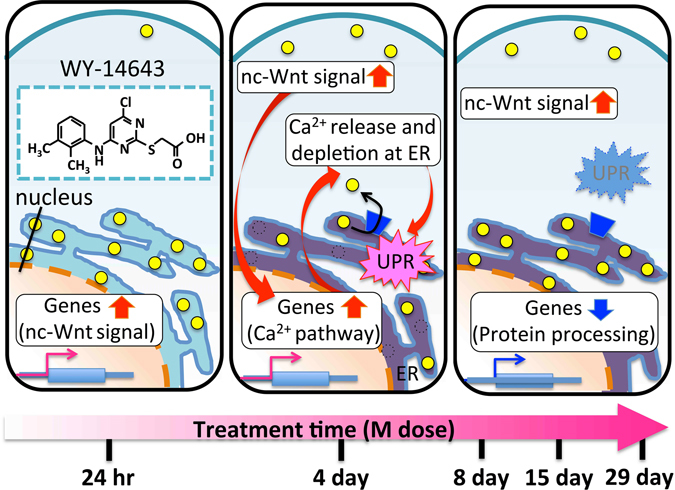
Toxygates was originally released as a user-friendly interface to enhance the accessibility of the large-scale toxicogenomics database, Open TG-GATEs, generated by the Japanese Toxicogenomics Project. Since the original release, significant new functionality has been added to enable users to perform sophisticated computational analysis with only modest bioinformatics skills. The new features include an orthologous mode for data comparison among different species, interactive clustering and heatmap visualisation, enrichment analysis of gene sets, and user data uploading. In a case study, we use these new functions to study the hepatotoxicity of peroxisome proliferator-activated receptor alpha (PPARα) agonist WY-14643. Our findings suggest that WY-14643 caused hypertrophy in the bile duct by intracellular Ca2+ dysregulation, which resulted in the induction of genes in a non-canonical WNT/Ca2+ signalling pathway. With this new release of Toxygates, we provide a suite of tools that allow anyone to carry out in-depth analysis of toxicogenomics in Open TG-GATEs, and of any other dataset that is uploaded.
Conflict of interest statement
The authors declare that they have no competing interests.
Figures
Similar articles
-
Toxygates: interactive toxicity analysis on a hybrid microarray and linked data platform.Bioinformatics. 2013 Dec 1;29(23):3080-6. doi: 10.1093/bioinformatics/btt531. Epub 2013 Sep 17. Bioinformatics. 2013. PMID: 24048354
-
LTMap: a web server for assessing the potential liver toxicity by genome-wide transcriptional expression data.J Appl Toxicol. 2014 Jul;34(7):805-9. doi: 10.1002/jat.2923. Epub 2013 Sep 11. J Appl Toxicol. 2014. PMID: 24022982
-
Transcriptome analyses demonstrate that Peroxisome Proliferator-Activated Receptor α (PPARα) activity of an ultraviolet absorber, 2-(2'-hydroxy-3',5'-di-tert-butylphenyl)benzotriazole, as possible mechanism of their toxicity and the gender differences.J Toxicol Sci. 2016;41(5):693-700. doi: 10.2131/jts.41.693. J Toxicol Sci. 2016. PMID: 27665778
-
Practical application of toxicogenomics for profiling toxicant-induced biological perturbations.Int J Mol Sci. 2010 Sep 20;11(9):3397-412. doi: 10.3390/ijms11093397. Int J Mol Sci. 2010. PMID: 20957103 Free PMC article. Review.
-
The Japanese toxicogenomics project: application of toxicogenomics.Mol Nutr Food Res. 2010 Feb;54(2):218-27. doi: 10.1002/mnfr.200900169. Mol Nutr Food Res. 2010. PMID: 20041446 Review.
Cited by
-
ToxicoDB: an integrated database to mine and visualize large-scale toxicogenomic datasets.Nucleic Acids Res. 2020 Jul 2;48(W1):W455-W462. doi: 10.1093/nar/gkaa390. Nucleic Acids Res. 2020. PMID: 32421831 Free PMC article.
-
Panomicon: A web-based environment for interactive, visual analysis of multi-omics data.Heliyon. 2020 Aug 19;6(8):e04618. doi: 10.1016/j.heliyon.2020.e04618. eCollection 2020 Aug. Heliyon. 2020. PMID: 32904262 Free PMC article.
-
Robust hierarchical co-clustering for exploring toxicogenomic biomarkers and their chemical regulators.Sci Rep. 2025 May 14;15(1):16676. doi: 10.1038/s41598-025-99568-7. Sci Rep. 2025. PMID: 40369321 Free PMC article.
-
Deep Learning-based Modeling for Preclinical Drug Safety Assessment.bioRxiv [Preprint]. 2024 Jul 23:2024.07.20.604430. doi: 10.1101/2024.07.20.604430. bioRxiv. 2024. PMID: 39091793 Free PMC article. Preprint.
-
Transcriptomics in Toxicogenomics, Part III: Data Modelling for Risk Assessment.Nanomaterials (Basel). 2020 Apr 8;10(4):708. doi: 10.3390/nano10040708. Nanomaterials (Basel). 2020. PMID: 32276469 Free PMC article. Review.
References
Publication types
MeSH terms
Substances
LinkOut - more resources
Full Text Sources
Other Literature Sources
Miscellaneous
