Transcriptologs: A Transcriptome-Based Approach to Predict Orthology Relationships
- PMID: 28469416
- PMCID: PMC5348085
- DOI: 10.1177/1177932217690136
Transcriptologs: A Transcriptome-Based Approach to Predict Orthology Relationships
Abstract
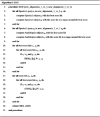
The detection of orthologs is a key approach in genomics, useful to understand gene evolution and phylogenetic relationships and essential for gene function prediction. However, a reliable annotation of the encoded protein regions is still a limiting aspect in genomics, mainly due to the lack of confirmatory experimental evidence at proteome level. Nevertheless, the current ortholog collections are generally based on protein sequence comparisons, in addition to the availability of large transcriptome sequence collections. We developed Transcriptologs, a method for the prediction of orthologs based on similarities of translated fragments from messenger RNAs of 2 species. We implemented a procedure to extend BLAST-based alignments and to define orthologs based on the Bidirectional Best Hit approach. Results from a test case on Arabidopsis thaliana and Sorghum bicolor transcript collections revealed in some cases outperformance of Transcriptologs in comparison with a classical protein-based analysis in terms of alignment quality, revealing similarities otherwise not detectable.
Keywords: Functional genomics; RNA; proteins; sequence analysis.
Conflict of interest statement
DECLARATION OF CONFLICTING INTERESTS: The author(s) declared no potential conflicts of interest with respect to the research, authorship, and/or publication of this article. Disclosures and Ethics As a requirement of publication, author(s) have provided to the publisher signed confirmation of compliance with legal and ethical obligations including, but not limited to, the following: authorship and contributorship, conflicts of interest, privacy and confidentiality, and (where applicable) protection of human and animal research subjects. The authors have read and confirmed their agreement with the ICMJE authorship and conflict of interest criteria. The authors have also confirmed that this article is unique and not under consideration or published in any other publication, and that they have permission from rights holders to reproduce any copyrighted material. Any disclosures are made in this section. The external blind peer reviewers report no conflicts of interest.
Figures


Similar articles
-
Detecting non-orthology in the COGs database and other approaches grouping orthologs using genome-specific best hits.Nucleic Acids Res. 2006 Jul 11;34(11):3309-16. doi: 10.1093/nar/gkl433. Print 2006. Nucleic Acids Res. 2006. PMID: 16835308 Free PMC article.
-
A meta-approach for improving the prediction and the functional annotation of ortholog groups.BMC Genomics. 2014;15 Suppl 6(Suppl 6):S16. doi: 10.1186/1471-2164-15-S6-S16. Epub 2014 Oct 17. BMC Genomics. 2014. PMID: 25573073 Free PMC article.
-
SuperPartitions: detection and classification of orthologs.Gene. 2012 Jan 15;492(1):199-211. doi: 10.1016/j.gene.2011.10.027. Epub 2011 Oct 20. Gene. 2012. PMID: 22056699
-
Orthologs, paralogs, and evolutionary genomics.Annu Rev Genet. 2005;39:309-38. doi: 10.1146/annurev.genet.39.073003.114725. Annu Rev Genet. 2005. PMID: 16285863 Review.
-
The quest for orthologs: finding the corresponding gene across genomes.Trends Genet. 2008 Nov;24(11):539-51. doi: 10.1016/j.tig.2008.08.009. Epub 2008 Sep 24. Trends Genet. 2008. PMID: 18819722 Review.
Cited by
-
Bioinformatics Resources for Plant Abiotic Stress Responses: State of the Art and Opportunities in the Fast Evolving -Omics Era.Plants (Basel). 2020 May 6;9(5):591. doi: 10.3390/plants9050591. Plants (Basel). 2020. PMID: 32384671 Free PMC article. Review.
-
Comparative Transcriptomics to Identify RNA Writers and Erasers in Microalgae.Int J Mol Sci. 2024 Jul 23;25(15):8005. doi: 10.3390/ijms25158005. Int J Mol Sci. 2024. PMID: 39125576 Free PMC article.
-
m6A RNA Methylation in Marine Plants: First Insights and Relevance for Biological Rhythms.Int J Mol Sci. 2020 Oct 12;21(20):7508. doi: 10.3390/ijms21207508. Int J Mol Sci. 2020. PMID: 33053767 Free PMC article.
-
Multilevel comparative bioinformatics to investigate evolutionary relationships and specificities in gene annotations: an example for tomato and grapevine.BMC Bioinformatics. 2018 Nov 30;19(Suppl 15):435. doi: 10.1186/s12859-018-2420-y. BMC Bioinformatics. 2018. PMID: 30497367 Free PMC article.
-
Gcorn fungi: A Web Tool for Detecting Biases between Gene Evolution and Speciation in Fungi.J Fungi (Basel). 2021 Nov 12;7(11):959. doi: 10.3390/jof7110959. J Fungi (Basel). 2021. PMID: 34829248 Free PMC article.
References
-
- Dessimoz C, Cannarozzi G, Gil M, et al. OMA, a comprehensive, automated project for the identification of orthologs from complete genome data: introduction and first achievements. Comp Genom. 2005;2005:61–72.
LinkOut - more resources
Full Text Sources
Other Literature Sources
Research Materials

