

Using Spatial Analysis to Inform Community Immunization Strategies
- PMID: 28469433
- PMCID: PMC5391195
- DOI: 10.1177/1178222617700626
Using Spatial Analysis to Inform Community Immunization Strategies
Abstract
Introduction: Recent pertussis outbreaks in the United States suggest our response to local disease outbreaks (eg, vaccine-preventable Bordetella pertussis) may benefit from understanding and applying spatial analytical methods that use data from immunization information systems at a subcounty level.
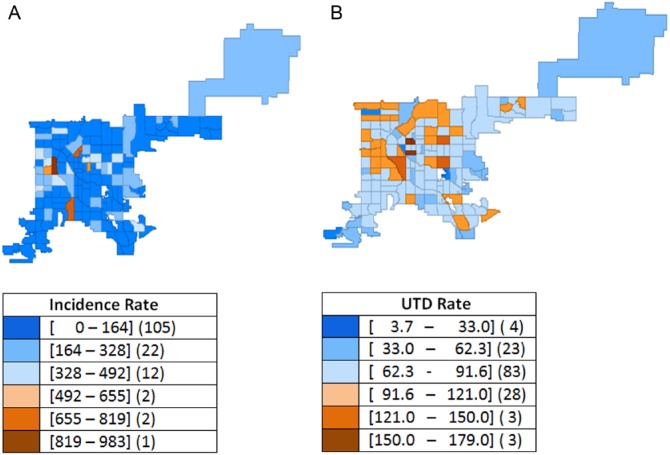
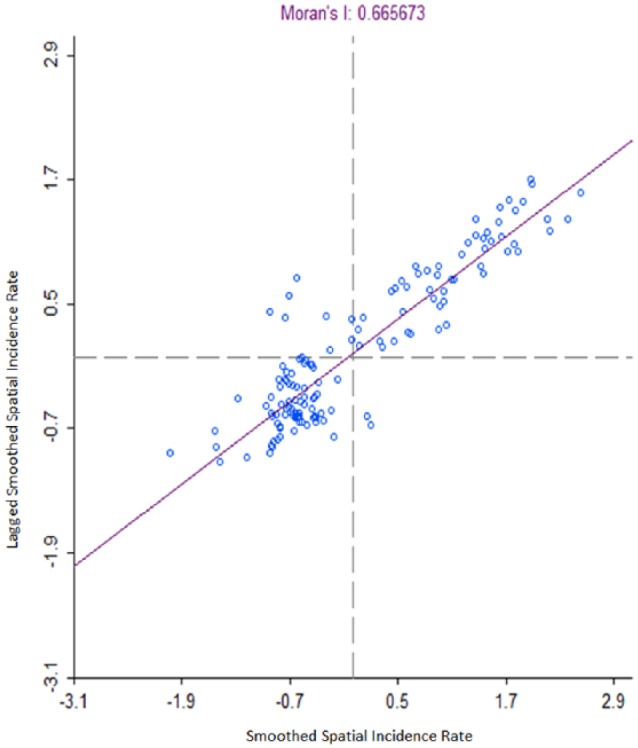
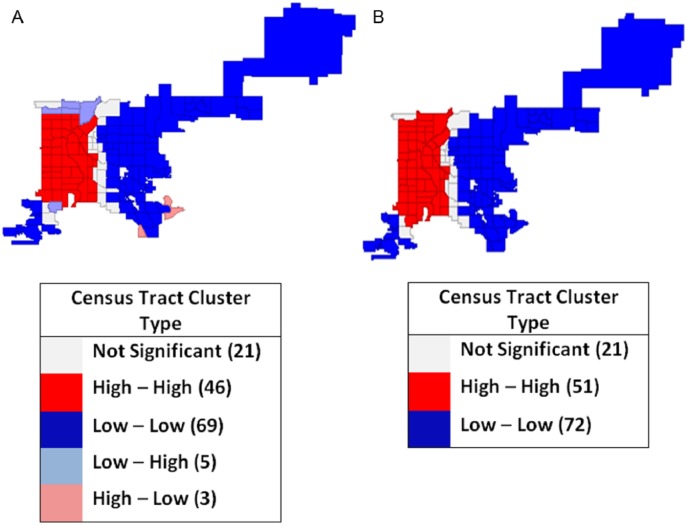
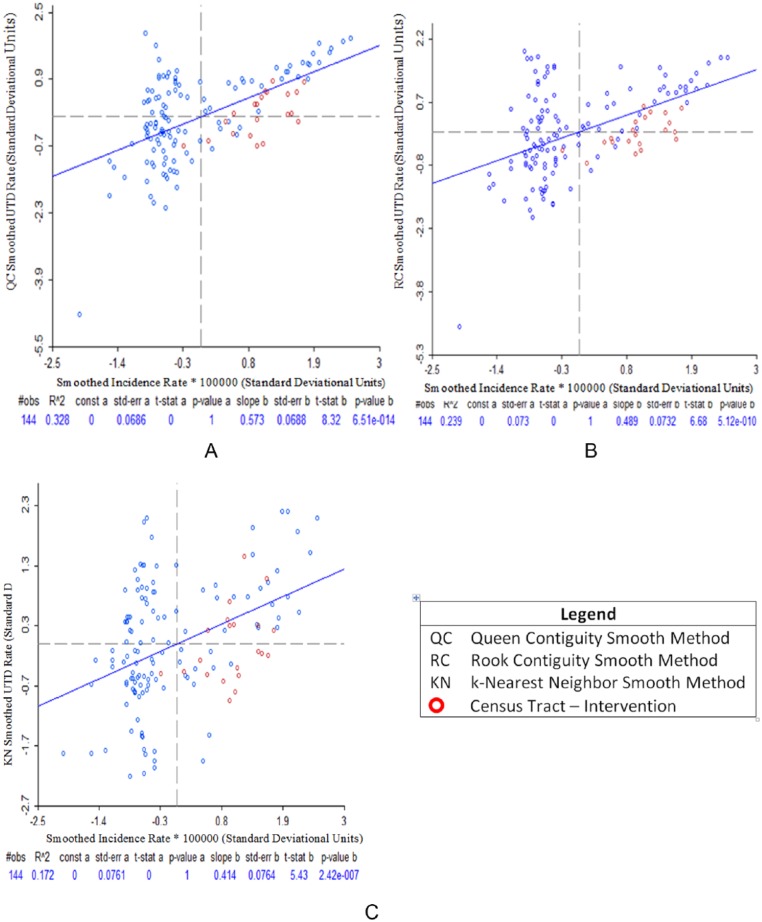
Methods: A 2012 study on Denver, CO, residents less than 19 years of age confirmed pertussis cases and immunization information system records were geocoded and aggregated to the census tract (CT) level. An algorithm assessed whether individuals were up-to-date (UTD) for pertussis vaccines. Pearson, Spearman, and Kendall correlations assessed relations between disease incidence and pertussis vaccine coverage. Using spatial analysis software, disease incidence and UTD rates were spatially weighted, and smoothed. Global and local autocorrelations based on univariate Moran's I spatial autocorrelation statistics evaluated whether a CT's rate belong to a cluster based on incidence or UTD measures.
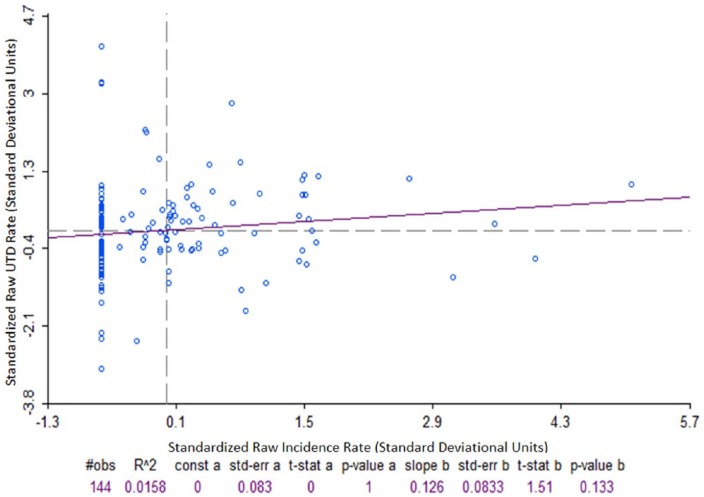
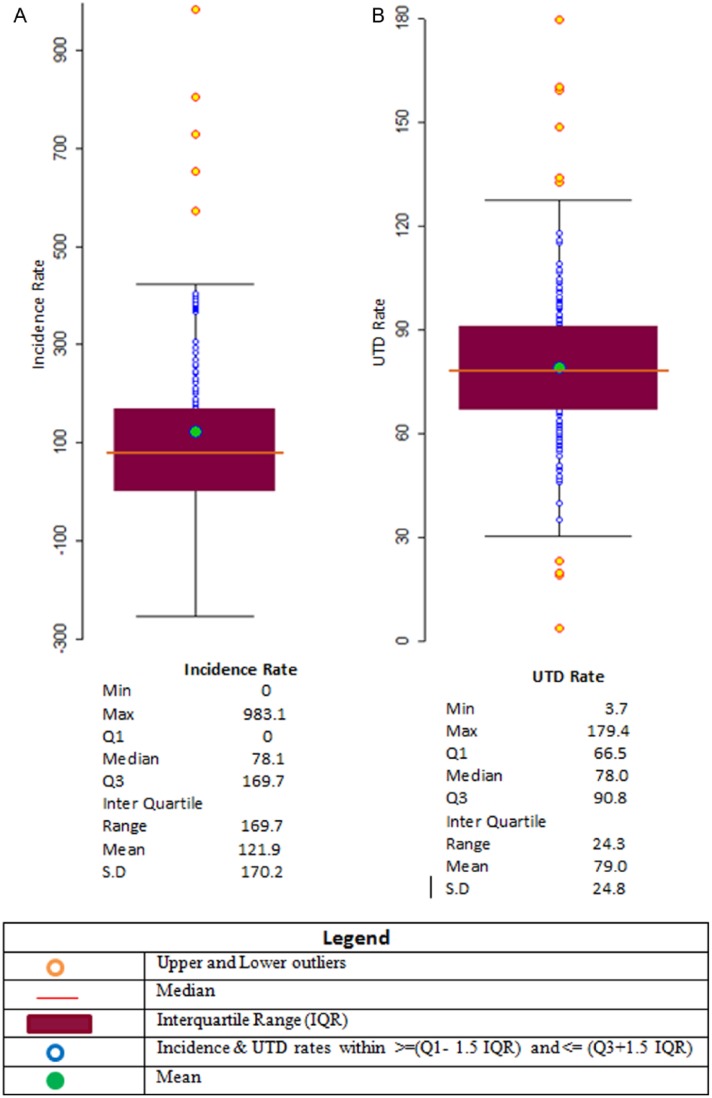
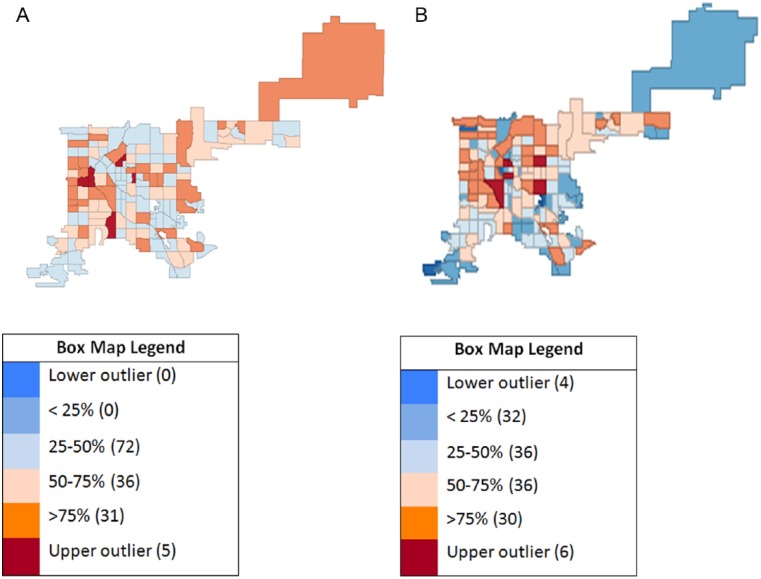
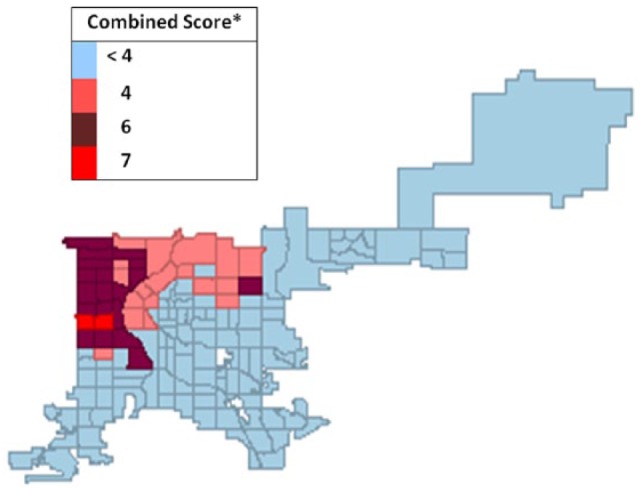
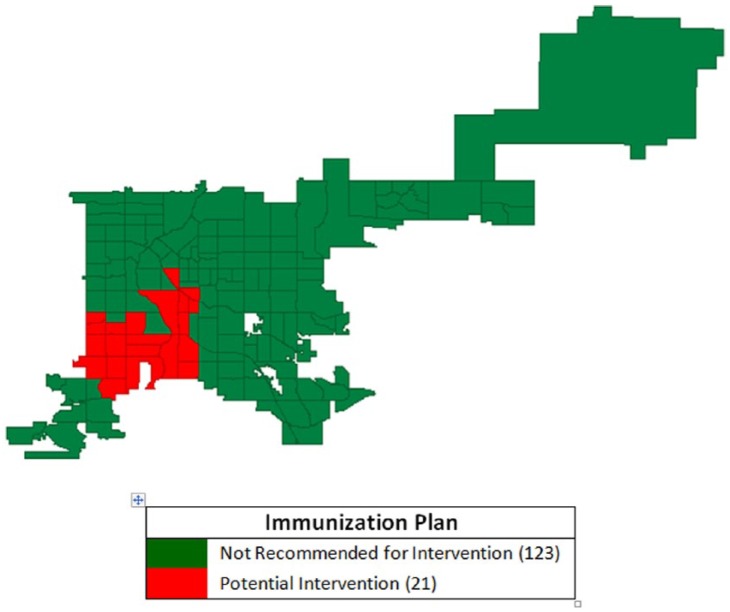
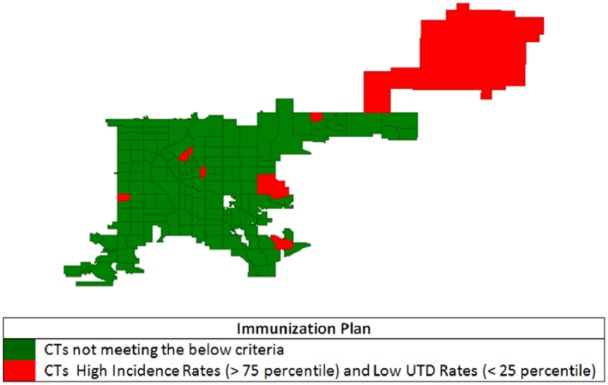
Results: Overall disease incidence rate was 116.8/100 000. Assessment of pertussis vaccination coverage was available for 90% of the population. Among 134 672 Denver residents less than 19 years old, 103 496 (77%) were UTD for pertussis vaccines. Raw correlation coefficients showed weak relationships between incidence and immunization rates due to the presence of outliers. With geospatial and clustering analysis, estimates and correlation coefficients were improved with statistically significant Moran's I values for global and local autocorrelations rejecting the null hypothesis that incidence or UTD rates were randomly distributed. With evidence indicating the presence of clusters, smoothed and weighted disease incidence and UTD rates in 144 CTs identified 21 CTs (15%) for potential public health intervention.
Conclusions: Correlation of raw disease incidence and vaccine UTD rates in subcounty regions showed limited association, providing limited information for decision making. By assessing for clusters using spatial analysis methods, we identified CTs with higher incidence and lower immunization coverage for targeted public health interventions.
Keywords: Autocorrelation; Immunization; Pertussis; Spatial Analysis.
Conflict of interest statement
DECLARATION OF CONFLICTING INTERESTS: The author(s) declared no potential conflicts of interest with respect to the research, authorship, and/or publication of this article. DISCLOSURES AND ETHICS As a requirement of publication, author(s) have provided to the publisher signed confirmation of compliance with legal and ethical obligations including, but not limited to, the following: authorship and contributorship, conflicts of interest, privacy and confidentiality, and (where applicable) protection of human and animal research subjects. The authors have read and confirmed their agreement with the ICMJE authorship and conflict of interest criteria. The authors have also confirmed that this article is unique and not under consideration or published in any other publication, and that they have permission from rights holders to reproduce any copyrighted material. Any disclosures are made in this section. The external blind peer reviewers report no conflicts of interest.
Figures
References
-
- Centers for Disease Control and Prevention. Pertussis cases by year (1922–2014). http://www.cdc.gov/pertussis/surv-reporting/cases-by-year.html. Accessed July 20, 2016.
-
- Centers for Disease Control and Prevention. 2012. final pertussis surveillance report. https://www.cdc.gov/pertussis/downloads/pertuss-surv-report-2012.pdf. Accessed July 17, 2016.
-
- Clark TA. Status of pertussis control in the United States. http://www.hhs.gov/sites/default/files/nvpo/nvac/meetings/pastmeetings/2.... Published 2013. Accessed July 17, 2016.
-
- Klein NP, Bartlett J, Fireman B, Rowhani-Rahbar A, Baxter R. Comparative effectiveness of acellular versus whole-cell pertussis vaccines in teenagers. Pediatrics. 2013;131:e1716–e1722. - PubMed
-
- Centers for Disease Control and Prevention. Epidemiology and prevention of vaccine-preventable diseases: Pertussis. http://www.cdc.gov/vaccines/pubs/pinkbook/downloads/pert.pdf. Accessed July 20, 2016.
Publication types
Grants and funding
LinkOut - more resources
Full Text Sources
Other Literature Sources
Research Materials
