Spatiotemporal Changes in P-glycoprotein Levels in Brain and Peripheral Tissues Following Ischemic Stroke in Rats
- PMID: 28469478
- PMCID: PMC5398227
- DOI: 10.1177/1179069517701741
Spatiotemporal Changes in P-glycoprotein Levels in Brain and Peripheral Tissues Following Ischemic Stroke in Rats
Abstract
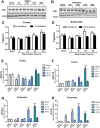
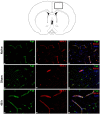
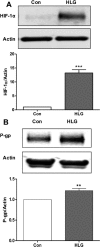
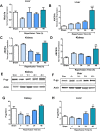
P-glycoprotein (P-gp) is known to transport a diverse array of xenobiotics, including therapeutic drugs. A member of the ATP-binding cassette (ABC) transporter family, P-gp is a protein encoded by the gene Mdr1 in humans and Abcb1 in rodents (represented by 2 isoforms Abcb1a and Abcb1b). Lining the luminal and abluminal membrane of brain capillary endothelial cells, P-gp is a promiscuous efflux pump extruding a variety of exogenous toxins and drugs. In this study, we measured dynamic changes in Abcb1a and Abcb1b transcripts and P-gp protein in the brain, liver, and kidney after experimental stroke. P-glycoprotein has been shown to increase in brain endothelial cells following hypoxia in vitro or after exposure to proinflammatory cytokines. Using a rat model of ischemic stroke, we hypothesized that P-gp expression will be increased in the brain, liver, and kidney in response to neuroinflammation following ischemic stroke. Adult Sprague Dawley rats underwent middle cerebral artery occlusion (MCAO) for 90 minutes and were killed at 4, 14, 24, and 48 hours postreperfusion onset to determine the time course of P-gp expression. To mimic ischemia occurring at the blood-brain barrier, rat brain endothelial (RBE4) cells were subjected to hypoxia and low glucose (HLG) for 16 hours. Immunoblotting analyses showed P-gp increases in brain and liver following 90-minute MCAO, as well as in cultured RBE4 cells after 16-hour HLG treatment, but fluctuated in the kidney depending on the time point. The relative roles of each isoform in the protein expression were analyzed with quantitative reverse transcriptase polymerase chain reaction. Ischemic stroke leads to significant increases in P-gp levels not only in the brain but also in the liver. The increase in P-gp could dramatically reduce the bioavailability and efficacy of neuroprotective drugs. Therefore, P-gp represents a big hurdle to drug delivery to the ischemic brain.
Keywords: Abcb1/Mdr1; P-glycoprotein; ischemia; kidney; liver; stroke.
Conflict of interest statement
DECLARATION OF CONFLICTING INTERESTS: The author(s) declared no potential conflicts of interest with respect to the research, authorship, and/or publication of this article.
Figures


Similar articles
-
The multidrug resistance 1 gene Abcb1 in brain and placenta: comparative analysis in human and guinea pig.PLoS One. 2014 Oct 29;9(10):e111135. doi: 10.1371/journal.pone.0111135. eCollection 2014. PLoS One. 2014. PMID: 25353162 Free PMC article.
-
Abcb1a and Abcb1b expression in senescence-accelerated mouse (SAM).Neurosci Lett. 2009 May 29;456(1):34-8. doi: 10.1016/j.neulet.2009.03.067. Epub 2009 Mar 27. Neurosci Lett. 2009. PMID: 19429129
-
Influence of intermittent hypoxia on myocardial and hepatic P-glycoprotein expression in a rodent model.Pharmacotherapy. 2009 Apr;29(4):365-72. doi: 10.1592/phco.29.4.365. Pharmacotherapy. 2009. PMID: 19323616 Free PMC article.
-
Structure, function and regulation of P-glycoprotein and its clinical relevance in drug disposition.Xenobiotica. 2008 Jul;38(7-8):802-32. doi: 10.1080/00498250701867889. Xenobiotica. 2008. PMID: 18668431 Review.
-
Regulation and function of the multidrug resistance genes in liver.Prog Liver Dis. 1995;13:101-23. Prog Liver Dis. 1995. PMID: 9224499 Review.
Cited by
-
Transport Mechanisms at the Blood-Brain Barrier and in Cellular Compartments of the Neurovascular Unit: Focus on CNS Delivery of Small Molecule Drugs.Pharmaceutics. 2022 Jul 20;14(7):1501. doi: 10.3390/pharmaceutics14071501. Pharmaceutics. 2022. PMID: 35890396 Free PMC article. Review.
-
3D In Vitro Blood-Brain-Barrier Model for Investigating Barrier Insults.Adv Sci (Weinh). 2023 Apr;10(11):e2205752. doi: 10.1002/advs.202205752. Epub 2023 Feb 13. Adv Sci (Weinh). 2023. PMID: 36782313 Free PMC article.
-
Neural Progenitor Cell-Derived Extracellular Vesicles Enhance Blood-Brain Barrier Integrity by NF-κB (Nuclear Factor-κB)-Dependent Regulation of ABCB1 (ATP-Binding Cassette Transporter B1) in Stroke Mice.Arterioscler Thromb Vasc Biol. 2021 Mar;41(3):1127-1145. doi: 10.1161/ATVBAHA.120.315031. Epub 2020 Dec 17. Arterioscler Thromb Vasc Biol. 2021. PMID: 33327747 Free PMC article.
-
Hypoxia Induces Astrocyte-Derived Lipocalin-2 in Ischemic Stroke.Int J Mol Sci. 2019 Mar 13;20(6):1271. doi: 10.3390/ijms20061271. Int J Mol Sci. 2019. PMID: 30871254 Free PMC article.
-
A review of bioeffects induced by focused ultrasound combined with microbubbles on the neurovascular unit.J Cereb Blood Flow Metab. 2022 Jan;42(1):3-26. doi: 10.1177/0271678X211046129. Epub 2021 Sep 22. J Cereb Blood Flow Metab. 2022. PMID: 34551608 Free PMC article.
References
-
- Abbott NJ. Blood-brain barrier structure and function and the challenges for CNS drug delivery. J Inherit Metab Dis. 2013;36:437–449. - PubMed
-
- Decleves X, Regina A, Laplanche JL, et al. Functional expression of P-glycoprotein and multidrug resistance-associated protein (Mrp1) in primary cultures of rat astrocytes. J Neurosci Res. 2000;60:594–601. - PubMed
-
- Miller DS, Nobmann SN, Gutmann H, Toeroek M, Drewe J, Fricker G. Xenobiotic transport across isolated brain microvessels studied by confocal microscopy. Mol Pharmacol. 2000;58:1357–1367. - PubMed
-
- Fromm MF. Importance of P-glycoprotein at blood-tissue barriers. Trends Pharmacol Sci. 2004;25:423–429. - PubMed
LinkOut - more resources
Full Text Sources
Other Literature Sources
Miscellaneous

