. 2017 Apr 19:8:152.
doi: 10.3389/fneur.2017.00152. eCollection 2017.

Molecular Taxonomy of Sporadic Amyotrophic Lateral Sclerosis Using Disease-Associated Genes

Affiliations

Molecular Taxonomy of Sporadic Amyotrophic Lateral Sclerosis Using Disease-Associated Genes

Giovanna Morello et al. Front Neurol. .

Abstract

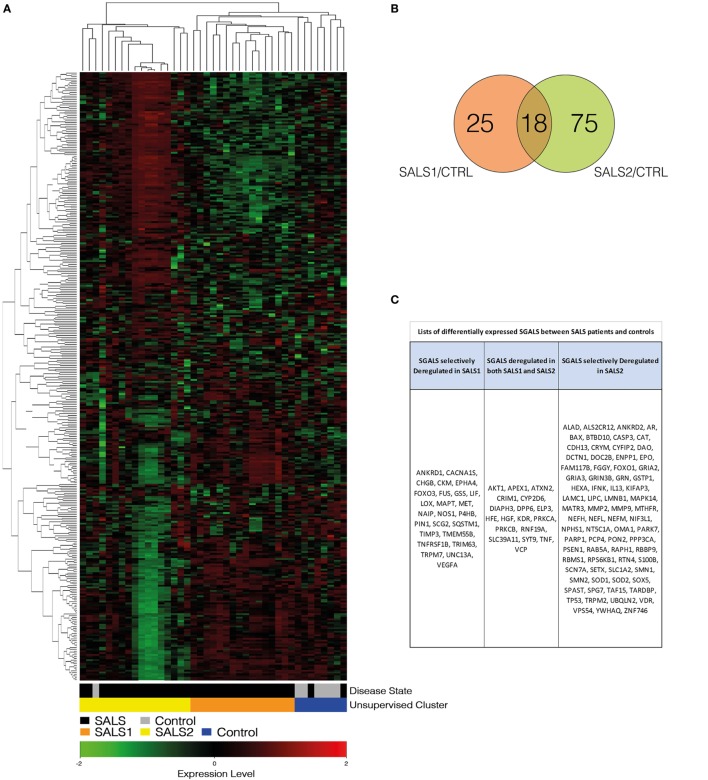
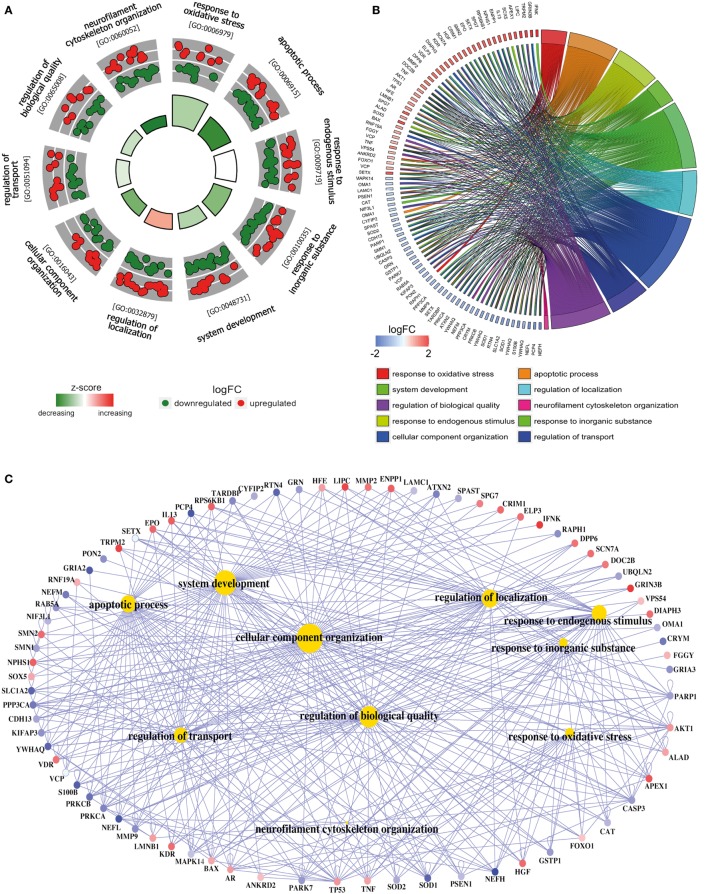
Amyotrophic lateral sclerosis (ALS) is a fatal neurodegenerative disease characterized by selective loss of upper and lower motor neurons. Despite intensive research, the origin and progression of ALS remain largely unknown, suggesting that the traditional clinical diagnosis and treatment strategies might not be adequate to completely capture the molecular complexity underlying the disease. In our previous work, comprehensive genomic profiling of 41 motor cortex samples enabled to discriminate control from sporadic ALS patients and segregated these latter into two distinct subgroups, each associated with different deregulated genes and pathways. Interestingly, some deregulated genes in sporadic ALS were previously associated with familiar ALS, indicating shared pathogenic mechanisms between the two forms of disease. In this, we performed cluster analysis on the same whole-genome expression profiles using a restricted (203) subset of genes extensively implicated in monogenic forms of ALS. Surprisingly, this short and unbiased gene list was sufficiently representative to allow the accurate separation of SALS patients from controls and the stratification of SALS patients into two molecularly distinct subgroups. Overall, our findings support the existence of a molecular taxonomy for ALS and represent a further step toward the establishment of a molecular-based diagnosis and patient-tailored therapies.

Keywords: amyotrophic lateral sclerosis; expression profiling; gene ontology analysis; genomics; molecular classification of disease subtypes.


Figures

Figure 1
Figure 1
Unsupervised hierarchical clustering of control and SALS patients. (A) Unsupervised hierarchical clustering was used to cluster control and SALS patients on the basis of the similarity in their SGALS expression profiles. In this two-dimensional presentation, each column represents a motor cortex from control or SALS patients, while each row represents a single gene probe. As shown in the color bar, red indicates upregulation, green downregulation, and black no change. In the dendrograms shown (left and top), the length and the subdivision of the branches display the relatedness of the expression of the probes and the motor cortex (top). (B) Venn diagrams of differentially expressed SGALS in SALS1 and SALS2 versus controls (Tables S2 and S3 in Supplementary Material). (C) Lists of the SGALS differentially expressed in each of the two SALS patient subsets in comparison with controls, identifying those commonly affected in both classes and those selectively affected in a single patient subgroup. Details are provided in Tables S1–S3 in Supplementary Material.
Figure 2
Figure 2
Functional analysis of deregulated SGALS in SALS1. (A) The outer circle shows a scatter plot of the expression levels (logFC) for SALS1-related differentially expressed SGALS in each enriched gene ontology (GO) term: red circles indicate upregulation and blue ones downregulation. The inner ring is a bar plot where the height of the bar indicates the significance of GO terms (log10-adjusted P value), and color corresponds to the z-score: green, decreased; red, increased; and white, unchanged. (B) The plot shows the relationship between statistically significant SGALS in SALS1 and their related GO terms; for each gene, the logFC value is shown by red/blue colored rectangles. (C) Gene-concept networks by GO analysis for differentially expressed SGALS in SALS1, using GeneAnswers Package. Yellow hubs correspond to the most enriched GO terms; red and blue nodes represent downregulation and upregulation of SGALS in SALS1, respectively. The size of each yellow hub is proportional to the statistical significance of the identified genes in corresponding GO categories. Details are provided in Table S4 in Supplementary Material.
Figure 3
Figure 3
Functional analysis of deregulated SGALS in SALS2. (A) The outer circle shows a scatter plot of the expression levels (logFC) for SALS2-related differentially expressed SGALS in each enriched gene ontology (GO) term: red circles indicate upregulation and blue ones downregulation. The inner ring is a bar plot where the height of the bar indicates the significance of GO terms (log10-adjusted P value), and color corresponds to the z-score: green, decreased; red, increased; and white, unchanged. (B) The plot shows the relationship between statistically significant SGALS in SALS2 and their related GO terms; for each gene, the logFC value is shown by red/blue colored rectangles. (C) Gene-concept networks by GO analysis for differentially expressed SGALS in SALS2, using GeneAnswers Package. Yellow hubs correspond to the most enriched GO terms; red and blue nodes represent downregulation and upregulation of SGALS in SALS2, respectively. The size of each yellow hub is proportional to the statistical significance of the identified genes in corresponding GO categories. Details are provided in Table S5 in Supplementary Material.

Similar articles

Cited by

References

    1. Wijesekera LC, Leigh PN. Amyotrophic lateral sclerosis. Orphanet J Rare Dis (2009) 4:3.10.1186/1750-1172-4-3 - DOI - PMC - PubMed
    1. Agosta F, Al-Chalabi A, Filippi M, Hardiman O, Kaji R, Meininger V, et al. The El Escorial criteria: strengths and weaknesses. Amyotroph Lateral Scler Frontotemporal Degener (2015) 16(1–2):1–7.10.3109/21678421.2014.964258 - DOI - PubMed
    1. Pasinelli P, Brown RH. Molecular biology of amyotrophic lateral sclerosis: insights from genetics. Nat Rev Neurosci (2006) 7(9):710–23.10.1038/nrn1971 - DOI - PubMed
    1. Lederer CW, Torrisi A, Pantelidou M, Santama N, Cavallaro S. Pathways and genes differentially expressed in the motor cortex of patients with sporadic amyotrophic lateral sclerosis. BMC Genomics (2007) 8(1):26.10.1186/1471-2164-8-26 - DOI - PMC - PubMed
    1. Ravits J, Appel S, Baloh RH, Barohn R, Brooks BR, Elman L, et al. Deciphering amyotrophic lateral sclerosis: what phenotype, neuropathology and genetics are telling us about pathogenesis. Amyotroph Lateral Scler Frontotemporal Degener (2013) 14(Suppl 1):5–18.10.3109/21678421.2013.778548 - DOI - PMC - PubMed

LinkOut - more resources